 Open Access Article
Creative Commons Attribution 3.0 Unported Licence
Application of a coupled smoothed particle hydrodynamics (SPH) and coarse-grained (CG) numerical modelling approach to study three-dimensional (3-D) deformations of single cells of different food-plant materials during drying
C. M.
Rathnayaka
 ab,
H. C. P.
Karunasena
 c,
W.
Senadeera
 d and
Y. T.
Gu
 *a
*a
aQueensland University of Technology (QUT), Science and Engineering Faculty, School of Chemistry Physics and Mechanical Engineering, 2- George Street, Brisbane, QLD 4001, Australia. E-mail: yuantong.gu@qut.edu.au; Fax: +61-7-3138 1469; Tel: +61-7-3138 1009
bDepartment of Chemical and Process Engineering, Faculty of Engineering, University of Moratuwa, Moratuwa, Sri Lanka
cDepartment of Mechanical and Manufacturing Engineering, Faculty of Engineering, University of Ruhuna, Hapugala, Galle, Sri Lanka
dSchool of Mechanical and Electrical Engineering, University of Southern Queensland, Springfield, Australia
First published on 16th January 2018
Abstract
Numerical modelling has gained popularity in many science and engineering streams due to the economic feasibility and advanced analytical features compared to conventional experimental and theoretical models. Food drying is one of the areas where numerical modelling is increasingly applied to improve drying process performance and product quality. This investigation applies a three dimensional (3-D) Smoothed Particle Hydrodynamics (SPH) and Coarse-Grained (CG) numerical approach to predict the morphological changes of different categories of food-plant cells such as apple, grape, potato and carrot during drying. To validate the model predictions, experimental findings from in-house experimental procedures (for apple) and sources of literature (for grape, potato and carrot) have been utilised. The subsequent comaprison indicate that the model predictions demonstrate a reasonable agreement with the experimental findings, both qualitatively and quantitatively. In this numerical model, a higher computational accuracy has been maintained by limiting the consistency error below 1% for all four cell types. The proposed meshfree-based approach is well-equipped to predict the morphological changes of plant cellular structure over a wide range of moisture contents (10% to 100% dry basis). Compared to the previous 2-D meshfree-based models developed for plant cell drying, the proposed model can draw more useful insights on the morphological behaviour due to the 3-D nature of the model. In addition, the proposed computational modelling approach has a high potential to be used as a comprehensive tool in many other tissue morphology related investigations.
1. Introduction
Drying is one of the most common and cost effective techniques for the preservation of food and for the production of traditional as well as innovative processed products.1 According to statistical information, drying is generally employed to preserve approximately 20% of the entire world's perishable crops annually.2 During drying, moisture content of the food cellular structure is reduced to increase the shelf life by obstructing the microbiological activities. The moisture content reductions lead to volumetric deformations in the cellular structure. These changes directly influence the drying process performance and dried food quality. Therefore, a sound understanding on the underlying mechanisms is necessary to optimally control such characteristics as influenced by microstructural deformations. In addition, moisture content3–8 and drying temperature9 also act as driving forces for the microstructural deformations during drying. Moisture content has a strong correlation with cell turgor pressure,10 and drying temperature is directly correlated with the rate of the moisture removal from the drying environment. To analyse such relationships, numerous microscale theoretical11,12 and empirical models3,5,13,14 have been reported in literature.Most of the food drying modelling applications in the literature study the relationship between macro-scale characteristics and drying process parameters.15 Usually, these models are based on empirical or theoretical investigations. In general, they lack common applicability due to the specific experimental setup usage.14 Accordingly, the established relationships tend to have limitations in the in validity for the specific plant food categories under pre-specified drying conditions.16 The empirical coefficients used in those models could deviate from realistic behaviours.17 The theoretical models are generally based on heat and mass transfer principles (e.g. Fick's law). As they use sophisticated theoretical relationships along with oversimplified boundary conditions, there are limitations in the applicability.15 In addition, as nonlinear diffusion equations are often used in these theoretical drying models, the computational cost of the numerical implementation have the tendency to be excessive.14,18,19
Numerical modelling is an efficient and effective tool in morphological analysis of various types of materials. Until the recent times, it had not been used for comprehensively studying morphological changes of food-plant cellular structure during drying. However recently, a meshfree-based novel numerical modelling approach has attracted attention as a feasible technique for serving this purpose.20–22 Through such comprehensive numerical models, benefits could be achieved in food drying engineering to improve the drying process performance and product quality.14 Further, there has been progress in the field of computational modelling of morphological instability and related surface wrinkling phenomena in soft materials.23 Surface wrinkling phenomena present in dried plant cellular structure is an interesting area that has not been explored with a computational modelling perspective until the recent times. Microstructural morphological changes in plant cellular structure during drying often involves large deformations, nonlinear constitutive relations and complicated multiphase phenomena. This makes it difficult to be modelled and simulated with conventional grid-based methods such as Finite Element Method (FEM) and Finite Volume Method (FVM). Hence, numerically modelling morphological characteristics of plant cellular structure during drying using a meshfree approach has gained popularity due to the ability to handle such complicated physics in a versatile manner.14
Accordingly, there are a number of recently reported efforts to numerically model the macro and micro mechanics of food-plant cells/tissues using a coupled Smoothed Particle Hydrodynamics (SPH) and Discrete Element Method (DEM) approach.14 Some of these studies focus only on the fresh plant cellular structure and its behaviour under external mechanical loading.24 There are some studies considering the morphological changes of both fresh and dried plant cellular structure in two dimensions (2-D).22 The predictions of this model agree well with the experimental findings both quantitatively and qualitatively.25 Drying phenomena have been incorporated into the models through changes of the moisture content, turgor pressure and cell wall contractions. The higher capability of this meshfree-based approach is evident, particularly in handling large deformations and a higher degree of moisture reduction.22 The computational approach in these investigations has been numerically validated through computational consistency comparisons.20 In addition, the predictions of these 2-D models have been validated by comparing the model predictions with experimental findings.26 However, there is a major limitation in these plant cellular drying models. It is the 2-D nature inhibiting the opportunity to study the true cellular level deformations which are 3-D by nature. This highlights the necessity for a 3-D meshfree-based cellular drying model, which is a key aim of our investigation.
To develop such a 3-D cellular drying model, there are several conceptual constraints in using the Discrete Element Method (DEM) to represent the cell wall membrane. Originally DEM had been introduced to the numerical modelling field in order to solve problems in soil mechanics. According to DEM fundamentals, particles can have different geometries and physical properties. The interactions between DEM particles are indirect ones. On the other hand, plant cell wall can be treated as a continuous thin membrane consisting of various biopolymers. The literature15–17 suggests that conceptually, a Coarse-Grained method (CG) could be more suitable for this application. In CG, a network of representative particles or molecules is used to define the entire system where the characteristics of the entire system are concentrated into these particles.27 The interactions between CG particles can be specifically interpreted to reflect the real physical behaviour of the systems. The literature suggests that CG has been widely used to model and simulate various kinds of biopolymers including the ones that make up the plant cell walls.28–30
Within this background, the aim of this investigation was to develop a more realistic three-dimensional (3-D) numerical model using a SPH-CG coupled approach. Further, it aimed to simulate the morphological behaviour of apple, potato, grape and carrot plant cells during drying. In this article, firstly the numerical modelling methodology will be discussed followed by the computational implementation methodology. Next, 3-D model predictions will be qualitatively and quantitatively analysed through comprehensive comparisons with relevant experimental findings. Finally, the key conclusions will be discussed along with potential for future work.
2. Numerical modelling methodology
2.1 3-D particle representation of a single cell
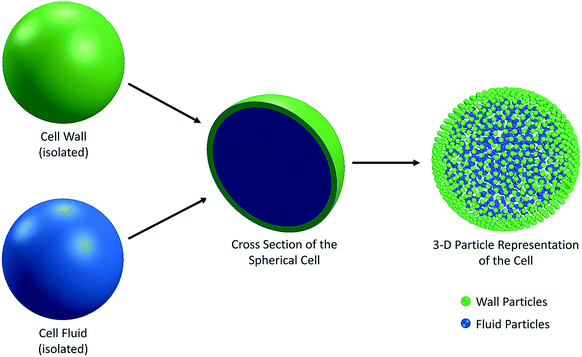
Plant cells are the fundamental building blocks which make up the whole plant structure. There are different physiological and biochemical functions implemented by different types of cells and the agglomeration of all these functions establishes a biological unity. Out of the main kinds of the tissues in plants, ground tissue system contributes to the largest part and the parenchyma cells are the major component involved there.31 Parenchyma refers to the tissue consisting of living cells. Usually parenchyma cells have thin cell walls and they usually occur as a continuous medium in the primary plant body.31,32 They also play crucial roles of regeneration and wound healing. In this background, the main focus of this study was on parenchyma cells. The thinness of the parenchyma cell walls was also a reason behind the selection as it significantly reduces the complexity of the cell wall. Many state-of-the-art theoretical and numerical studies have focused mainly on the single cell systems, which assist understanding the fundamental characteristics of the cellular dynamics during drying.20,25 Accordingly, in recent meshfree-based single cell modelling approaches introduced by Van Liedekerke et al.24,33,34 and Karunasena et al.,20–22,25,26,35–37 the cell fluid and cell wall have been considered as the two main components of a single cell.14 There, the cell fluid has been approximated to a viscous homogeneous Newtonian liquid and modelled with Smoothed Particle Hydrodynamics (SPH). In this study, we also used the same approach to treat the cell fluid. The cell wall was considered as a semi-permeable solid membrane with viscoelastic properties, and modelled as an incompressible Neo-Hookean material using a Coarse-Grained approach (CG). At the same time, the morphological descriptions of plant cells which come from relevant experimental literature were taken into consideration8,38,39 in the design and development of this 3-D model. Accordingly, the basic structure of a plant parenchyma cell was considered as a flexible solid wall enclosing a fluid mass.8,20,31,38,40–45 A physical balance was hypothesised between the cell fluid hydrodynamic pressure and the cell wall tension. In other words, the flexible cell wall holds the cell fluid mass inside by balancing the forces exerted by the fluid and in return, there is a stress development in the cell wall itself. Depending on the nature of the dynamics that the cell is subjected, the cell wall can either stretch or contract (i.e. inflation or shrinkage). The basic geometry of a single cell was considered to be spherical for all the food-plant categories.38 The cell fluid geometry was approximated to a solid sphere and the cell wall was taken as a hollow three-dimensional (3-D) spherical shell enclosing the fluid content (Fig. 1). The cell fluid was assumed to be incompressible and the whole system is regarded as isothermal.20,25With these fundamental approximations, the physical nature of the initial cell model was established. Next, the cell fluid and cell wall were discretised using particle schemes in order to computationally implement the model (see Fig. 1). This is a basic principle that comes under SPH,46–48 where the interactions among the particles are described using a number of governing equations representing different types of interacting force fields. Due to the flexibility of the SPH-CG particle framework used in this model, there is a significant potential to be upgraded to a tissue system.24,34
When considering the similar work in this line of research, some researchers have only addressed the 2-D behaviour of plant cellular systems,20–22,25,26,35,36 whereas some others have studied the mechanical response of fresh cells and tissues under external mechanical loading.24,33,34 Therefore, this investigation addresses the research gap of modelling three dimensional (3-D) morphological characteristics of single plant cells during drying.
2.2 Cell fluid model
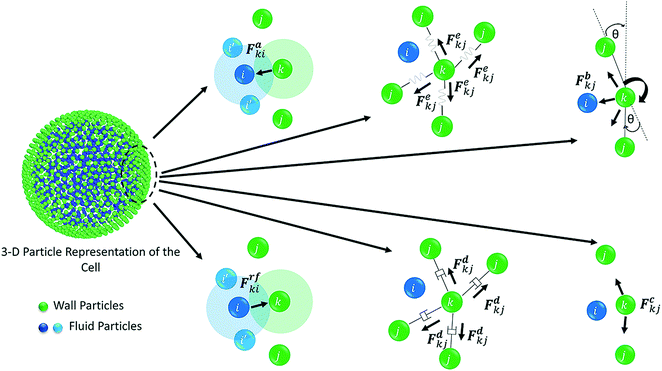
The water content of the cell protoplasm (fluid) can be as high as 80–90% by volume of the entire cell.34 Therefore, for numerical modelling purposes, the cell fluid can be approximated to an incompressible homogeneous Newtonian fluid equivalent to water.14 Accordingly, the Navier–Stokes equations can be used for modelling. However, an elevated viscosity value has to be incorporated in order to comply with low Reynolds number viscous characteristics.20 Accordingly, as depicted in Fig. 2, the cell fluid can be modelled with four different types of force interactions: pressure forces (Fp), viscous forces (Fv), wall–fluid repulsion forces (Frw) and wall–fluid attraction forces (Fa).49 The summation of all four forces defines the total force Fi on any fluid particle i as (eqn (1)), | (1) |
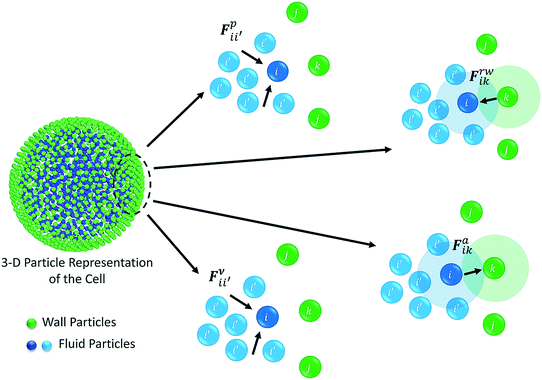 | ||
| Fig. 2 Force fields on the 3-D fluid particle domain: pressure forces (Fp), viscous forces (Fv), wall–fluid repulsion forces (Frw) and wall–fluid attraction forces (Fa). | ||
According to the standard Lagrangian type SPH equations, which are used to model weakly compressible low Reynold's number fluid flows,24,50 the momentum equation estimates the pressure forces ( ) and viscous forces (
 ) for any given fluid particle i as a summed influence from its neighbouring fluid particles i′. These are formulated as (eqn (2) and (3)),
 | (2) |
 | (3) |
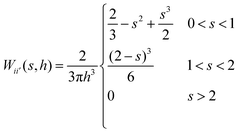 | (4) |
 and
and  ). It is because the values of field properties are taken as smoothed and summed influences across the SPH influence domain of each particle.48 With the subsequent deformations of the cellular model, the smoothing length h has to evolve. This is a computational requirement for maintaining an optimum number of fluid particles within the influence domain of each particle.25 For this purpose, a simple geometrical relationship has been employed as,
 | (5) |
 | (6) |
 | (7) |
 | (8) |
To update the density, the standard SPH continuity equation is used as given in eqn (9),48
 | (9) |
 | (10) |
The repulsion forces Frwik and attraction forces Faik act on a given fluid particle i due to the influence of the surrounding wall particles. These forces are described similar to their counterpart LJ forces in the cell wall domain and are defined as given in eqn (11) and (12) (see Section 2.3 for more details).
 | (11) |
 | (12) |
2.3 Cell wall model
Wall is the system boundary of a cell. It plays a critical role in defining the morphology of a plant. Plant cell walls are mainly made up of biopolymers including cellulose, hemicellulose and pectin.28–30 The combination of these biopolymers provides the mechanical strength to a cell and eventually to the whole plant. The bio-polymeric cell wall membrane could not be analysed with a simple linear elasticity theory. Mechanically, the cell wall material exhibits both elastic and plastic behaviour while energy dissipation could be attributed to viscous and structural damping. This behaviour strongly depends on the time scale of the analysis.34,51 In this particular work, a Coarse-Grained (CG) approach was used where the representative CG particles were distributed on a spherical surface, having a local connectivity while interacting through a number of force fields. Accordingly, each CG element carries properties of the corresponding cell wall segment. The deformations are represented by the displacement of respective particles using six types of force interactions: Stiff forces (harmonic energy) (Fe), damping forces (Fd), wall–fluid repulsion forces (Frf), wall–fluid attraction forces (Fa), bending stiffness forces (Fb) and cell wall contraction forces (Fc) as presented in Fig. 3.20,22,25 Accordingly, the total force (Fk) on any wall particle k is derived as in eqn (13),| Fk = Fekj + Fdkj + Frfki + Faki + Fbkj + Fckj | (13) |
 | (14) |
Damping forces (Fd) were incorporated to the model in order to account for viscous characteristics of the fibrous–polymeric cell wall material and have been defined using a linear dashpot model. Accordingly, the viscous forces Fdkj acting on any wall particle k were calculated as given in eqn (15).20
| Fdkj = −γvkj | (15) |
| Frfki = frfkixki | (16) |
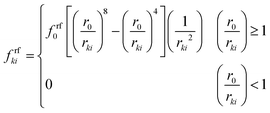 | (17) |
 | (18) |
Karunasena et al. have used wall bending stiffness forces (Fb) and wall contraction forces (Fc) in the physical interaction description of their 2-D coupled SPH-DEM cellular drying models.20,25 The bending stiffness forces represent the bending resistance present in plant cell wall microstructures. They resist any unrealistic deformations which could occur in the cell wall during simulations.52 In alignment with a number of recent studies on red blood cell models, 3-D wall bending forces (Fb) were incorporated through wall bending stiffness and bending energy (Eb).53–56 The bending energy (Eb) could be determined using the formulation shown below (eqn (19)).
 | (19) |
 | (20) |
![[n with combining circumflex]](https://www.rsc.org/images/entities/b_i_char_006e_0302.gif) ijk and
ijk and ![[n with combining circumflex]](https://www.rsc.org/images/entities/b_i_char_006e_0302.gif) ilj are the unit normal vectors specific to the geometry used in this computational procedure. Next, this equation was partially differentiated to obtain the bending force (Fb) acting on the corresponding particle (eqn (21))
ilj are the unit normal vectors specific to the geometry used in this computational procedure. Next, this equation was partially differentiated to obtain the bending force (Fb) acting on the corresponding particle (eqn (21)) | (21) |
Next, wall contraction forces (Fc) were included to represent the cell perimeter reductions observed in drying experiments.25 An empirical–analytical formulation which was defined by Karunasena et al. in their SPH-DEM cell modelling studies25 was used to calculate the 3-D wall contraction force term (Fc) as given in eqn (22).
Here, kwc is the force coefficient for wall contractions, L, the current width of a given wall element, L0′ the width at fully turgid condition. a and b are empirical factors which were selected depending on the plant cell category (i.e. apple, potato etc.)25 and the normalised moisture content of the dry cell to be simulated (X/X0).
 | (22) |
2.4 Modelling different categories of food-plant materials
| Model parameter | Food-plant category | |||
|---|---|---|---|---|
| Apple (ref.) | Potato (ref.) | Grape (ref.) | Carrot (ref.) | |
| Initial cell radius [μm] | 75 (Karunasena et al.26) | 100.0 (Hepworth & Bruce,52 Lewicki & Pawlak8) | 75 (Schlosser et al.57) | 50 (Lewicki & Drzewucka39 McGarry58 Sansiribhan et al.59) |
| Initial cell wall thickness [μm] | 6.0 (Van Liedekerke et al.24 Wu & Pitts60) | 1.0 (Hepworth & Bruce52) | 3.0 (Schlosser et al.57) | 2.0 (McGarry58 Goerget et al.61) |
| Cell wall shear modulus (G) [MPa] | 18 (Van Liedekerke et al.24 Wu & Pitts60) | 166 (Hepworth & Bruce52) | 33 (Karunasena et al.35) | 33 (Karunasena et al.35) |
| Empirical factors on cell wall contraction (a, b) | 0.20, 0.9 (Karunasena et al.26) | 0.07, 0.92 (Campos-Mendiola et al.62) | 0.18, 0.43 (Ramos63) | 0.36, 0.93 (Sansiribhan et al.59) |
| Turgor pressure of fresh cell (PT) [kPa] | 200 (Van Liedekerke et al.24) | 200 (Karunasena et al.35) | 200 (Karunasena et al.35) | 400 (McGarry58) |
| Osmotic potential of fresh cell (−Π) [kPa] | −200 (Van Liedekerke et al.24) | −200 (Karunasena et al.35) | −200 (Karunasena et al.35) | −400 (McGarry58) |
| Number of fluid particles (nf) | 3082 | 3708 | 3082 | 2143 |
| Number of wall particles (nw) | 2067 | 2516 | 2067 | 1611 |
| SPH smoothing length (h) [μm] | 6.8 | 8.0 | 6.8 | 5.0 |
| Parameter | Value | Ref. |
|---|---|---|
| Cell fluid viscosity (μ) | 0.1 Pa s | Set (24 and 33) |
| Cell wall damping ratio (γ) | 5 × 10⁻⁶ Ns m−1 | Set (20) |
| Initial fluid density (ρ0) | 1000 kg m−3 | 24 |
| Cell wall permeability (LP) | 2.5 × 10⁻⁶ m2 N−1 s | 31 |
| Cell wall bending stiffness (kb) | 1.0 × 10⁻¹⁰ N m rad−1 | Set (35) |
| Cell wall contraction force coefficient (kwc) | 1.0 × 10⁴ N m−1 | Set (35) |
| Cell fluid compression modulus (K) | 20 MPa | Set (20) |
| Time step (Δt) | 1.0 × 10⁻⁹ s | Set |
2.5 Computational implementation and numerical evolution of the model during simulations
COMSOL Multiphysics software was used to create the initial particle geometries. Here, the fluid particle scheme was placed without any interconnections among particles, adhering to the meshfree fundamentals used in SPH. In the cell wall, the particles were placed adhering to the CG fundamentals, mainly with equal spacing.20,22,24During the numerical evolution of the model, the mass of the cell fluid tends to change leading to minor density variations.20 The key driving force behind this is the difference between the cell turgor pressure and the osmotic potential. For the time integration of the particle scheme, Leapfrog method22,48 was used where the magnitude of the time step was determined through the Courant–Friedrichs–Lewy (CFL) stability criterion.48,64 In alignment with SPH basics, the variation of the fluid density leads to fluctuation of the cell turgor pressure as governed by an equation of state (EOS) as given in eqn (6). Such turgor pressure variations drive the cell wall inwards (during shrinkage) or outwards (during inflation), causing variations of the cell volume. Based on such cell volume changes, the cell turgor pressure varies again since it has to be counterbalanced by the cell wall tension. The changes in cell turgor pressure leads to the cell fluid mass increments or losses as governed by a mass transfer equation represented in eqn (10).20 This cycle repeats during the computational evolution of the cell and eventually reaches the steady state condition.
For the implementation of boundary conditions, a method that has been successfully used in a number of recent meshfree-based numerical modelling studies on plant cells20,22,24,25,33–35 has been employed.14 It mainly involves a Lennard-Jones (LJ) type approach, where meshfree particles are used to represent the fluid and wall particles along with repulsive LJ force fields. Under this method, cell wall particles repel the fluid via these LJ type interactive forces.24,25,48 In order to make the repulsion forces more effective, a set of virtual particles are also incorporated, which are mass-less and artificially placed among the cell wall particles.20,22,34
It is noteworthy that a moisture-domain-based approach has been employed to represent the drying mechanism rather than adopting a time-domain-based approach. The main reason behind this was to reduce the computational cost associated with the time-domain-based approach.20 As an outcome of this, the whole drying mechanism for a single apple cell has been broken down into a number of separate steps. This approach has been successfully used before by Karunasena et al. in a numerical modelling study for 2-D cellular scale plant cell drying.25 A set of representative dried cell conditions were selected having separate moisture content and turgor pressure values for characterising the entire drying operation. The developed single cell numerical models were then employed to simulate those selected dryness states. Independent simulations were conducted via initiating the model with relevant moisture contents and turgor pressures. When the models reach the steady state conditions, they are referred to as the intermediate states of dryness which eventually combine together to form a complete drying operation.25
The turgor pressure of a fresh apple cell (X/X0 = 1) was taken as 200 kPa.3 Accordingly, the dryness states of X/X0 = 0.9, X/X0 = 0.7, X/X0 = 0.5, X/X0 = 0.3 and X/X0 = 0.1 were simulated at turgor pressure values of 180, 140, 100, 60 and 20 kPa, respectively. In each simulation, the value of the osmotic potential (Π) was maintained equal, but at the negative value of the corresponding turgor pressure value (Pi). After the achievement of steady state, the eventual cell physical properties and other geometrical parameters were used to represent the model predictions. Then, these model predictions were compared in detail with relevant experimental findings.25
For the experiments, Royal Gala apple (Malus Domestica) procured from Brisbane (Australia) were used with appropriate sample preparation techniques.65 For drying, a convective air dryer (Excalibur's five-tray dehydrator, USA) was used which has an electric heater and a fan to produce a controlled hot air flow across the samples throughout the experiments. The air temperature can be conveniently adjusted using a thermostat. For this particular series of experiments, an air temperature of 70 °C with a constant hot air velocity was maintained. The samples were introduced only after the dryer reaches the steady state condition following the initial warming-up cycle. It should be noted here that in order to capture the gradual morphological changes of the samples in each drying experiment, the same apple sample was used and intermittently observed using the microscope.
To quantify the cellular deformations in the model predictions, four geometrical parameters were employed: cell area (A), diameter† (D), perimeter (P) and roundness‡ (R). The variation of these parameters were analysed with the dry basis moisture content X (masswater/massdry![[thin space (1/6-em)]](https://www.rsc.org/images/entities/char_2009.gif) solid). To enable a better comparison, these parameters were normalised (A/A0, D/D0, P/P0 and R/R0) by dividing the current value of the parameter by the initial value at the fresh cell state (X0, A0, D0, P0 and R0). The model was established as a C++ source code and executed in a High Performance Computer (HPC). Algorithms of existing SPH source codes based on FORTRAN48,53 and C++20 were referred to in the development of the C++ source code for the 3-D cell. For the visualisations, Open Visualization Tool (OVITO)66 was used. To make these quantifications in the model predictions, inbuilt image processing techniques available in the ImageJ software was used.67,68
solid). To enable a better comparison, these parameters were normalised (A/A0, D/D0, P/P0 and R/R0) by dividing the current value of the parameter by the initial value at the fresh cell state (X0, A0, D0, P0 and R0). The model was established as a C++ source code and executed in a High Performance Computer (HPC). Algorithms of existing SPH source codes based on FORTRAN48,53 and C++20 were referred to in the development of the C++ source code for the 3-D cell. For the visualisations, Open Visualization Tool (OVITO)66 was used. To make these quantifications in the model predictions, inbuilt image processing techniques available in the ImageJ software was used.67,68
3. Results and discussion
3.1 Computational accuracy of the model
To determine the computational accuracy of the developed SPH-CG single cell model, a method adopted by several previous researchers20,24,25,34 in their SPH-DEM cell models was employed. In this method, the model prediction for the average hoop directional inter-particle force in the cell wall was compared with the theoretically expected value.§![[thin space (1/6-em)]](https://www.rsc.org/images/entities/char_2009.gif) 34 The percentage model consistency error¶ was calculated based on that difference. It assumes an equilibrium between the cell fluid turgor pressure and the tension in the cell wall according to Newton's third law and Young–Laplace law. For all the cell categories simulated in this study, the percentage model consistency error was maintained below 1%. It should be mentioned here that, this computational accuracy is significantly higher than the recently reported SPH-DEM 3-D fresh cell models.34
34 The percentage model consistency error¶ was calculated based on that difference. It assumes an equilibrium between the cell fluid turgor pressure and the tension in the cell wall according to Newton's third law and Young–Laplace law. For all the cell categories simulated in this study, the percentage model consistency error was maintained below 1%. It should be mentioned here that, this computational accuracy is significantly higher than the recently reported SPH-DEM 3-D fresh cell models.34
3.2 Simulation of deformations during drying
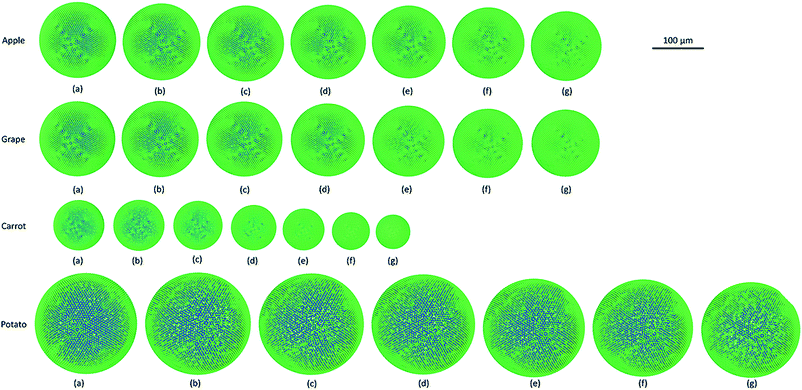
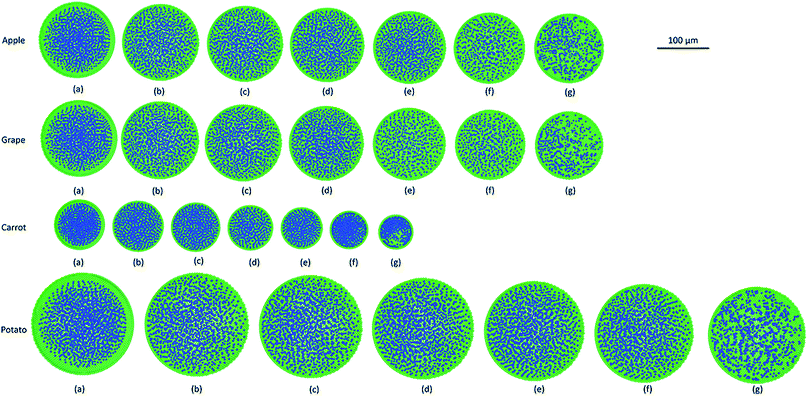
As it has been described in the computational implementation section (Section 2.5), for each plant cell category, a number of cell dryness states were simulated starting from a fresh state (X/X0 = 1.0 and PT = 200 kPa) to an extremely dried state (X/X0 = 0.1 and PT = 20 kPa). At this extremely dried state, 90% of the total moisture content gets removed from the cell model. Even the most recent grid-based numerical models which study the deformations of fruit tissues during dehydration69 are not capable of simulating a moisture content reduction of this degree.14 This highlights the significant ability of meshfree-based methods to model multiphase phenomena and large deformations more effectively.In Fig. 4, the model predictions are visualised for all the plant cell categories at all the dryness states. To make the model predictions further illustrative, sectioned side views corresponding to each dryness state are presented in Fig. 5. Particles have been colour-coded to easily distinguish between fluid (blue) and wall (green) particles. As it is visible in Fig. 4 and 5, the sizes of the cells gradually decrease with the increasing degree of dryness. When these predictions were compared with the results produced by 2-D SPH-DEM-based cellular drying simulations,20–22,25,35,36 it could be noted that the 3-D model depicts the true drying scenario in a more detailed and realistic manner.
Furthermore, it could be observed that the apple cells and grape cells have similar sizes while carrot cells are smaller in size. The potato cells are the largest. In all simulations, when comparing the initial particle configuration of the cells (i.e.Fig. 4(a) and 5(a)) and the fresh states (i.e.Fig. 4(b) and 5(b)), it could be observed that the cells have inflated (mainly due to the turgor pressure), resembling the turgid nature that is frequently observed in fresh cells and tissues. The dried cells have shrunk as seen in Fig. 4(c)–(g) and 5(c)–(g), approximating the shrinkage behaviour of real plant cells when subjected to drying. It could be qualitatively observed that there are differences in shrinkage among different categories of food-plant cells. The degree of shrinkage demonstrated by the potato cell is relatively lower compared to that of the carrot cell. A major reason behind this could possibly be the difference of ‘a’ value used in the wall contraction force field (Fckj) (eqn (22)). It should be noted here that the cell fluid particle number remains constant in all simulations and only the particle mass is reduced during drying following the fundamental 2-D meshfree based cellular drying models.20,25
It is also noteworthy that as this is a basic single cell scale model, a number of properties across the model have been considered to be isotropic for the sake of simplicity. For example, cell wall properties like permeability, thickness, shear modulus and damping coefficient could be given. However, the computational modelling approach discussed here have the capability to incorporate any local variations of such characteristics due to the particle-based methodology. In such occasions, different sections of the cell model can be assigned different values of properties such as wall permeability. The heterogeneity of the cellular structure could be addressed in a similar manner.
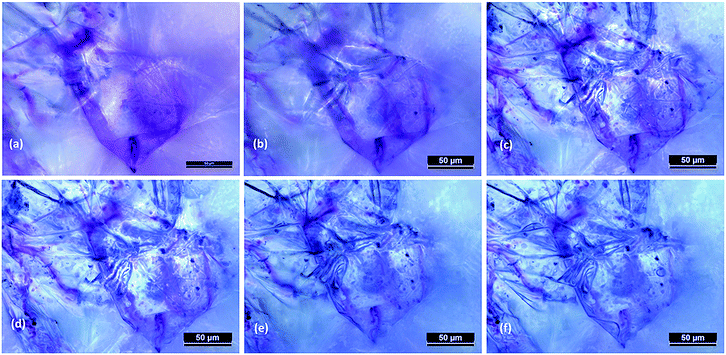
Next, the post processed model predictions were qualitatively compared with the results of experimental investigations on real plant cellular structures of apple, grape, carrot and potato. For this purpose, experimental findings from this study65 and from investigations reported in literature3,26 were used. In Fig. 6, microscopic images from an experimental investigation on the apple cellular structure during drying (involving 3-D digital light microscopy and image analysis techniques) are shown.65 It should be noted that these images exhibit the behaviour of a single apple parenchyma cell during the drying process. During the microscopic investigations, the same cell has been imaged at all different dryness states. This makes those images and subsequent results highly comparable with the developed SPH-CG single cell model. When Fig. 4–6 are compared, it is evident that there are similarities in the morphological changes during drying.
3.3 Quantifying the morphological behaviour of the models through geometrical parameters
The simulated deformations of the dried cell models for all food-plant categories were quantified using normalised cell area (A), feret diameter (D), perimeter (P) and roundness (R) as discussed in Section 2.5. These quantitative results were then compared with experimental findings from literature for apple, grape, carrot and potato cellular structures.3,26 At the same time, they were compared with the model predictions presented by Karunasena et al.25,35 in their SPH-DEM 2-D meshfree-based single cell drying models. | ||
| Fig. 7 Apple-single cell simulations at different states of dryness (green: wall particles, blue: fluid particles). | ||
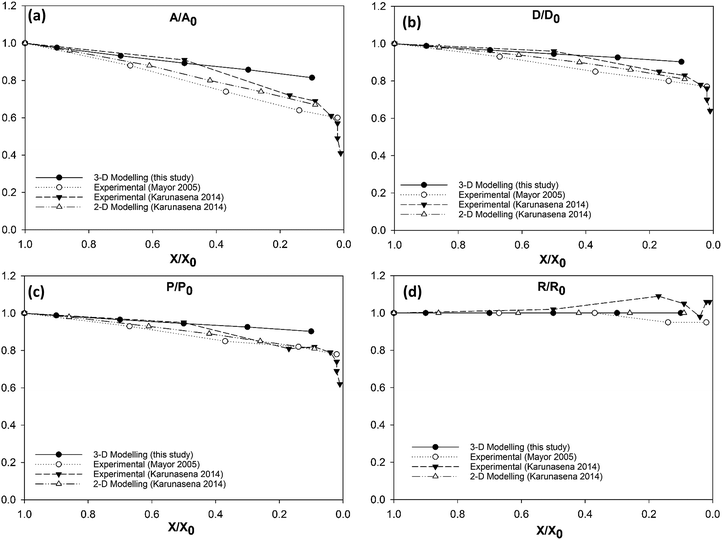 | ||
| Fig. 8 Apple cells-variation of normalised geometrical properties with the moisture content during drying: (a) A/A0 (area); (b) D/D0 (diameter); (c) P/P0 (perimeter); (d) R/R0 (roundness). | ||
In case of diameter variations (D/D0), the agreement between the model outcomes and the experimental findings show a similar trend (Fig. 8(b)) to the area variation. The model predictions from this study show an agreement with the experimental values from literature as well as with the model predictions from the previous study from Karunasena et al. The agreement is stronger in the high moisture contents. At low moisture levels, the model predictions from this study tends to slightly deviate from the experimental findings. For normalised perimeter, the comparison follows a similar trend to those of the area and the diameter (see Fig. 8(c)). Experimental findings and the previous 2-D model predictions show a reduction in the cell perimeter with decreasing moisture content. The results from this study demonstrate a favourable agreement with that behaviour. The model predictions show a decreasing cell perimeter which is in close coincidence with those values from the experiments and 2-D modelling attempts.
When it comes to cell roundness (R/R0), experimental findings show an unchanged value which is close to 1 throughout the drying process. As seen in Fig. 8(d), the predictions for the roundness in the 3-D models of this study follow a similar behaviour in the higher moisture levels before exhibiting a considerable discrepancy in the low moisture contents (X/X0 ≤ 0.5). That is, the roundness predicted by the model in this study becomes lower with the decreasing moisture content. This deviating behaviour is evident in the recently reported SPH-DEM 2-D plant cell drying models in a similar or higher degree.
 | ||
| Fig. 9 Potato-single cell simulations at different states of dryness (green: wall particles, blue: fluid particles). | ||
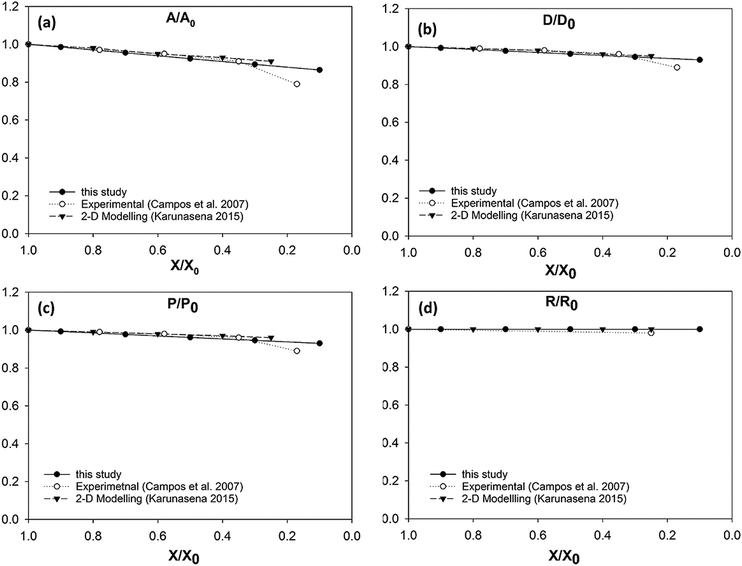 | ||
| Fig. 10 Potato cells-variation of normalised geometrical properties with the moisture content during drying: (a) A/A0 (area); (b) D/D0 (diameter); (c) P/P0 (perimeter); (d) R/R0 (roundness). | ||
It could be seen from Fig. 10(a) that there is a favourable agreement between the model predictions of this study and the experimental findings on potato cellular structure in terms of normalised area variation.62 Similar to the apple cell model behaviour discussed in the Section 3.3.1, there is a small deviation between the model predictions and experimental findings at the extremely dried states (X/X0 ≤ 0.3). The agreement between the model predictions and experimental findings demonstrate a similar behaviour for the cell diameter and the perimeter as seen from Fig. 10(b) and (c). There is a matching behaviour of the results apart from a slight deviation towards the lower end of the moisture domain. The normalised roundness variation of the cell model is also in close agreement with the experimental cell roundness variation.70 The value of roundness stays close to a value of 1.0 throughout the process. This is also evident from the post-processed model predictions seen in Fig. 9 where the cell exhibits a circular shape at all dryness states. In addition, the results of the 2-D SPH-DEM cellular drying model25 agree with the findings from this 3-D SPH-CG study.
 | ||
| Fig. 11 Grape-single cell simulations at different states of dryness (green: wall particles, blue: fluid particles). | ||
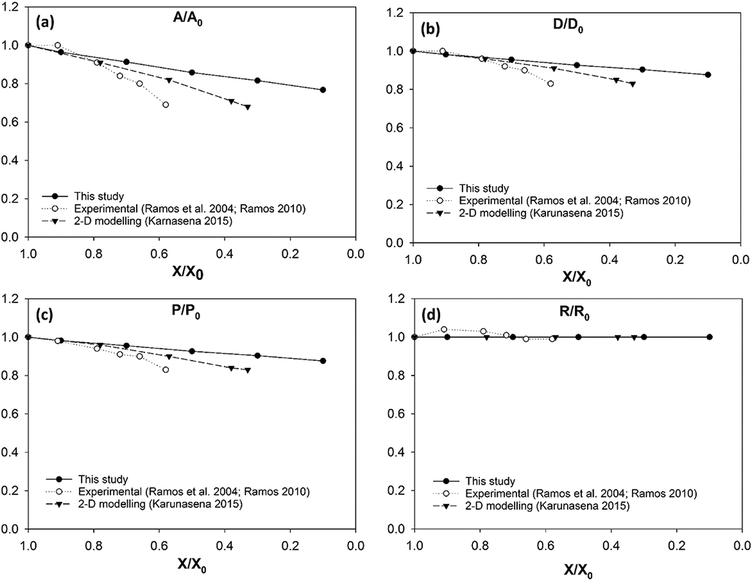 | ||
| Fig. 12 Grape cells-variation of normalised geometrical properties with the moisture content during drying: (a) A/A0 (area); (b) D/D0 (diameter); (c) P/P0 (perimeter); (d) R/R0 (roundness). | ||
Another key conclusion derived through the observation of Fig. 12 is that the 3-D SPH-CG numerical cell model developed under this study has the ability to model the cells throughout a larger moisture domain compared to recently reported 2-D SPH-DEM cellular drying models.35 2-D models have considered a moisture removal from the cellular system only up to approximately X/X0 = 0.3 while the 3-D model of this study has been able to model moisture removal up to X/X0 = 0.1. This provides a hint about the stability of the adopted computational coupling between SPH and CG. There is a slight deviation between the model predictions and experimental findings5,63 especially in the range of X/X0 = 0.8 to X/X0 = 0.6. The 2-D SPH-DEM model predictions also show this mismatch with the experimental findings to a certain degree as depicted in Fig. 12(a)–(c) respectively. One of the reasons behind this could possibly be the significantly smaller moisture content range addressed in the experimental studies. In addition, the lower magnification used in the microscopy could potentially be a contributing a reason for the discrepancy.5,35,63
As seen from Fig. 12(d), the roundness of the grape cell model stays almost constant throughout the entire drying process. This agrees with the conclusions drawn from the visualised numerical results in Fig. 11 where the cell maintains its circular shape even at very low moisture contents. This agrees with the findings from relevant experimental investigations5,63 as well as 2-D model predictions.35 However, 3-D model predictions do not demonstrate a significant cell wall wrinkling behaviour during drying. The absence of the cell–cell interactions could be one probable cause behind this. This again highlights the necessity to extend these single cell models into the multiple-cell levels to improve the efficacy of approximation.
 | ||
| Fig. 13 Carrot-single cell simulations at different states of dryness (green: wall particles, blue: fluid particles). | ||
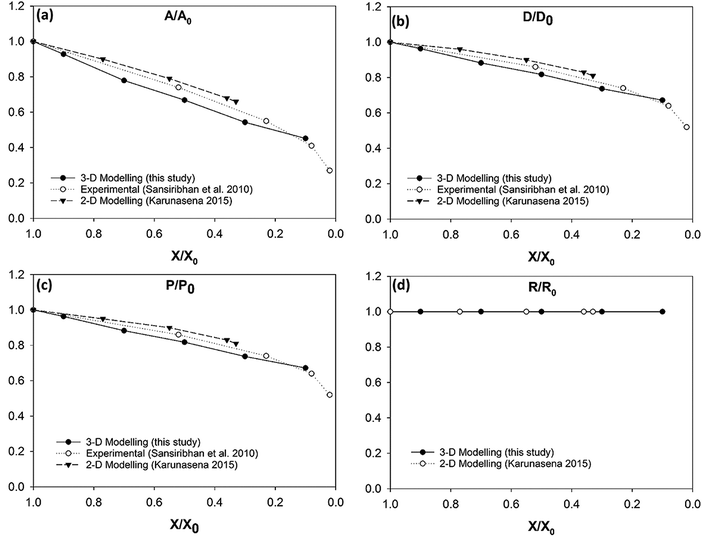 | ||
| Fig. 14 Carrot cells-variation of the normalised geometrical properties with the moisture content during drying: (a) A/A0 (area); (b) D/D0 (diameter); (c) P/P0 (perimeter); (d) R/R0 (roundness). | ||
| Normalised geometrical parameter | Value at (X/X0 = 0.1) | |||
|---|---|---|---|---|
| Apple | Potato | Grape | Carrot | |
| Area (A/A0) | 0.81 | 0.86 | 0.77 | 0.45 |
| Diameter (D/D0) | 0.90 | 0.93 | 0.88 | 0.67 |
| Perimeter (P/P0) | 0.90 | 0.93 | 0.88 | 0.67 |
| Roundness (R/R0) | 1.0 | 1.0 | 1.0 | 1.0 |
3-D model predictions for carrot cells during drying have been compared with experimental findings on real carrot microstructure35,59 (see Fig. 14). It is evident that there is an agreement between the 3-D model predictions and the experimental findings. The agreement is favourable even at low moisture content values (X/X0 ≤ 0.3). This is a unique positive characteristic observed in the carrot cell model because the other three types of cell models demonstrated a deviating behaviour from the experimental findings at the low end of the moisture domain.
This 3-D SPH-CG numerical cell model has the ability to model the carrot cells in a stable manner throughout a larger moisture domain compared to the 2-D SPH-DEM cellular drying models35 (see Fig. 14(a)–(c)). The 3-D cell model from this study has considered drying process up to a moisture content value of X/X0 = 0.1 while the 2-D models have considered up to X/X0 = 0.3. This occurrence could be observed in potato and grape cell models as well. The added stability of the models in this study could be arising due to the 3-D nature of the developed computational model.
In all the food-plant cellular drying models considered in this study, there are notable agreements with the experimental findings. However, there is further room for improving the performance of this computational modelling approach. As mentioned previously, one of the key limitations in this investigation is not taking cell–cell interactions into account in the physical description of the plant cellular structure. This could possibly be one of the major reasons behind the disagreements between model predictions and experimental findings. Also, the morphological behaviour of the cell wall plays a critical role towards the overall morphological behaviour of the cell model. Incorporating an enhanced cellular turgor pressure relationship could improve the morphological description of the cell wall model (compared to the realistic morphological behaviour). This could lead to overall performance improvements of this meshfree-based cellular drying model.
4. Conclusions
In this investigation, a three dimensional (3-D) coupled Smoothed Particle Hydrodynamics (SPH) and Coarse-Grained (CG) numerical approach has been used to model the morphological behaviour of four different categories of food-plant cells during drying. This computational model can simulate dryness states of food-plant cells in a wider moisture content range compared to the recent Finite Element Modelling (FEM)-based and meshfree-based plant cell drying models. The computational accuracy of this modelling and simulation scheme has been assessed through the percentage model consistency error (%MCE). The results show that this model has a high computational accuracy by limiting %MCE below 1%. To quantify the model predictions, four normalised geometrical parameters have been employed. The model predictions were qualitatively and quantitatively compared with experimental findings as well as with the 2-D numerical model predictions from literature. The comparisons confirmed that the developed 3-D SPH-CG numerical model can approximate the morphological changes of plant cells during drying.The agreement between the 3-D SPH-CG model predictions and experimental findings is favourable for all four food-plant categories considered. There are slight deviations towards the extremely dried conditions (X/X0 ≤ 0.3), particularly for apple, potato and grape cells. In carrot cells, there is a favourable agreement even at very low moisture content values.
This is a positive characteristic observed in this novel computational model relative to the previous 2-D SPH-DEM plant cell drying models. In addition, single cell-based drying experiments have been conducted to obtain 3-D details on the morphological changes of the plant cellular structure during drying. This experimental information has been a valuable source of validation data for the 3-D SPH-CG model predictions.
Improved stability of the computations is another key characteristic that was exemplified by this 3-D meshfree-based numerical model. In addition, it could be concluded that employing a CG approach to model the plant cell wall membrane has established a compatible numerical coupling with SPH. To improve the validity and applicability of the developed numerical model, extending this single cell approach to tissue level will be an important future work. In doing so, using enhanced computational algorithms might be necessary to cope with the increased computations in such complicated systems.71 In addition, the heterogeneity and anisotropic nature in the plant cellular structure could be addressed in future attempts through introducing localised property variations (e.g. cell wall permeability etc.). Incorporating temperature variation related effects is a further area for improvement. The proposed 3-D SPH-CG computational modelling approach could potentially be applied in modelling the morphological changes of animal cells during dehydration processes.
Conflicts of interest
There are no conflicts of interest to declare.Acknowledgements
Firstly, the support from the ARC Discovery Project (DP150100828) should be acknowledged here. The authors of this study kindly acknowledge the support given by the High Performance Computing facilities (HPC) provided by Queensland University of Technology (QUT), Brisbane, Queensland, Australia and the financial support provided by the Chemistry, Physics and Mechanical Engineering (CPME) scholarship provided by the Science and Engineering Faculty (SEF), QUT. The first author specifically appreciates the support provided by University of Moratuwa, Sri Lanka.References
- S. V. Jangam, Drying Technol., 2011, 29, 1343–1357 CrossRef.
- G. Stefan, S. R. Hosahalli and M. Michele, Handbook of postharvest technology: cereals, fruits, vegetables, tea, and spices, CRC Press, 2003 Search PubMed.
- L. Mayor, M. Silva and A. Sereno, Drying Technol., 2005, 23, 2261–2276 CrossRef.
- J. E. Lozano, E. Rotstein and M. J. Urbicain, J. Food Sci., 1980, 45, 1403–1407 CrossRef.
- I. N. Ramos, C. L. M. Silva, A. M. Sereno and J. M. Aguilera, J. Food Eng., 2004, 62, 159–164 CrossRef.
- B. P. Hills and B. Remigereau, Int. J. Food Sci. Technol., 1997, 32, 51–61 CAS.
- C. Y. Lee, D. K. Salunkhe and F. S. Nury, J. Sci. Food Agric., 1967, 18, 89–93 CrossRef CAS.
- P. P. Lewicki and G. Pawlak, Drying Technol., 2003, 21, 657–683 CrossRef.
- C. Ratti, J. Food Eng., 2001, 49, 311–319 CrossRef.
- M. K. Bartlett, C. Scoffoni and L. Sack, Ecol. Lett., 2012, 15, 393–405 CrossRef PubMed.
- G. H. Crapiste, S. Whitaker and E. Rotstein, Chem. Eng. Sci., 1988, 43, 2919–2928 CrossRef CAS.
- N. Zogzas, Z. Maroulis and D. Marinos-Kouris, Drying Technol., 1994, 12, 1653–1666 CrossRef CAS.
- V. Karathanos, G. Villalobos and G. Saravacos, J. Food Sci., 1990, 55, 218–223 CrossRef.
- C. M. Rathnayaka Mudiyanselage, H. C. P. Karunasena, Y. T. Gu, L. Guan and W. Senadeera, J. Food Eng., 2017, 194, 24–39 CrossRef.
- H. C. P. Karunasena, PhD thesis, Queensland University of Technology, 2014.
- M. S. Rahman, Int. J. Food Prop., 2003, 6, 61–72 CrossRef.
- M. S. Rahman, J. Food Eng., 1994, 21, 127–136 CrossRef.
- B. Yesilata and M. A. Aktacir, Appl. Therm. Eng., 2009, 29, 748–752 CrossRef.
- G. H. Crapiste, S. Whitaker and E. Rotstein, Chem. Eng. Sci., 1988, 43, 2929–2936 CrossRef CAS.
- H. C. P. Karunasena, W. Senadeera, Y. T. Gu and R. J. Brown, Appl. Math. Model., 2014, 38, 3781–3801 CrossRef.
- H. C. P. Karunasena, Y. T. Gu, R. J. Brown and W. Senadeera, Biosyst. Eng., 2015, 132, 71–87 CrossRef.
- H. C. P. Karunasena, W. Senadeera, R. J. Brown and Y. T. Gu, Soft Matter, 2014, 10, 5249–5268 RSC.
- B. Li, Y.-P. Cao, X.-Q. Feng and H. Gao, Soft Matter, 2012, 8, 5728–5745 RSC.
- P. Van Liedekerke, P. Ghysels, E. Tijskens, G. Samaey, B. Smeedts, D. Roose and H. Ramon, Phys. Biol., 2010, 7, 026006 CrossRef CAS PubMed.
- H. C. P. Karunasena, W. Senadeera, R. J. Brown and Y. T. Gu, Eng. Anal. Bound Elem., 2014, 44, 1–18 CrossRef.
- H. C. P. Karunasena, P. Hesami, W. Senadeera, Y. T. Gu, R. J. Brown and A. Oloyede, Drying Technol., 2014, 32, 455–468 CrossRef CAS.
- V. Tozzini, Curr. Opin. Struct. Biol., 2005, 15, 144–150 CrossRef CAS PubMed.
- L. Petridis, H. M. O’Neill, M. Johnsen, B. Fan, R. Schulz, E. Mamontov, J. Maranas, P. Langan and J. C. Smith, Biomacromolecules, 2014, 15, 4152–4159 CrossRef CAS PubMed.
- B. Fan and J. K. Maranas, Cellulose, 2015, 22, 31–44 CrossRef CAS.
- K. Lu, J. K. Maranas and S. T. Milner, Soft Matter, 2016, 12, 3943–3954 RSC.
- L. Taiz and E. Zeiger, Plant Physiology, Sinauer Associates, New York, 2002 Search PubMed.
- M. L. Pruyn and R. Spicer, eLS, John Wiley & Sons, Ltd, 2001 DOI:10.1002/9780470015902.a0002083.pub2.
- P. Van Liedekerke, P. Ghysels, E. Tijskens, G. Samaey, D. Roose and H. Ramon, Soft Matter, 2011, 7, 3580–3591 RSC.
- P. Van Liedekerke, E. Tijskens, H. Ramon, P. Ghysels, G. Samaey and D. Roose, Phys. Rev. E: Stat., Nonlinear, Soft Matter Phys., 2010, 81, 061906 CrossRef CAS PubMed.
- H. C. P. Karunasena, R. J. Brown, Y. T. Gu and W. Senadeera, J. Food Eng., 2015, 146, 209–226 CrossRef CAS.
- H. C. P. Karunasena, Y. T. Gu, R. J. Brown and W. Senadeera, Drying Technol., 2015, 33, 713–734 CrossRef.
- H. C. P. Karunasena, W. Senadeera, R. J. Brown and Y. T. Gu, ANZIAM J., 2014, 55, C110–C137 Search PubMed.
- S. B. Nilsson, C. H. Hertz and S. Falk, Physiol. Plant., 1958, 11, 818–837 CrossRef.
- P. Lewicki and J. Drzewucka-Bujak, Proceedings of the 11th International Drying Symposium, 1998 Search PubMed.
- C. Wang, L. Wang and C. Thomas, Annals of Botany, 2004, 93, 443–453 CrossRef CAS PubMed.
- Q. Gao and R. Pitt, Trans. ASAE, 1991, 34, 0232–0238 CrossRef.
- R. Pitt, Trans. ASAE, 1982, 25, 1776–1784 CrossRef.
- A. E. Smith, K. E. Moxham and A. P. J. Middelberg, Chem. Eng. Sci., 1998, 53, 3913–3922 CrossRef CAS.
- H.-I. Wu, R. D. Spence, P. J. H. Sharpe and J. D. Goeschl, Plant, Cell Environ., 1985, 8, 563–570 CrossRef CAS.
- M. C. Jarvis, Plant, Cell Environ., 1998, 21, 1307–1310 CrossRef.
- P. W. Cleary and J. J. Monaghan, J. Comput. Phys., 1999, 148, 227–264 CrossRef.
- J. J. Monaghan, Rep. Prog. Phys., 1703, 2005, 68 Search PubMed.
- G. R. Liu and M. B. Liu, Smoothed Particle Hydrodynamics: A Meshfree Particle Method, World Scientific Publishing Co., Singapore, 2003 Search PubMed.
- C. M. R. Mudiyanselage, H. C. P. Karunasena, Y. Gu, L. Guan, J. Banks and W. Senadeera, Proceedings of the 7th International Conference on Computational Methods, 2016.
- J. P. Morris, P. J. Fox and Y. Zhu, J. Comput. Phys., 1997, 136, 214–226 CrossRef.
- B. A. Veytsman and D. J. Cosgrove, Biophys. J., 1998, 75, 2240–2250 CrossRef CAS PubMed.
- D. G. Hepworth and D. M. Bruce, Ann. Bot., 2000, 86, 287–292 CrossRef.
- H. N. Polwaththe-Gallage, S. C. Saha, E. Sauret, R. Flower and Y. T. Gu, Int. J. Mech. Mater. Des., 2015, 1–18 Search PubMed.
- S. M. Hosseini and J. J. Feng, Chem. Eng. Sci., 2009, 64, 4488–4497 CrossRef CAS.
- T.-W. Pan and T. Wang, Int. J. Numer. Anal. Model., 2009, 6, 455–473 Search PubMed.
- L. Shi, T.-W. Pan and R. Glowinski, Phys. Rev. E: Stat., Nonlinear, Soft Matter Phys., 2012, 85, 016307 CrossRef PubMed.
- J. Schlosser, N. Olsson, M. Weis, K. Reid, F. Peng, S. Lund and P. Bowen, Protoplasma, 2008, 232, 255 CrossRef CAS PubMed.
- A. McGarry, Ann. Bot., 1995, 75, 157–163 CrossRef.
- S. Sansiribhan, S. Devahastin and S. Soponronnarit, J. Food Sci., 2010, 75, E453–E461 CrossRef CAS PubMed.
- N. Wu and M. J. Pitts, Postharvest Biol. Technol., 1999, 16, 1–8 CrossRef.
- D. Georget, A. Smith and K. Waldron, J. Mater. Sci., 2003, 38, 1933–1938 CrossRef CAS.
- R. Campos-Mendiola, H. Hernandez-Sanchez, J. J. Chanona-Perez, L. Alamilla-Beltran, A. Jiménez-Aparicio, P. Fito and G. F. Gutierrez-Lopez, J. Food Eng., 2007, 83, 285–292 CrossRef CAS.
- I. N. Ramos, T. R. Brandão and C. L. Silva, J. Food Eng., 2005, 67, 195–203 CrossRef.
- A. Colagrossi, B. Bouscasse, M. Antuono and S. Marrone, Comput. Phys. Commun., 2012, 183, 1641–1653 CrossRef CAS.
- C. M. Rathnayaka, H. C. P. Karunasena, W. Senadeera and Y. T. Gu, Drying Technol., 2017, 1–14 Search PubMed.
- S. Alexander, Modell. Simul. Mater. Sci. Eng., 2010, 18, 015012 CrossRef.
- M. D. Abràmoff, P. J. Magalhães and S. J. Ram, Biophotonics International, 2004, 11, 36–42 Search PubMed.
- C. A. Schneider, W. S. Rasband and K. W. Eliceiri, Nat. Methods, 2012, 9, 671–675 CrossRef CAS PubMed.
- S. W. Fanta, M. K. Abera, W. A. Aregawi, Q. T. Ho, P. Verboven, J. Carmeliet and B. M. Nicolai, J. Food Eng., 2014, 124, 86–96 CrossRef CAS.
- P. P. Lewicki and G. Pawlak, Drying Technol., 2005, 23, 847–869 CrossRef CAS.
- K. G. P. Hansani, B. Sumith and H. C. P. Karunasena, Manufacturing & Industrial Engineering Symposium (MIES), 2016.
Footnotes |
†  . . |
| ‡ 4πA/P2. |
| § Theoretical hoop tensile force = PπR2. |
| ¶ % Model consistency error = (model predicted hoop force − theoretical hoop force)/theoretical hoop force. |
| This journal is © The Royal Society of Chemistry 2018 |

