Zirconia incorporated calcium looping absorbents with superior sintering resistance for carbon dioxide capture from in situ or ex situ processes†
Ming
Zhao
 ab,
Xu
He
ab,
Guozhao
Ji
ac,
Yinqiang
Song
ab and
Xiao
Zhao
ab,
Xu
He
ab,
Guozhao
Ji
ac,
Yinqiang
Song
ab and
Xiao
Zhao
 *ad
*ad
aSchool of Environment, Tsinghua University, Beijing 100084, China
bKey Laboratory for Solid Waste Management and Environmental Safety, Ministry of Education, Beijing 100084, China
cSchool of Environmental Science and Technology, Dalian University of Technology, Dalian 116024, China
dCollege of Water Resources & Civil Engineering, China Agricultural University, Beijing 10083, China. E-mail: xiaozhao88@cau.edu.cn
First published on 29th September 2018
Abstract
The sintering deactivation of Ca-based absorbents has greatly limited the application of calcium looping for either in situ or ex situ processes. In this work, a series of CaO sorbents stabilized with CaZrO3 were prepared by three different wet chemistry methods: freeze drying, spray drying and heating drying. Multi-cycle CO2 capture tests under relatively mild conditions demonstrated that the spray-dried sorbents performed best. Based on both total CO2 uptake and the deactivation rate, the optimum content of CaZrO3 was 20 wt%. Under severe conditions, the best sorbent could even retain a capacity of 0.47 g and 0.44 g CO2 per g sorbent at cycle 30 and cycle 100, respectively, which showed notable superiority over previously reported similar materials. The stabilization mechanism was explored by characterization. It was found that the introduction of CaZrO3 increased the specific surface area and the spray drying method generated a spherical structure, which could retain some pores after severe tests. Three semi-empirical equations were introduced to describe the evolution of the decay process.
1. Introduction
The application of CO2 capture and storage (CCS) is considered a promising strategy to decarbonize the global energy supply. Generally, CCS technologies can be separated into three groups: oxy-fuel, pre-combustion carbon capture (also known as in situ processes), and post-combustion carbon capture (ex situ processes). Post-combustion carbon capture has the greatest potential for short-term commercialization because it is easy to retrofit the existing infrastructure such as coal-fired power plants.1,2 So far, among different post-combustion carbon capture technologies, calcium looping is one of the most efficient options with relatively low energy penalty and cost,3 and recycling the sorbent waste for cement manufacture can further reduce the cost.4 On the other hand, calcium looping is also compatible to pre-combustion carbon capture processes. Typical steam gasification suffers from two unwanted products: CO2 from water–gas shift reactions and tar.5 CaO is a perfect fit to address these issues since it can in situ capture CO2 effectively and serve as an alkaline catalyst with high tar-cracking ability. A previous study on steam reforming of biomass demonstrated that CaO can serve as a multi-function material resulting in a great enhancement in H2 production.6Natural CaO-based sorbents made by calcination of limestone can capture CO2 effectively;7,8 however, the capacity of these sorbents decays rapidly over cycles due to sintering. The deactivation rates reach up to 15% per cycle, which greatly limits the development of the calcium looping process.9,10 It was reported that the CaO deactivation rate was the key factor affecting CO2 capture cost based on previously published economic modelling work.11
To mitigate the sintering deactivation of the sorbents, many methods have been developed, including but not limited to preparing porous sorbents by improved synthesis methods,12–14 additional treatments of the sintered sorbents (such as hydration treatment, thermal pretreatment and chemical pretreatment)15–17 and incorporation of refractory particles. In recent years, many researchers have focused on the development of incorporating refractory particles, including Al2O3,18–21 ZrO2,22–28 TiO2,29,30 SiO2,31,32 Y2O3![[thin space (1/6-em)]](https://www.rsc.org/images/entities/char_2009.gif) 33 and MgO.34,35 These refractory additives inhibit the sintering stress via the physical separation of the sorbent particles and the differential thermal expansion effects and sintering rates.26
33 and MgO.34,35 These refractory additives inhibit the sintering stress via the physical separation of the sorbent particles and the differential thermal expansion effects and sintering rates.26
Previous studies demonstrated that ZrO2 or Zr based materials can serve as effective spacers to enhance the CO2 capture performance of CaO sorbents.22,35–39 At elevated temperature ZrO2 can react with CaO to form CaZrO3, which shows weak affinity for CO2; in other words, the CO2 uptake depends exclusively on the CaO content.24,37,39 Lu et al.22 prepared sorbents by flame spray drying (FSP) and co-precipitation. It was reported that the sorbent synthesized by FSP (with 59 wt% CaO and 41 wt% CaZrO3) performed best after 23 cycles under mild conditions, but the net CO2 uptake decreased to only 0.23 g CO2 per g sorbent under more severe conditions (carbonation in pure CO2 at 850 °C for 10 min and calcination in 30 vol% CO2 at 950 °C with no dwell time). The stable performance was attributed to the refractory nature of CaZrO3. The same group later reported that the sorbent (with 44 wt% CaO and 56 wt% CaZrO3) gave optimum performance after 100 cycles.23 Next, some other advanced wet chemical methods were employed to synthesize Zr-doped sorbents, such as template-based methods24,27,28 and sol–gel methods.25,39 These methods for precursor solution preparation were complicated to some extent and the mild conditions (calcination in N2 or He at 700–850 °C) used for CO2 capture tests24,27,28 cannot simulate real post-combustion carbon capture scenarios. Meanwhile, some tests under severe conditions were conducted. Broda and Müller25 produced sorbents by a sol–gel method and the sorbent (with 85 wt% CaO and 15 wt% ZrO2) retained a 0.36 g CO2 per g sorbent CO2 uptake after 10 cycles (carbonation in 20 vol% CO2 at 650 °C for 20 min and calcination in pure CO2 at 900 °C for 10 min). Zhao et al.26 reported that the sorbent synthesized by a wet chemical route retained a 0.31 g CO2 per g sorbent CO2 uptake after 30 cycles (carbonation in pure CO2 at 650 °C for 15 min and calcination in pure CO2 at 950 °C with no dwell time). Despite various reported CaZrO3-stabilized sorbents, very few studies have compared their durability resulting from different synthesis methods, especially when severe regeneration conditions (i.e. calcination of CaCO3 in the presence of high fractions of CO2 at high temperatures) were applied. Also, the optimal mass ratio of inert spacers, i.e. CaZrO3, is yet to be determined since the conditions were not identical in the published literature.
In this study, we synthesized a series of CaO-based sorbents with different weight fractions of CaZrO3 spacers. We prepared precursor solutions and then dried them through freeze drying, spray drying and heating drying, respectively. Their multi-cycle CO2 capture performance was examined under both mild and severe conditions with the carbonation time shortened to 10 min. Eventually, the CO2 capture capacity was described by three semi-empirical equations. The specific objectives of this work include: (1) investigating the effects of synthesis methods on the CO2 capture performance of the sorbents; (2) determining the optimal weight fraction of the spacer; (3) comparing the results with other similar CaO sorbents based on the open literature; (4) analyzing the stabilization mechanisms of CaZrO3; (5) describing the decay process with equations.
2. Experimental and methodology
2.1 Sorbent synthesis
The sorbents were synthesized from precursor solutions that consisted of Ca(CH3COO)2·xH2O (MW = 175.79) and Zr(NO3)4·xH2O (MW = 342.67) obtained from Xilong Co. (Guangdong, China) by freeze drying, spray drying and heating drying. Designed amount of Ca(CH3COO)2·xH2O and Zr(NO3)4·xH2O were dissolved in 100 ml and 50 ml of deionized water, respectively. Then the Zr solution was added dropwise into the Ca solution under vigorous stirring, and the mixed solution became a little cloudy because of the formation of the Zr complex. Then, 5 ml of acetic acid (99.5%) was added into the mixed solution dropwise. The solution was stirred for 5 min (400 rpm), and then became clear again in excess of the organic acid.40 The amount of Ca(CH3COO)2·xH2O was 14.5967 g, 13.5195 g and 12.4423 g with the corresponding amount of Zr(NO3)4·xH2O being 0.9556 g, 1.9112 g and 2.8667 g; therefore the theoretical weight fractions of CaZrO3 in the resultant sorbents are 10%, 20% and 30%, respectively.In the freeze drying process, the aqueous precursor was frozen at −80 °C for 4 h in a refrigerator and then dried in a vacuum freeze dryer (FD-1-50, Beijing Boyikang Laboratory Instruments Co., Ltd.) operating at approximately −50 °C and 0.15 mbar for 24 h. In the spray drying process, the solution was dried by using a spray drier (BILON-6000Y, Shanghai Bilon Instrument Co., Ltd.). The air inlet temperature was set at 300 °C and the other parameters were chosen as follows: the frequency of the fan was 35 Hz, the rotation speed of the peristaltic pump was 26 rpm and the spray interval time was 6 s. As for the heating drying, the solution was dried in an oven operating at 60 °C for about 24 h.
The obtained powder samples were pulverized, and then heated at 10 °C min−1 to 850 °C and maintained for 1 h in a maffle furnace to get the sorbents. The sorbents synthesized by the three methods are denoted as ‘FD-Zr’, ‘SD-Zr’ and ‘HD-Zr’. For example, SD-Zr30 refers to the sorbent synthesized by spray drying with 30 wt% CaZrO3.
Meanwhile, 15 g of Ca(CH3COO)2·xH2O was dissolved in 150 ml deionized water and the same synthesis process was employed to prepare the sorbents free of spacers, which are denoted as ‘FD-CaO’, ‘SD-CaO’ and ‘HD-CaO’.
2.2 Multi-cycle CO2 capture tests
The CO2 capture performances of the obtained sorbents from the three methods were tested by using a TA50 Thermogravimetric Analyzer (TGA). The mass of the sorbent loaded into the TGA was maintained at 4 ± 1 mg to eliminate the mass transfer effects.32 The multi-cycle CO2 capture tests were carried out under mild and severe conditions respectively. For mild tests, the cycling conditions were set as follows: carbonation in 15 vol% CO2 at 650 °C for 10 min and calcination in pure N2 at 850 °C with no dwell time. When the temperature reached 850 °C, the CaCO3 was decomposed completely, and then a new cycle started immediately. For the severe tests, the samples were carbonated in 90 vol% CO2 at 650 °C for 10 min and calcined in 90 vol% CO2 at 950 °C with no dwell time. For instrumental reasons, the TGA was not available to provide a pure CO2 flow. For both mild and severe tests, the heating and cooling rates were 20 °C min−1 and the total gas flow rates were 100 ml min−1. The cycle number was 30.Four parameters were calculated to evaluate the CO2 capture performance of the sorbents, i.e., CO2 uptake (Ci, g CO2 per g sorbent), CaO conversion (Xi, %), total CO2 uptake over 30 cycles (CT, g CO2 per g sorbent) and average deactivation rate of each cycle (DR, g CO2 per g sorbent, cycle). They were calculated according to the following formulae:
 | (1) |
 | (2) |
 | (3) |
 | (4) |
2.3 Sorbent characterization
N2 physisorption was conducted using a Quantachrome Autosorb iQ-C to measure the surface area, pore volume and pore size distribution of the sorbents. Prior to the N2 adsorption, the samples were heated to 300 °C for outgassing. Powder X-ray diffraction (XRD) was carried out with a D/Max 2500 V+/PC. XRD patterns were compared with the standard patterns in the International Centre for Diffraction Data (ICDD). The PDF2 database was used to analyse the phase composition of the samples. The Scanning Electron Microscopy (SEM) images were taken by using a Zeiss MERLIN VP Compact to examine the surface morphology of the sorbents before and after the multi-cycle tests.2.4 Semi-empirical equation description
Three semi-empirical equations were introduced to simulate the CaO conversion decay with the number of cycles as follows:| Xi = f1i × (1 − f2) + f2 | (5) |
 | (6) |
 | (7) |
Eqn (5) was proposed by Abanades and Alvarez42 based on the grain sintering mechanism. Eqn (6) was simpler and used for catalyst deactivation.9Eqn (7) fitted well with the experimental results of natural limestone in long-term CO2 sorption–desorption cycles.8,43
3. Results and discussion
3.1 Characterization of the sorbents
The XRD patterns of some calcined sorbents synthesized are shown in Fig. 1. Compared with the standard database, the diffraction peaks indicated that the stabilized sorbents contained only CaO (no. 78-0649, cubic, 2θ = 32.2°, 37.4°, 53.9°, 64.2°, 67.5° and 79.8°)44–47 and CaZrO3 (no. 76-2401, orthorhombic, 2θ = 22.1°, 31.5°, 45.2°, 50.9°, 55.5°, 56.7°, 65.8° and 74.8°).37,39 Normally, the intensity of the CaZrO3 peaks increased along with the increase of the CaZrO3 content. The crystallite sizes (calculated based on the Scherrer equation) of CaO at phases (200) and (220) and CaZrO3 at phase (202) are shown in Table S1 in the ESI.† For samples synthesized by spray drying, the crystallite sizes of SD-CaO were larger than 100 nm. With the incorporation of CaZrO3, the crystallite sizes of CaO decreased significantly. The sizes of CaO decreased with the increased amount of the spacer while the sizes of CaZrO3 increased. Comparing the CaO–Zr20 samples synthesized by different methods, it was found that the CaZrO3 sizes of FD-Zr20 were the smallest and the sizes of SD-Zr20 were the largest. Specifically, the CaZrO3 crystallite sizes of FD-Zr20, SD-Zr20 and HD-Zr20 at phase (202) were 22.0 nm, 26.1 nm, and 24.7 nm, respectively. The CaO crystallite sizes of SD-Zr20 were also the largest and the CaO crystallite sizes of FD-Zr20, SD-Zr20 and HD-Zr20 at phase (200) were 53.6 nm, 54.6 nm and 51.5 nm, respectively.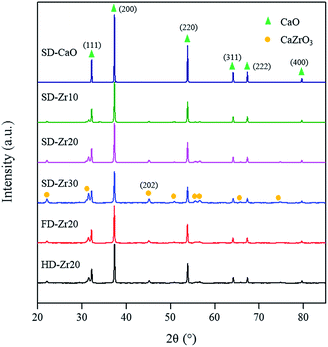 | ||
| Fig. 1 Powder XRD patterns of the samples synthesized by spray drying (SD), freeze drying (FD) and heating dry (HD) with the CaZrO3 weight fraction varied from 0% to 30 wt%. | ||
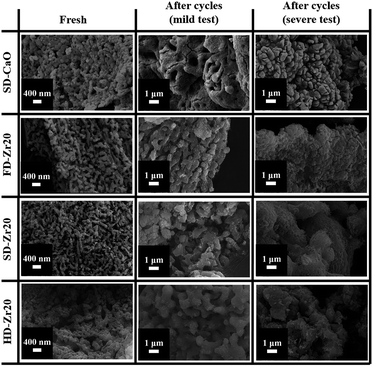
The microstructure of the sorbents was observed via SEM, and representative results are shown in Fig. 2. The synthesis method shows great effects on the sorbent morphology. Comparing the fresh CaO–Zr20 samples synthesized by different methods, the particles of HD-Zr20 seemed the smallest but much more densified, which was caused by the liquid surface tension during the evaporation process. As for spray drying, the droplets were sprayed and dried in a limited time, and the surface tension effect was weakened. Furthermore, freeze drying eliminated the effect when the method skipped the liquid phase and ice was sublimated directly under vacuum conditions. As a result, freeze drying and spray drying enhanced the dispersion of the particles. FD-Zr20 had a dendritic structure with small particles on the branches, while the particles of SD-Zr20 exhibited a spherical structure (Fig. S1 in the ESI†). Comparing SD-Zr20 with SD-CaO, it seemed that the incorporation of CaZrO3 made the particles get slender and better dispersed. After the mild test, the small particles of all the sorbents agglomerated into bigger ones due to the sintering effect. The incorporation of CaZrO3 mitigated the effect when many pores could still be found. The particles of HD-Zr20 seemed bigger than the particles of FD-Zr20 and SD-Zr20. After the severe tests, all the sorbents sintered greatly with most of the pores closed. The stabilized sorbents reserved some small particles after cycles. Meanwhile, some small pores could be found on the surface of the agglomerated particles of SD-Zr20. It seemed that the spherical structure generated from spray drying gave the best performance in offsetting the sintering effect.
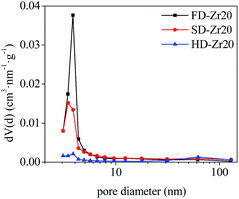
Some sorbents were selected to test the textural properties and the results of the specific surface area and pore volume are shown in Table 1. For pure CaO, the specific surface area of FD-CaO and SD-CaO was much higher than that of HD-CaO. The incorporation of CaZrO3 could increase the specific surface area but decrease the pore volume for all the three synthesis methods. Comparing the CaO–Zr20 samples synthesized by the three methods, the specific surface area of FD-Zr20 was the highest but its pore volume was the lowest. The specific surface area of SD-Zr20 was slightly lower and the pore volume was the largest. Detailed N2 physical adsorption isotherms are shown in Fig. S2 in the ESI† and the pore size distribution results calculated by the BJH method are shown in Fig. 3. All the three samples presented typical irreversible IVa isotherms according to the 2015 IUPAC classification, which are presented in mesoporous adsorbents.48 Also, the hysteresis loops were of Type H3, which are usually given by non-rigid aggregates of particles.48 As shown in Fig. S2c,† HD-Zr20 did not present an evident hysteresis, suggesting the insufficiency of mesopores of the sample. The results of pore size distribution in Fig. 3 also demonstrated that there were fewer mesopores with diameters narrower than 5 nm for HD-Zr20. The hysteresis was quite significant for FD-Zr20 between P/P0 = 0.4 and P/P0 = 0.9. A sharp peak at d = 3.8 nm was observed in the pore size distribution and FD-Zr20 was especially rich in mesopores with diameters smaller than 5 nm. SD-Zr20 has fewer pores than FD-Zr20 in the 3–5 nm range but comparable numbers of pores in the 5–30 nm range as FD-Zr20.
| Sorbent | BET surface area (m2 g−1) | Pore volume (cm3 g−1) |
|---|---|---|
| FD-CaO | 32.366 | 0.213 |
| FD-Zr20 | 38.960 | 0.111 |
| SD-CaO | 34.660 | 0.176 |
| SD-Zr20 | 37.436 | 0.153 |
| HD-CaO | 11.590 | 0.184 |
| HD-Zr20 | 13.243 | 0.127 |
3.2 Tests of the cyclic CO2 capture performance
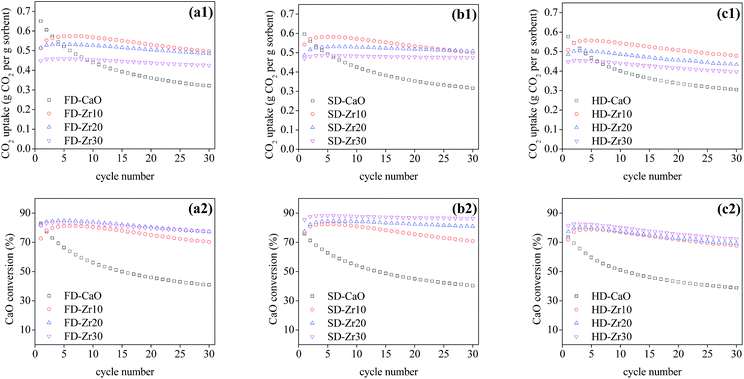
The effect of the synthesis method and weight fractions of the spacer on the cyclic CO2 capacity under mild conditions was examined and the results are presented in Fig. 4. The capacity of all pure CaO sorbents synthesized through the three methods decayed very quickly. The CO2 uptake of FD-CaO, SD-CaO and HD-CaO decreased to 0.32, 0.32 and 0.31 g CO2 per g sorbent, respectively, at cycle 30 with a CaO conversion ratio of 40.9%, 40.3% and 38.8%, respectively. Once the CaO sorbents were incorporated with CaZrO3, the stability of the sorbents enhanced obviously. The CO2 uptake of FD-Zr10, SD-Zr10 and HD-Zr10 at cycle 30 was increased to 0.50, 0.50 and 0.48 g CO2 per g sorbent, respectively, and the CaO conversion was 70.3%, 70.9% and 67.7%, respectively. The CO2 uptake of the sorbents stabilized by CaZrO3 increased in the first few cycles and then decreased gradually. The self-activating effect in the first few cycles might be ascribed to the improvement of the pore structure, which was also reported by many other research studies.49–52 Meanwhile, the deactivation rate slowed down along with the increase of the CaZrO3 weight fraction (Fig. 5b) owing to the strengthened effect of physical separation.31 For the sorbents synthesized by freeze drying (Fig. 4a) and heating drying (Fig. 4c), CaO–Zr10 still gave the best performance at cycle 30, which was due to the highest absolute uptake of CaO–Zr10. For the spray dried samples (Fig. 4b), the CO2 uptake of SD-Zr20 began to exceed that of SD-Zr10 at cycle 27.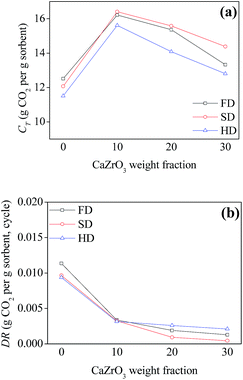 | ||
| Fig. 5 Comparison of CT (total CO2 uptake in 30 cycles) and DR (average deactivation rate) for the sorbents under mild conditions. | ||
Pure CaO sorbents made by three drying methods exhibited comparable decay curves over cycles despite their relatively different initial CaO conversion ratios at cycle 1. For the other sorbents with the same spacer loadings, the best performance was found for the sorbents synthesized by spray drying, which had the highest CT and lowest DR values (Fig. 5). SD-Zr20 captured the most CO2 at cycle 30 with a CO2 uptake of 0.51 g CO2 per g sorbent. The DR value of SD-Zr20 was 0.0009 while that of FD-Zr20 and HD-Zr20 was 0.0019 and 0.0026. SD-Zr30 maintained a quite stable uptake over the cycles after the initial increase and its DR value was 0.0004, which could be ignored.
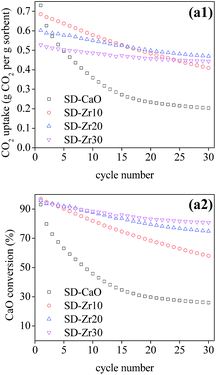
Since the spray-dried sorbents gave the best performance, the multi-cycle CO2 capture test under severe conditions was conducted using SD series sorbents and the results are shown in Fig. 6. Although the CO2 concentration (90 vol%) in the carbonation process was much higher than that under mild conditions, the deactivation rate became much higher (Fig. 7b). The CO2 uptake of pure CaO decreased severely from 0.73 to only 0.20 g CO2 per g sorbent over 30 cycles. The deactivation rate was mitigated after incorporation with CaZrO3. In the cyclic test, the CO2 uptake of SD-Zr20 and SD-Zr30 both began to exceed that of SD-Zr10. The CO2 uptake of SD-Zr10, SD-Zr20 and SD-Zr30 at cycle 30 was 0.41, 0.47 and 0.44 g CO2 per g sorbent, respectively. The total CO2 uptake in 30 cycles (CT value) of SD-Zr10 was the highest (15.96 g CO2 per g sorbent), but that of SD-Zr20 was very close (15.77 g CO2 per g sorbent). The DR value of SD-Zr10, SD-Zr20 and SD-Zr30 was 0.0095, 0.0046 and 0.0029. The difference of the deactivation rate between SD-Zr20 and SD-Zr30 was negligible. Therefore, taking both total CO2 capacity and the deactivation rate into consideration, the optimum weight fraction of the spacer CaZrO3 was 20%. The cyclic CO2 uptake of SD-Zr20 was further tested by increasing the cycle number to 100 and the results are presented in Fig. S3 in the ESI.† After 30 cycles, the CO2 capacity remained quite stable over the cycles. The CO2 uptake decayed very slowly from 0.47 g CO2 per g sorbent at cycle 30 to 0.44 g CO2 per g sorbent at cycle 100, which showed the superior sintering-resistant ability of the sorbent.
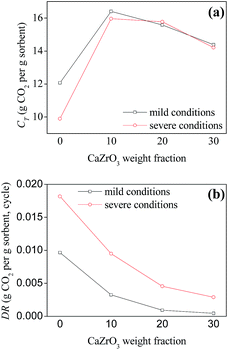 | ||
| Fig. 7 Comparison of CT (total CO2 uptake) and DR (average deactivation rate) for the sorbents synthesized by spray drying under mild and severe conditions. | ||
The multi-cycle CO2 capture test of FD-Zr20 and HD-Zr20 under severe conditions was also conducted to compare with SD-Zr20 and the results are shown in Fig. 8. It was found that SD-Zr20 captured the most CO2 over the cycles, which is the same as results under mild conditions. The CT value of FD-Zr20, SD-Zr20 and HD-Zr20 was 15.32, 15.77 and 13.96 g CO2 per g sorbent, which indicated that freeze drying and spray drying could generate much more stable sorbents.
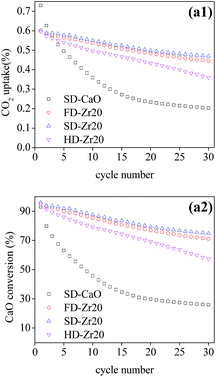 | ||
| Fig. 8 The cyclic CO2 uptake and CaO conversion of CaO–Zr20 samples synthesized by the three methods under severe conditions. | ||
Manovic and Anthony49 proposed a model with the assumption that the sorbents consist of two parts, a hard skeleton and soft skeleton. The former maintains the morphology and stays stable while the latter easily agglomerates at high temperature. Song et al.53 used this model to explain the durability of Al-stabilized CaO sorbents synthesized by different wet chemistry synthesis methods. The model could explain the results in this work likewise. The particles of the sorbents synthesized by heating drying were the smallest, as the SEM images showed, so it seemed that the hard skeleton was hard to form, so the samples were the least resistant to sintering. In contrast, the sorbents synthesized by freeze drying and spray drying consisted of larger particles and consequently more hard skeleton parts, and as a result, these sorbents showed much better stability over cycles. On the other hand, the spherical structure was reported to be more resistant to sintering compared with other porous structures.27,28 In this work, the spherical structure of SD-Zr20 also performed better than the branched structure of FD-Zr20.
3.3 Semi-empirical equation description of the decay process
To describe the decay process over cycles under severe conditions, three semi-empirical equations were proposed. The fitting results are shown in Table 2.| SD-CaO | SD-Zr10 | SD-Zr20 | SD-Zr30 | FD-Zr20 | HD-Zr20 | ||
|---|---|---|---|---|---|---|---|
| Eqn (5) | f 1 | 0.8766 | 0.9713 | 0.95 | 0.9087 | 0.9443 | 0.9502 |
| f 2 | 0.2457 | 0.2819 | 0.6807 | 0.802 | 0.6568 | 0.4922 | |
| R 2 | 0.9969 | 0.9994 | 0.9816 | 0.9572 | 0.9803 | 0.9676 | |
| Eqn (6) | k 1 | 0.1 | 0.024 | 0.0105 | 0.0065 | 0.0124 | 0.0217 |
| b 1 | 1.1828 | 0.9869 | 1.0377 | 1.0614 | 1.0468 | 1.038 | |
| R 2 | 0.9686 | 0.9983 | 0.9935 | 0.9724 | 0.9981 | 0.9882 | |
| Eqn (7) | k 2 | 0.1372 | 0.01459 | 0.07558 | 0.3432 | 0.08518 | 0.05084 |
| b 2 | 0.04375 | −0.2107 | 0.5172 | 0.7399 | 0.4964 | 0.2517 | |
| R 2 | 0.9934 | 0.9995 | 0.9835 | 0.9725 | 0.9844 | 0.9737 | |
The coefficient of determination, R2, is an indicator to measure the goodness of fitting. As can be seen, all the R2 values were higher than 0.95, which showed good agreement between the equations and the experimental data. It seemed that eqn (7) was the best one with the overall highest R2 values, followed by eqn (6).
In eqn (5), the parameter f2 expressed the stable carbonation conversion, which was independent of the number of cycles. It was demonstrated that the incorporation of CaZrO3 could enhance the f2 value significantly, i.e. more active CaO remained after cycles. The parameter f1 indicated the deactivation rate of the instable CaO. This equation could be understood linked with the hard and soft skeleton model mentioned above.
In eqn (6) and (7), k1 and k2 were the deactivation constants and apparently, the sorbent with a lower deactivation constant could give better sintering-resistant performance. The k1 value of SD-CaO was 0.1, but when incorporated with CaZrO3, the k1 value decreased significantly and it decreased with the increase of the CaZrO3 content. Meanwhile, the k1 value of SD-Zr20 was lower than that of FD-Zr20 and HD-Zr20, as the experimental data showed. However, the k2 value increased with the increase of the spacer content, which failed to live up to the meanings of the parameters. Meanwhile, b2 was the residue conversion like f2 but the b2 value of SD-Zr10 was negative. Since the values of the parameters were unexplainable, it indicated that although eqn (7) fitted with the experimental data best, it could not explain the results of the synthesized CaO-based sorbents as well as natural limestone.
3.4 Comparison with other Ca-based sorbents stabilized with CaZrO3
Based on the cyclic CO2 capture performance, the best-performed sorbent SD-Zr20 in this work was compared with other reported Ca-based sorbents stabilized by CaZrO3 under similar lab-scale test conditions, as tabulated in Table 3. Ping and Wu28 prepared sorbents with a cage-like hollow spherical structure and tested them under similar mild conditions. Zhao et al.26 reported that sorbents synthesized by a wet chemical route were tested under similar severe conditions and the best sorbent retained a 0.31 g-CO2 per g-sorbent CO2 uptake after 30 cycles. The size of the spherical structure generated by the spray drying in this work was much bigger than that of the cage-like hollow spherical structure (∼10 μm vs. ∼500 nm), but it remained stable likewise over the cycles under mild conditions. Under severe conditions, it was reported that phase separation of cuboid CaZrO3 particles appeared, which did harm to the durability of the sorbent.26 In this work, the sorbents were prepared from clear precursor solution instead of suspension, so the homogeneity was enhanced. Furthermore, the energy dispersive spectrometry (EDS) figures (Fig. S4 in the ESI†) demonstrated that the elements in the sorbents remained homogeneous over the cycles under severe conditions.| Authors (reference) | Synthesis method | CaZrO3 content (wt%) | Carbonation | Calcination | Number of cycles | Net CO2 uptake (g CO2 per g sorbent) | |||||
|---|---|---|---|---|---|---|---|---|---|---|---|
| T (°C) | t (min) | CO2 (%) | T (°C) | t (min) | CO2 (%) | Initial | Final | ||||
| Lu et al.22 | Flame spray pyrolysis | 41 | 850 | 10 | 100 | 950 | 0 | 30 | 23 | 0.25 | 0.23 |
| 41 | 750 | 10 | 30 | 750 | 10 | 0 | 50 | 0.31 | 0.32 | ||
| Wet impregnation | 41 | 750 | 10 | 30 | 750 | 10 | 0 | 50 | 0.31 | 0.15 | |
| Koirala et al.23 | Flame spray pyrolysis | 41 | 700 | 30 | 100 | 700 | 30 | 0 | 100 | 0.34 | 0.33 |
| 56 | 700 | 30 | 100 | 700 | 30 | 0 | 100 | 0.23 | 0.23 | ||
| 56 | 850 | 10 | 100 | 950 | 10 | 30 | 100 | 0.21 | 0.21 | ||
| Radfarnia et al.24 | Template method | 41 | 600 | 30 | 100 | 750 | 30 | 0 | 15 | 0.19 | 0.14 |
| Broda et al.25 | Sol–gel method | 52 | 650 | 20 | 20 | 900 | 10 | 100 | 10 | 0.33 | 0.21 |
| 29 | 650 | 20 | 20 | 900 | 10 | 100 | 10 | 0.49 | 0.31 | ||
| 15 | 650 | 20 | 20 | 900 | 10 | 100 | 19 | 0.57 | 0.36 | ||
| Zhao et al.26 | Wet mixing | 30 | 650 | 15 | 15 | 800 | 0 | 0 | 30 | 0.18 | 0.27 |
| 30 | 650 | 15 | 100 | 950 | 0 | 100 | 30 | 0.36 | 0.31 | ||
| Wang et al.27 | Template method | 0.8 | 650 | 30 | 50 | 850 | 0 | 0 | 30 | 0.37 | 0.27 |
| Ping et al.28 | Template method | 15 | 600 | 10 | 20 | 800 | 10 | 0 | 30 | 0.31 | 0.24 |
| SD-Zr20 in this work | Spray drying | 20 | 650 | 10 | 15 | 850 | 0 | 0 | 30 | 0.49 | 0.51 |
| 20 | 650 | 10 | 90 | 950 | 0 | 90 | 30 | 0.60 | 0.47 | ||
| 20 | 650 | 10 | 90 | 950 | 0 | 90 | 100 | 0.60 | 0.44 | ||
4. Conclusions
CaZrO3 was introduced as a spacer to enhance the stability of Ca-based sorbents for the multi-cycle CO2 capture process and the stabilization effect was significant. The sorbents were synthesized by freeze drying, spray drying and heating drying to compare the effect of different synthesis methods on the performance of the sorbents. Multi-cycle CO2 tests under mild conditions demonstrated that the sorbents synthesized by spray drying performed best and then the sorbents were tested under severe conditions. Considering both total CO2 uptake over 30 cycles and the deactivation rate, the optimum content of CaZrO3 was determined to be 20 wt%. The best sorbent retained a capacity of 0.47 g CO2 per g sorbent at cycle 30 which then dropped to 0.44 g CO2 per g sorbent at cycle 100 under severe conditions, which was much higher than the capacity reported in the open literature under similar conditions. The stabilization mechanism was analyzed via characterization. The CaO sorbents synthesized by freeze drying and spray drying had a high specific surface area and the introduction of CaZrO3 could make it even higher. The spray drying method could generate a spherical structure, which could remain very stable over the cycles under mild conditions and retain some pores after the test even under severe conditions. Three semi-empirical equations were introduced to describe the decay of CaO conversion over the cycles under severe conditions and two of them could interpret the results adequately.Conflicts of interest
There are no conflicts to declare.Nomenclature
| C i | CO2 uptake at cycle i, g CO2 per g sorbent |
| X i | CaO conversion at cycle i, % |
| i | Cycle number |
| C T | Total CO2 uptake over 30 cycles, g CO2 per g sorbent |
| DR | Average deactivation rate of each cycle, g CO2 per g sorbent, cycle |
| m max,i | Weight at the end of carbonation at cycle i, mg |
| m min,i | Initial weight at cycle i, mg |
| M CaO | Molecular weight of CaO, g mol−1 |
| M CO2 | Molecular weight of CO2, g mol−1 |
| η | CaO weight fraction, % |
| C max,n′ | Maximum CO2 uptake over 30 cycles, g CO2 per g sorbent |
| n′ | Corresponding cycle number |
| f 1 | Fitting parameter in eqn (5) |
| f 2 | Fitting parameter in eqn (5) |
| k 1 | Fitting parameter in eqn (6) |
| b 1 | Fitting parameter in eqn (6) |
| k 2 | Fitting parameter in eqn (7) |
| b 2 | Fitting parameter in eqn (7) |
Acknowledgements
The authors thank the National Natural Science Foundation of China for the support (Grant No. 51506112).References
- J. D. Figueroa, T. Fout, S. Plasynski, H. McIlvried and R. D. Srivastava, Int. J. Greenhouse Gas Control, 2008, 2, 9 CrossRef CAS.
- M. E. Boothandford, J. C. Abanades, E. J. Anthony, M. J. Blunt, S. Brandani, N. M. Dowell, J. R. Fernández, M. C. Ferrari, R. Gross and J. P. Hallett, Energy Environ. Sci., 2013, 7, 130 RSC.
- M. Zhao, A. I. Minett and A. T. Harris, Energy Environ. Sci., 2013, 6, 25 RSC.
- C. C. Dean, D. Dugwell and P. S. Fennell, Energy Environ. Sci., 2011, 4, 2050 RSC.
- X. Zhao, H. Zhou, V. S. Sikarwar, M. Zhao, A.-H. A. Park, P. S. Fennell, L. Shen and L.-S. Fan, Energy Environ. Sci., 2017, 10, 1885 RSC.
- G. Ji, X. Xu, H. Yang, X. Zhao, X. He and M. Zhao, Environ. Sci. Technol., 2017, 51, 11484 CrossRef CAS PubMed.
- H. Gupta and L.-S. Fan, Ind. Eng. Chem. Res., 2002, 41, 4035 CrossRef CAS.
- G. S. Grasa and J. C. Abanades, Ind. Eng. Chem. Res., 2006, 45, 8846 CrossRef CAS.
- J. Wang and E. J. Anthony, Ind. Eng. Chem. Res., 2005, 44, 627 CrossRef CAS.
- N. Macdowell, N. Florin, A. Buchard, J. Hallett, A. Galindo, G. Jackson, C. S. Adjiman, C. K. Williams, N. Shah and P. Fennell, Energy Environ. Sci., 2010, 3, 1645 RSC.
- A. MacKenzie, D. L. Granatstein, E. J. Anthony and J. C. Abanades, Energy Fuels, 2007, 21, 920 CrossRef CAS.
- W. Liu, N. W. L. Low, B. Feng, G. Wang and J. C. Diniz da Costa, Environ. Sci. Technol., 2010, 44, 841 CrossRef CAS PubMed.
- A. Coenen, T. L. Church and A. T. Harris, Energy Fuels, 2011, 26, 162 CrossRef.
- W. Liu, J. Yin, C. Qin, B. Feng and M. Xu, Environ. Sci. Technol., 2012, 46, 11267 CrossRef CAS PubMed.
- J. Yin, C. Qin, H. An, A. Veeraragavan and B. Feng, Ind. Eng. Chem. Res., 2013, 52, 18215 CrossRef CAS.
- M. Shokrollahi Yancheshmeh, H. R. Radfarnia and M. C. Iliuta, Chem. Eng. J., 2016, 283, 420 CrossRef CAS.
- D. C. Ozcan, B. H. Shanks and T. D. Wheelock, Ind. Eng. Chem. Res., 2011, 50, 6933 CrossRef CAS.
- Z.-s. Li, N.-s. Cai, Y.-y. Huang and H.-j. Han, Energy Fuels, 2005, 19, 1447 CrossRef CAS.
- S. F. Wu, Q. H. Li, J. N. Kim and K. B. Yi, Ind. Eng. Chem. Res., 2008, 47, 180 CrossRef CAS.
- C. S. Martavaltzi and A. A. Lemonidou, Ind. Eng. Chem. Res., 2008, 47, 9537 CrossRef CAS.
- M. Broda and C. R. Müller, Adv. Mater., 2012, 24, 3059 CrossRef CAS PubMed.
- H. Lu, A. Khan, S. E. Pratsinis and P. G. Smirniotis, Energy Fuels, 2008, 23, 1093 CrossRef.
- R. Koirala, K. R. Gunugunuri, S. E. Pratsinis and P. G. Smirniotis, J. Phys. Chem. C, 2011, 115, 24804 CrossRef CAS.
- H. R. Radfarnia and M. C. Iliuta, Ind. Eng. Chem. Res., 2012, 51, 10390 CrossRef CAS.
- M. Broda and C. R. Müller, Fuel, 2014, 127, 94 CrossRef CAS.
- M. Zhao, M. Bilton, A. P. Brown, A. M. Cunliffe, E. Dvininov, V. Dupont, T. P. Comyn and S. J. Milne, Energy Fuels, 2014, 28, 1275 CrossRef CAS.
- Y. Wang, W. Zhang, R. Li, W. Duan and B. Liu, Energy Fuels, 2016, 30, 1248 CAS.
- H. Ping and S. Wu, ACS Sustainable Chem. Eng., 2016, 4, 2047 CrossRef CAS.
- S. F. Wu and Y. Q. Zhu, Ind. Eng. Chem. Res., 2010, 49, 2701 CrossRef CAS.
- C.-T. Yu and W.-C. Chen, Powder Technol., 2013, 239, 492 CrossRef CAS.
- M. Zhao, J. Shi, X. Zhong, S. Tian, J. Blamey, J. Jiang and P. S. Fennell, Energy Environ. Sci., 2014, 7, 3291 RSC.
- P. T. Clough, M. E. Boot-Handford, M. Zhao and P. S. Fennell, Fuel, 2016, 186, 708 CrossRef CAS.
- V. S. Derevschikov, A. I. Lysikov and A. G. Okunev, Ind. Eng. Chem. Res., 2011, 50, 12741 CrossRef CAS.
- L. Li, D. L. King, Z. Nie and C. Howard, Ind. Eng. Chem. Res., 2009, 48, 10604 CrossRef CAS.
- H. R. Radfarnia and M. C. Iliuta, Chem. Eng. J., 2013, 232, 280 CrossRef CAS.
- Y. Xu, C. Luo, Y. Zheng, H. Ding, Q. Wang, Q. Shen, X. Li and L. Zhang, RSC Adv., 2016, 6, 79285 RSC.
- R. Koirala, G. K. Reddy and P. G. Smirniotis, Energy Fuels, 2012, 26, 3103 CrossRef CAS.
- R. Koirala, G. K. Reddy, J.-Y. Lee and P. G. Smirniotis, Sep. Sci. Technol., 2014, 49, 47 CrossRef CAS.
- G. K. Reddy, S. Quillin and P. Smirniotis, Energy Fuels, 2014, 28, 3292 CrossRef CAS.
- G. Ji, M. Z. Memon, H. Zhuo and M. Zhao, Chem. Eng. J., 2017, 313, 646 CrossRef CAS.
- Y. Hu, W. Liu, H. Chen, Z. Zhou, W. Wang, J. Sun, X. Yang, X. Li and M. Xu, Fuel, 2016, 181, 199 CrossRef CAS.
- J. C. Abanades and D. Alvarez, Energy Fuels, 2003, 17, 308 CrossRef CAS.
- J. M. Valverde, Chem. Eng. J., 2013, 228, 1195 CrossRef CAS.
- A. Roesch, E. P. Reddy and P. G. Smirniotis, Ind. Eng. Chem. Res., 2005, 44, 6485 CrossRef CAS.
- H. Lu, A. Khan and P. G. Smirniotis, Ind. Eng. Chem. Res., 2008, 47, 6216 CrossRef CAS.
- H. Lu and P. G. Smirniotis, Ind. Eng. Chem. Res., 2009, 48, 5454 CrossRef CAS.
- H. Lu, P. G. Smirniotis, F. O. Ernst and S. E. Pratsinis, Chem. Eng. Sci., 2009, 64, 1936 CrossRef CAS.
- M. Thommes, K. Kaneko, A. V. Neimark, J. P. Olivier, F. Rodriguez-Reinoso, J. Rouquerol and K. S. Sing, Pure Appl. Chem., 2015, 87, 1051 CAS.
- V. Manovic and E. J. Anthony, Environ. Sci. Technol., 2008, 42, 4170 CrossRef CAS PubMed.
- J. S. Dennis and R. Pacciani, Chem. Eng. Sci., 2009, 64, 2147 CrossRef CAS.
- S. Stendardo, L. K. Andersen and C. Herce, Chem. Eng. J., 2013, 220, 383 CrossRef CAS.
- J. Valverde, P. Sanchez-Jimenez and L. Perez-Maqueda, Fuel, 2014, 123, 79 CrossRef CAS.
- Y. Song, G. Ji, X. Zhao, X. He, X. Cui and M. Zhao, Energy Fuels, 2017, 31, 12521 CrossRef CAS.
Footnote |
| † Electronic supplementary information (ESI) available. See DOI: 10.1039/c8se00413g |
| This journal is © The Royal Society of Chemistry 2018 |

