Catalytic decarbonylation of stearic acid to hydrocarbons over activated carbon-supported nickel†
Zihao
Zhang
 a,
Zhe
Chen
a,
Hao
Chen
a,
Xin
Gou
a,
Kequan
Chen
a,
Zhe
Chen
a,
Hao
Chen
a,
Xin
Gou
a,
Kequan
Chen
 b,
Xiuyang
Lu
a,
Pingkai
Ouyang
ab and
Jie
Fu
 *a
*a
aKey Laboratory of Biomass Chemical Engineering of Ministry of Education, College of Chemical and Biological Engineering, Zhejiang University, Hangzhou 310027, China. E-mail: jiefu@zju.edu.cn; Tel: +86 571 87951065
bState Key Laboratory of Materials-Oriented Chemical Engineering, College of Biotechnology and Pharmaceutical Engineering, Nanjing Tech University, Nanjing 211816, China
First published on 3rd July 2018
Abstract
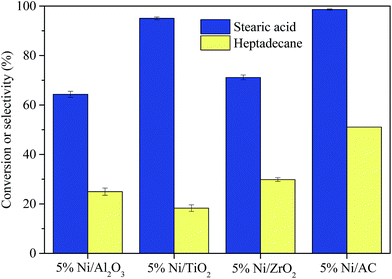
In this study, the deoxygenation of stearic acid over a series of Ni-based catalysts in the absence of hydrogen and solvents was investigated. Ni/Al2O3, Ni/TiO2, Ni/ZrO2, and Ni/AC (activated carbon) were synthesized using the wetness impregnation method, and Ni/AC showed the best activity for deoxygenation. X-ray diffraction, transmission electron microscopy, H2 temperature-programmed reduction, and N2 adsorption–desorption analyses revealed that Ni had an average particle size of about 9.6 nm with good crystallinity, the largest surface area and strong Ni–carrier interactions in Ni/AC. These properties of Ni/AC contributed to its good deoxygenation activity. Ni/AC produced hydrocarbons (71.4% yield) such as heptadecane, heptadecene, aromatics, and cracking paraffins under optimized reaction conditions. Furthermore, it was found that the deoxygenation of stearic acid over Ni/AC in the absence of hydrogen and solvent proceeds mainly via decarbonylation.
1. Introduction
The depletion of fossil resources and the increasing environmental concerns have spurred the need to develop renewable and clean energy resources.1–3 Biomass, which is abundantly available, has gained significant attention as a renewable resource as it can be used to produce fuels and high value added chemicals.4–6 A typical example is the deoxygenation of fatty acids derived from triglyceride into biofuel hydrocarbons.7–10 Hydrodeoxygenation via hydrotreating has been extensively studied for the production of hydrocarbons over the past thirty years.11–14 However, this approach requires high H2 pressures and sulfided catalysts, which seriously limit its use for industrial applications.15–17 Therefore, fuel-range hydrocarbons obtained from the decarboxylation or decarbonylation of fatty acids in the absence of hydrogen are considered as the most promising alternatives.11,18Generally, precious metals such as Pd and Pt are used for the production of fuel-like hydrocarbons from the deoxygenation of fatty acids in the absence of hydrogen.19,20 The deoxygenation of fatty acids has been studied in organic solvent, water, and non-solvent systems. Murzin et al. investigated the effect of Pd dispersion on the deoxygenation of stearic and palmitic acids in dodecane.21 Savage et al. studied the decarboxylation of saturated and unsaturated fatty acids using commercial Pt/C, Pt3Sn/C, PtSn/C, and PtSn3/C catalysts in hydrothermal systems and found that these catalysts showed excellent catalytic activity.20,22–24 In addition, they also reported that water molecules act as a source of hydrogen for the saturation of fatty acids.22 Crocker et al. compared the catalytic performance of 1% Pt/C and 5% Pd/C in non-solvent reaction systems. They found that 1% Pt/C showed a higher conversion (42%) and a selectivity of 45% to C8–17.25
Considering the high cost of Pt- and Pd-based catalysts, efforts have been made to use Ni-, Cu-, and Co-based catalysts for the decarboxylation of saturated oils and fats without added hydrogen donors.15,26,27 Among these catalysts, Ni-based catalysts have been reported to show the best catalytic activity towards the deoxygenation of fatty acids. Ni/Al2O3 has been reported to selectively catalyze the decarboxylation of fatty acids.28 In addition, Savage et al. reported that the deoxygenation of fatty acids over activated carbon is consistent with decarboxylation (removal of O from fatty acids by removing CO2 from the molecule).29 Chen et al. studied the conversion of fatty acid methyl esters over Ni/HZSM-5 and obtained both CO and CO2.30 Crocker et al. reported a series of Ni-based catalysts including Ni/AC and Ni/Al2O3, which exhibited different catalytic activities for the deoxygenation of stearic acid with or without H2 in dodecane, and a higher selectivity to heptadecane was achieved in a H2 atmosphere.15,27 For example, 26% and 81% selectivity to heptadecane from the conversion of stearic acid was obtained respectively under N2 and H2 atmospheres.27 Wu et al. reported the decarboxylation behavior of fatty acids over Ni-based catalysts in the absence of hydrogen and solvents.26 They found that decarboxylation is an indispensable part of the deoxygenation reaction of stearic acid.
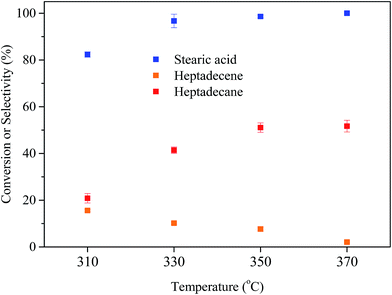
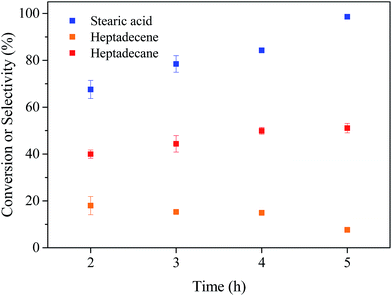
In this study, we developed a novel method to produce hydrocarbons via the decarbonylation of stearic acid in the absence of H2 and solvents. We synthesized four Ni-based catalysts with different supports using the wetness impregnation method. These catalysts were used for the decarboxylation of fatty acids in the absence of H2 and solvents. X-ray diffraction (XRD), transmission electron microscopy (TEM), H2 temperature-programmed reduction (H2-TPR), and N2 adsorption–desorption analyses were carried out to examine the structure of the catalysts. The effects of the reaction time and temperature on the decarbonylation of stearic acid were also studied. The reaction route of the conversion of stearic acid over Ni/AC was examined.
2. Materials and methods
2.1 Materials
Ni(NO3)2·6H2O (98.0%) and Al2O3 (200–300 mesh) were obtained from Sinopharm Chemical Reagent Co., Ltd. Activated carbon (AC) and stearic acid (99%) were obtained from Sigma-Aldrich, USA. ZrO2, TiO2, SiO2, and heptadecane were obtained from Aladdin Industrial Corporation, Shanghai, China. 1-Heptadecene (99.5%) was purchased from Tokyo Chemical Industry Co., Ltd. Deionized water was prepared in our laboratory. Acetone (analytic reagent grade) was purchased from Hangzhou Chemical Reagent Co., Ltd, China. All the chemicals were used without further purification.2.2 Catalyst preparation
All the samples were synthesized using the incipient wetness impregnation method. First, a calculated amount of Ni(NO3)2·6H2O was dissolved in deionized water. Desired supports were then added to this mixture. After impregnation, these samples were treated ultrasonically for 0.5 h and were then aged overnight at room temperature. The resulting samples were then dried at 110 °C for 12 h. Finally, the samples were calcined at 500 °C for 2 h in a N2 atmosphere. The resulting catalysts were activated (according to their TPR profiles) with H2 at 400 °C for 2 h before the reaction. The controlled Ni loading was 5% for all the catalysts. The actual Ni loading of Ni/AC, Ni/Al2O3, Ni/ZrO2 and Ni/TiO2 was 5.3%, 4.8%, 5.1% and 6.8% respectively.2.3 Catalyst characterization
The XRD patterns of the samples were recorded on a Bruker D8 Advance X-ray diffractometer using a Cu Kα source. The TEM images of the samples were achieved using a JEOLJEM-2100 instrument.The TPR of the catalysts was carried out using a FineSorb-3010 system connected with a thermal conductivity detector (TCD) (Zhejiang Finetec Instruments Co., Ltd.). Typically, 50 mg catalysts were pretreated at 120 °C for 2 h in the presence of He and then cooled to 40 °C. The reactor was heated to 700 °C at a heating rate of 10 °C min−1 with a hydrogen flow of 30 mL min−1, and the profiles were then recorded.
N2 adsorption–desorption measurements were carried out using nitrogen at 77 K using a static volumetric apparatus (Micromeritics ASAP2020). Prior to the measurements, each catalyst was degassed at 300 °C for 16 h. The surface area of the catalysts was calculated by using the Brunauer–Emmett–Teller (BET) equation.
The Ni actual loading of the different catalysts was measured by inductively coupled plasma-optical emission spectroscopy (ICP-OES) on an Agilent 730 device. Prior to the analysis, the catalysts were dissolved in a mixture of HCl and HNO3. The Fourier transform infrared spectra of Ni/AC were collected on a Nicolet-iS50 FT-IR. As shown in Fig. S1,† the main surface functional groups associated with Ni/AC were hydroxyl, ester, and aromatic groups.
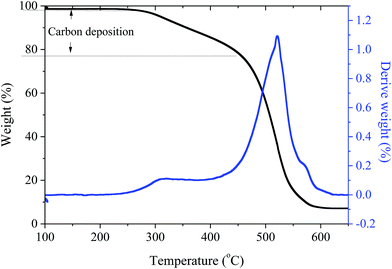
The thermogravimetric characteristics of the catalysts were evaluated by carrying out their thermogravimetric analysis (TGA) using a TA-Q500. The samples were heated to 600 °C at 10 °C min−1 under a flow of air (50 cm3 min−1).
2.4 Experimental procedure and analysis
The catalytic conversion of stearic acid was carried out in a 1.67 mL micro batch reactor (Swagelok, USA). In a typical experiment, 50 mg stearic acid and 30 mg catalyst (without hydrogen and any solvents) were added into the reactor. And then, the sealed reactor was placed in a fluidized sand bath (Techne SBL-2) that was already heated to the desired temperature. After the reaction, the reactor was put into water to quench the reaction. For the analysis of gaseous products, the experiments were performed in an 8 mL stainless steel autoclave, which can be connected with a pressure gauge. After the reaction, the number on the pressure gauge is recorded and gaseous products were collected using a gas bag for GC analysis.The quantification and identification of the liquid products were carried out with an Agilent 7890B gas chromatograph/5977A mass spectrometer (GC/MS) equipped with a flame ionization detector (FID) and a HP-5 capillary column. The quantitative analysis of the samples was carried out using the calibration curves of every compound. The identification analysis was performed by matching the gas chromatograph retention times with the known standards. The quantitative analysis of gaseous products was performed with a gas chromatograph (SHIMADZU GC-2018) equipped with an Agilent PLOT 5A molecular sieve filled column and a TCD detector. The oven temperature was 60 °C, the liquid volume was 1 mL with a split ratio of 1, and the temperatures of the TCD and FID detectors were 100 and 180 °C, respectively. The data were obtained by calculating the average of the values obtained from three independent measurements. The mole conversion was calculated by dividing the moles of stearic acid consumed by the moles of stearic acid added into the reactor. Selectivity was calculated by dividing the moles of the product obtained by the moles of stearic acid consumed. The product yield was calculated by multiplying its conversion efficiency and selectivity.
3. Results and discussion
3.1 Characterization of the catalysts
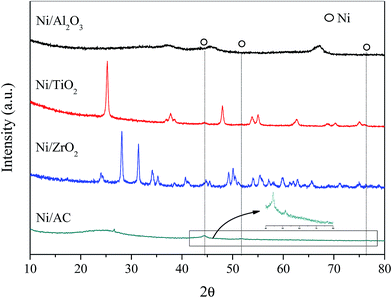
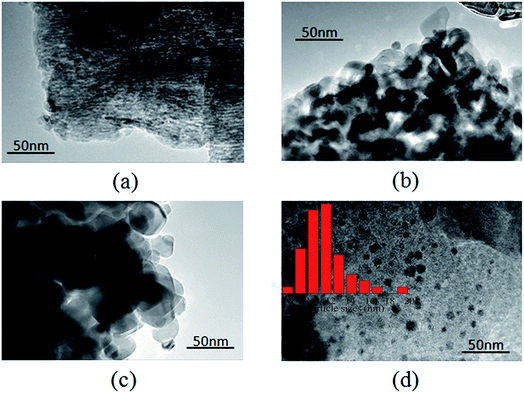
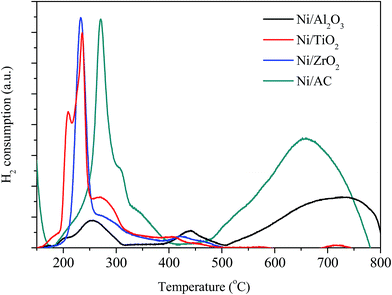
XRD patterns of the different Ni-based catalysts are shown in Fig. 1. Ni/AC, Ni/TiO2, Ni/Al2O3, and Ni/ZrO2 catalysts showed the characteristic diffraction peaks of graphitic carbon, TiO2, Al2O3, and ZrO2, respectively.31–33 The (111), (200), and (220) diffraction peaks of Ni at 2θ = 44.5°, 51.8°, and 76.4°, respectively, were observed in Ni/AC, Ni/TiO2 and Ni/ZrO2 catalysts, indicating the presence of Ni0 with a face centered cubic lattice in these catalysts.34 No such peaks were observed in Ni/Al2O3, which should be ascribed to the formation of nickel aluminum spinels confirmed by H2-TPR results in Fig. 3. That was because Ni–Al spinel cannot be reduced at the designed reduced temperature (400 °C). The diffraction peaks of ZrO2 and Ni overlapped, and as a result, it was difficult to calculate the average crystallite size of Ni in Ni/ZrO2. The average crystallite size of Ni in Ni/TiO2 and Ni/AC was 12.6 and 9.8 nm respectively, calculated by using the Scherrer equation from the peaks around 44.5°. The TEM images of Ni/Al2O3, Ni/TiO2, Ni/ZrO2, and Ni/AC (Fig. 2) also revealed that only Ni/AC consisted of highly dispersed crystalline Ni particles. Therefore, it can be stated that AC was the best carrier for the high dispersion of Ni particles. The average particle size of Ni/AC was found to be about 9.6 nm according to the TEM results in Fig. 2d, which was in good agreement with the crystallite size obtained from XRD.The H2-TPR analysis of the Ni/AC, Ni/Al2O3, Ni/ZrO2, and Ni/TiO2 catalysts was carried out prior to their reduction. As shown in Fig. 3, the catalysts consumed H2 because of the reduction of nickel oxide in the presence of hydrogen. The H2 consumption profile of the Ni/Al2O3 catalyst exhibited two peaks at around 260 and 440 °C, indicating different redox behaviors. The peak at 260 °C can be attributed to the reduction of the NiO phase. Additionally, the reduction peak at 440 °C can be ascribed to the strong interaction between NiO and the Al2O3 carrier.35 The higher reduction temperature at around 700 °C was ascribed to the formation of Ni–Al spinels, since a strong interaction between Ni and aluminum matrices should lead to a higher reduction temperature.24,36 An obvious peak at high temperature (>500 °C) was also observed in Ni/AC, which was due to the reduction of carrier AC (Fig. S2†). The reduction temperatures of Ni/AC, Ni/TiO2, and Ni/ZrO2 were found to be within the temperature range of 200–400 °C. Ni/AC showed a higher reduction temperature, be attributed to the strong interaction between Ni and the surface functional groups in this catalyst. According to the H2-TPR result of commercial CuO, the reduction of NiO in Ni/AC, Ni/ZrO2, Ni/TiO2 and Ni/Al2O3 per gram consumed about 0.56, 0.49, 0.60 and 0.46 mmol H2 respectively. Ni/AC, Ni/TiO2, and Ni/ZrO2 showed broad H2 consumption bands within the temperature range of 200–400 °C. The H2 consumption peaks showed a complex overlapping of several elemental reduction processes such as the sequential reduction of Ni2+ to Ni0via Ni+.37,38
The N2 adsorption–desorption isotherms of Ni/AC, Ni/Al2O3, Ni/TiO2, and Ni/ZrO2 are shown in Fig. S3.† The Ni/AC catalyst exhibited a type I isotherm with a plateau starting at a very low relative pressure, indicating the existence of a microporous structure in Ni/AC. Additionally, a type IV isotherm with a remarkable hysteresis loop known as a hierarchical porous structure was discovered in Ni/AC, which indicates the presence of a mesoporous structure. The textural properties of the samples were examined to determine their total surface areas and pore volumes, as shown in Table 1. These results showed that the total surface area of the catalysts went down in the order of Ni/AC > Ni/Al2O3 > Ni/TiO2 > Ni/ZrO2, and the total pore volume of Ni/AC was much higher than that of the other three catalysts. Since both Ni/AC and Ni/Al2O3 showed similar mesoporous surface areas, the highest surface area of Ni/AC can be attributed mainly to the structure of its micropores. Moreover, Table 1 reveals that the mesoporous surface area of Ni/AC, Ni/Al2O3, Ni/TiO2 and Ni/ZrO2 was 147.1, 159.7, 58.4 and 17.0 m2 g−1 respectively.
| S BET (m2 g−1) | V total (cm3 g−1) | S meso (m2 g−1) | V meso (cm3 g−1) | |
|---|---|---|---|---|
| Ni/AC | 688.3 | 0.39 | 147.1 | 0.14 |
| Ni/Al2O3 | 159.7 | 0.24 | 159.7 | 0.24 |
| Ni/TiO2 | 58.4 | 0.27 | 58.5 | 0.27 |
| Ni/ZrO2 | 17.0 | 0.14 | 15.0 | 0.14 |
3.2 Deoxygenation of stearic acid
| Compound | Yield (%) |
|---|---|
| Gas | 7.18 |
| Heptane | 0.08 |
| Octane | 0.16 |
| Nonane | 0.14 |
| Decane | 0.16 |
| Hendecane | 0.24 |
| Dodecane | 0.29 |
| Tridecane | 0.53 |
| Tetradecane | 0.84 |
| Pentadecane | 1.16 |
| Hexadecane | 1.29 |
| Heptadecene | 7.13 |
| Heptadecane | 47.61 |
| Aromatic | 6.82 |
| Coking | 24.92 |
| Total | 98.55 |
| Compound | Yield (%) |
|---|---|
| Heptane | 0.17 |
| Octane | 0.35 |
| Nonane | 0.19 |
| Decane | 0.25 |
| Hendecane | 0.34 |
| Dodecane | 0.40 |
| Tridecane | 0.68 |
| Tetradecane | 1.09 |
| Pentadecane | 1.39 |
| Hexadecane | 1.44 |
| Heptadecene | 7.53 |
| Heptadecane | 50.37 |
| Aromatic | 7.21 |
| Total | 71.41 |
4. Conclusion
The deoxygenation of stearic acid in the absence of H2 and any solvent over Ni/AC, Ni/TiO2, Ni/Al2O3, and Ni/ZrO2 was studied. Ni/AC exhibited the best catalytic activity for heptadecane and heptadecene. The XRD, TEM, H2-TPR, and BET results showed that Ni had an average particle size of about 9.6 nm with high crystallinity, the highest surface area and strong Ni–carrier interactions in Ni/AC, which contributed to its superior deoxygenation activity. About a 71.4% yield of hydrocarbons including heptadecane, heptadecene, aromatics, and cracking paraffins was achieved using Ni/AC under optimized reaction conditions. It was found that decarbonylation is the main reaction route for the deoxygenation of stearic acid over Ni/AC.Conflicts of interest
There are no conflicts to declare.Acknowledgements
This work was supported by the Zhejiang Provincial Natural Science Foundation of China (No. LR17B060002), the National Natural Science Foundation of China (No. 21436007, 21676243, and 21706228), and the Fundamental Research Funds for the Central Universities (No. 2018QNA4038).References
- K. Kandel, J. W. Anderegg, N. C. Nelson, U. Chaudhary and I. I. Slowing, J. Catal., 2014, 314, 142–148 CrossRef.
- Z. Zhang, Z. Pei, H. Chen, K. Chen, Z. Hou, X. Lu, P. Ouyang and J. Fu, Ind. Eng. Chem. Res., 2018, 57, 4225–4230 CrossRef.
- B. Peng, X. Yuan, C. Zhao and J. A. Lercher, J. Am. Chem. Soc., 2012, 134, 9400–9405 CrossRef PubMed.
- H. Chen, X. Zhang, J. Zhang and Q. Wang, Catal. Sci. Technol., 2018, 8, 1126–1133 RSC.
- Z. Zhang, H. Cheng, H. Chen, K. Chen, X. Lu, P. Ouyang and J. Fu, Bioresour. Technol., 2018, 256, 241–246 CrossRef PubMed.
- Z. Al-Hamamre, M. Saidan, M. Hararah, K. Rawajfeh, H. E. Alkhasawneh and M. Al-Shannag, Renewable Sustainable Energy Rev., 2017, 67, 295–314 CrossRef.
- Q. Tian, Z. Zhang, F. Zhou, K. Chen, J. Fu, X. Lu and P. Ouyang, Energy Fuels, 2017, 31, 6163–6172 CrossRef.
- H. Chen, Q. Wang, X. Zhang and L. Wang, Appl. Catal., B, 2015, 166, 327–334 CrossRef.
- K. Jeništová, I. Hachemi, P. Mäki-Arvela, N. Kumar, M. Peurla, L. Čapek, J. Wärnå and D. Y. Murzin, Chem. Eng. J., 2017, 316, 401–409 CrossRef.
- M. Ahmadi, E. E. Macias, J. B. Jasinski, P. Ratnasamy and M. A. Carreon, J. Mol. Catal. A: Chem., 2014, 386, 14–19 CrossRef.
- Y. Liu, X. Yang, H. Liu, Y. Ye and Z. Wei, Appl. Catal., B, 2017, 218, 679–689 CrossRef.
- B. Smith, H. C. Greenwell and A. Whiting, Energy Environ. Sci., 2009, 2, 262–271 RSC.
- L. Hermida, A. Z. Abdullah and A. R. Mohamed, Renewable Sustainable Energy Rev., 2015, 42, 1223–1233 CrossRef.
- D. Kubička, J. Horáček, M. Setnička, R. Bulánek, A. Zukal and I. Kubičková, Appl. Catal., B, 2014, 145, 101–107 CrossRef.
- E. Santillan-Jimenez, T. Morgan, J. Shoup, A. E. Harman-Ware and M. Crocker, Catal. Today, 2014, 237, 136–144 CrossRef.
- D. Scholz, C. Aellig and I. Hermans, ChemSusChem, 2014, 7, 268–275 CrossRef PubMed.
- F. Wang and Z. Zhang, ACS Sustainable Chem. Eng., 2017, 5, 942–947 CrossRef.
- J. Liu, C. Liu, G. Zhou, S. Shen and L. Rong, Green Chem., 2012, 14, 2499–2505 RSC.
- M. Snåre, I. Kubičková, P. Mäki-Arvela, K. Eränen and D. Y. Murzin, Ind. Eng. Chem. Res., 2006, 45, 5708–5715 CrossRef.
- J. Fu, X. Lu and P. E. Savage, Energy Environ. Sci., 2010, 3, 311–317 RSC.
- I. Simakova, O. Simakova, P. Mäki-Arvela, A. Simakov, M. Estrada and D. Y. Murzin, Appl. Catal., A, 2009, 355, 100–108 CrossRef.
- T. M. Yeh, R. L. Hockstad, S. Linic and P. E. Savage, Fuel, 2015, 156, 219–224 CrossRef.
- T. Yeh, S. Linic and P. E. Savage, ACS Sustainable Chem. Eng., 2014, 2, 2399–2406 CrossRef.
- Z. Zhang, Q. Yang, H. Chen, K. Chen, X. Lu, P. Ouyang, J. Fu and J. G. Chen, Green Chem., 2018, 20, 197–205 RSC.
- T. Morgan, D. Grubb, E. Santillan-Jimenez and M. Crocker, Top. Catal., 2010, 53, 820–829 CrossRef.
- J. Wu, J. Shi, J. Fu, J. A. Leidl, Z. Hou and X. Lu, Sci. Rep., 2016, 6, 27820 CrossRef PubMed.
- E. Santillan-Jimenez, T. Morgan, J. Lacny, S. Mohapatra and M. Crocker, Fuel, 2013, 103, 1010–1017 CrossRef.
- D. Kubička and L. Kaluža, Appl. Catal., A, 2010, 372, 199–208 CrossRef.
- J. Fu, F. Shi, L. T. Thompson, X. Lu and P. E. Savage, ACS Catal., 2011, 1, 227–231 CrossRef.
- L. Chen, H. Li, J. Fu, C. Miao, P. Lv and Z. Yuan, Catal. Today, 2016, 259, 266–276 CrossRef.
- W. Yu, J. Xu, H. Ma, C. Chen, J. Zhao, H. Miao and Q. Song, Catal. Commun., 2010, 11, 493–497 CrossRef.
- Y. Wang, Y. Ju, R. Shakoor, R. Kahraman and W. Gao, Mater. Res. Innovations, 2014, 18, S4-1102 CrossRef.
- R. Kaewmeesri, A. Srifa, V. Itthibenchapong and K. Faungnawakij, Energy Fuels, 2015, 29, 833–840 CrossRef.
- B. Hu, X. Qin, A. M. Asiri, K. A. Alamry, A. O. Al-Youbi and X. Sun, Electrochim. Acta, 2013, 107, 339–342 CrossRef.
- V. Venkateshwarlu, V. Mohan, M. V. Rao, P. Nagaiah, B. D. Raju and K. R. Rao, Catal. Commun., 2016, 86, 1–4 CrossRef.
- I. Obregon, I. Gandaris, N. Miletic, A. Ocio and P. L. Arias, Chemsuschem, 2015, 8, 3483–3488 CrossRef PubMed.
- Z. Zhang, F. Zhou, K. Chen, J. Fu, X. Lu and P. Ouyang, Energy Fuels, 2017, 31, 12624–12632 CrossRef.
- K. Y. Koo, H.-S. Roh, Y. T. Seo, D. J. Seo, W. L. Yoon and S. B. Park, Appl. Catal., A, 2008, 340, 183–190 CrossRef.
- Z. Zhang, H. Chen, C. Wang, K. Chen, X. Lu, P. Ouyang and J. Fu, Fuel, 2018, 230, 211–217 CrossRef.
- K. M. Hardiman, C. G. Cooper, A. A. Adesina and R. Lange, Chem. Eng. Sci., 2006, 61, 2565–2573 CrossRef.
Footnote |
| † Electronic supplementary information (ESI) available. See DOI: 10.1039/c8se00189h |
| This journal is © The Royal Society of Chemistry 2018 |

