
Porous aluminophosphates as adsorbents for the separation of CO2/CH4 and CH4/N2 mixtures – a Monte Carlo simulation study†
Michael
Fischer
 ab
ab
aUniversity of Bremen, Crystallography Group, Department of Geosciences, Klagenfurter Straße 2-4, 28359 Bremen, Germany. E-mail: michael.fischer@uni-bremen.de
bUniversity of Bremen, MAPEX Center for Materials and Processes, 28359 Bremen, Germany
First published on 30th May 2018
Abstract
Aluminophosphates with zeolite-like topologies (AlPOs) have received considerable attention as potential adsorbents for use in the separation of methane-containing gas mixtures. Such separations, especially the removal of carbon dioxide and nitrogen from methane, are of great technological relevance in the context of the “upgrade” of natural gas, landfill gas, and biogas. While more than 50 zeolite frameworks have been synthesised in aluminophosphate composition or as heteroatom-substituted AlPO derivatives, only a few of them have been characterised experimentally with regard to their adsorption and separation behaviour. In order to predict the potential of a variety of AlPO frameworks for applications in CO2/CH4 and CH4/N2 separations, atomistic grand-canonical Monte Carlo (GCMC) simulations were performed for 53 different structures. Building on previous work, which studied CO2/N2 mixture adsorption in AlPOs (M. Fischer, Phys. Chem. Chem. Phys., 2017, 19, 22801–22812), force field parameters for methane adsorption in AlPOs were validated through a comparison to available experimental adsorption data. Afterwards, CO2/CH4 and CH4/N2 mixture isotherms were computed for all 53 frameworks for room temperature and total pressures up to 1000 kPa (10 bar), allowing the prediction of selectivities and working capacities for conditions that are relevant for pressure swing adsorption (PSA) and vacuum swing adsorption (VSA). For CO2/CH4 mixtures, the GIS, SIV, and ATT frameworks were found to have the highest selectivities and CO2 working capacities under VSA conditions, whereas several frameworks, among them AFY, KFI, AEI, and LTA, show higher working capacities under PSA conditions. For CH4/N2 mixtures, all frameworks are moderately selective for methane over nitrogen, with ATV exhibiting a significantly higher selectivity than all other frameworks. While some of the most promising topologies are either not available in pure-AlPO4 composition or collapse upon calcination, others can be synthesised and activated, rendering them interesting candidates for future experimental studies. In addition to predictions of mixture adsorption isotherms, further simulations were performed for four selected systems in order to investigate the microscopic origins of the macroscopic adsorption behaviour, e.g. with regard to the very high CH4/N2 selectivity of ATV and the loading-dependent evolution of the heat of CO2 adsorption and CO2/CH4 selectivity of AEI and GME.
1. Introduction
Carbon dioxide and nitrogen are two of the most important impurities in natural gas, landfill gas, and biogas. Biogas and landfill gas may contain up to ∼40 vol% CO2 and up to ∼15 vol% N2.1 While the impurity levels in natural gas are normally (but not always) lower, it has been estimated that more than 50% of known natural gas resources contain more than 2 vol% CO2, thus being above the typical limits for pipeline transport.2 The cryogenic production of liquefied natural gas requires even higher purities (less than 500 ppmV of CO2, 1 vol% N2).3 As such, the removal of CO2 and N2 from methane constitutes an important technological challenge. For CO2 removal, processes using chemical absorption in amine solutions are the most widely used technology, whereas cryogenic distillation dominates the industrially used N2 rejection processes.4 However, several other technological solutions have been proposed for the “upgrade” of natural gas or biogas, such as adsorption- and membrane-based separation processes. These technologies could be particularly attractive for smaller-scale methane production units, since they are relatively cost- and energy-efficient.2,3In adsorption-based gas separation techniques, one component of a mixture is selectively adsorbed during the adsorption stage at given pressure and temperature. The adsorbent is then regenerated by either decreasing the pressure or by increasing the temperature (desorption stage). The whole procedure is run in a cyclic fashion, and the corresponding techniques are referred to as pressure swing adsorption (PSA) and temperature swing adsorption (TSA), respectively. Vacuum swing adsorption (VSA) corresponds to a PSA process using a sub-atmospheric desorption pressure.5 While being widely used for gas dehydration, TSA-based processes are less attractive for the upgrade of natural gas or biogas due to the relatively long regeneration times (in comparison to PSA). On the other hand, several PSA-based processes have been developed on a commercial scale for both CO2/CH4 separation, where CO2 is the more strongly adsorbed component, and CH4/N2 separation, where either CH4 or N2 may be more strongly adsorbed, depending on the adsorbent. Commercially used adsorbents include activated carbons, synthetic aluminosilicate zeolites (especially zeolites 13X and 5A), and titanosilicates.2 Besides efforts to improve the process configuration (refinement of the adsorption cycle), the development and testing of new adsorbents, which may have better properties than established materials, constitutes a very active field of research. While metal–organic frameworks (MOFs), being a relatively new group of highly porous adsorbents with tunable properties, have received particular attention,3,6,7 zeolites and zeolite-like materials have also been widely studied, among them natural zeolites,8,9 all-silica and high-silica zeolites,10–14 aluminophosphate zeotypes (AlPOs),15–18 and silicoaluminophosphate zeotypes (SAPOs).14,18–22
Focussing on AlPOs and SAPOs, the adsorption properties of a couple of frameworks have been characterised experimentally in order to evaluate their potential for use as adsorbents in CO2/CH4 or CH4/N2 separations. A relatively early (1997) study by Predescu et al. investigated the adsorption of CH4, N2, and CO in AlPO-11 (AEL framework type23), AlPO-17 (ERI), and AlPO-18 (AEI).15 Binary adsorption isotherms were predicted on the basis of empirical models, pointing to a potential ability of all three AlPOs to separate CH4/N2 mixtures. AlPO-11 was also studied more recently by Delgado et al., who obtained Henry's law selectivities of 6.6 for CO2/CH4 mixtures and 3.9 for CH4/N2 mixtures (at 298 K).16 Moreover, they modelled a VSA CO2/CH4 separation process, concluding that AlPO-11 could be a viable option for this application. Zhao et al. investigated the CO2 and CH4 adsorption properties of AlPO-14 (AFN), observing a high Henry's law selectivity of ∼22 at 273 K.17 A recent study of CO2 and CH4 adsorption in several adsorbents by Bacsik et al. included AlPO-17, SAPO-56 (AFX), and a CHA-type SAPO.18 For a VSA-type separation of an equimolar CO2/CH4 mixture, they obtained CO2 working capacities of 2.07/0.87/0.79 mmol g−1 for SAPO-56/SAPO-CHA/AlPO-17 (at 293 K). The working capacity of SAPO-56 exceeded those of cation-exchanged LTA-type zeolites and of the MOF Cu3(btc)2 (HKUST-1). The CO2/CH4 selectivities of the two SAPOs were in the range of 20–30, whereas that of AlPO-17 was close to 4, a difference that can be explained with the stronger interaction of CO2 with the charged-framework SAPOs. Other SAPOs that have been investigated as potential adsorbents for the adsorption-based separation of CO2/CH4 mixtures include SAPO-34 (CHA)19,20 and DNL-6 (RHO).21 SAPO-34 has also been studied for CH4/N2 mixture separation.22
In addition to studies aiming at the use of AlPOs/SAPOs in adsorption-based separations, some groups have also prepared AlPO or SAPO membranes for potential applications in separations of methane-containing mixtures.24–35 These efforts have mainly addressed frameworks with eight-membered ring pore apertures, especially AEI-type AlPO-18 and CHA-type SAPO-34, because the diffusion of CO2 or N2 (kinetic diameters dkin of 3.30 Å and 3.64 Å, respectively3) through these windows is faster than the diffusion of CH4 (dkin = 3.80 Å). Since CO2 is more strongly adsorbed than CH4, the combination of stronger adsorption and faster diffusion of carbon dioxide affords high CO2/CH4 membrane selectivities: for example, Wang et al. reported a separation selectivity of 220 (room temperature, equimolar CO2/CH4 mixture) for an AlPO-18 membrane grown on a porous alumina support.31 In contrast, methane adsorbs more strongly than nitrogen, but nitrogen diffuses faster. AlPO and SAPO membranes exhibit an overall N2 selectivity, i.e. the difference in diffusivity dominates over the stronger adsorption of CH4. N2/CH4 separation selectivities of ∼5 and ∼8 were obtained for AlPO-18 and SAPO-34 membranes, respectively.32,34,35 A preliminary economic assessment indicated that a membrane-based separation using SAPO-34 could be competitive to cryogenic distillation for small nitrogen-contaminated gas wells.32
Computational studies using force-field based simulation methods have delivered valuable insights into the adsorption and diffusion of guest molecules in zeolites and related porous materials.36–38 While grand-canonical Monte Carlo (GCMC) simulations permit a prediction of the equilibrium properties, such as adsorption isotherms and isosteric heats of adsorption, Molecular Dynamics (MD) calculations allow to study the time-dependent behaviour. Although there are many GCMC studies of the adsorption of methane and methane-containing mixtures in aluminosilicate and all-silica zeolites,39–50 investigations of AlPOs or SAPOs are comparatively scarce: in the 1990s, different researchers studied the adsorption of methane in AlPOs with large one-dimensional channels, especially AlPO-5 (AFI), focusing on the structure of the adsorbed phase and structural rearrangements occurring upon increasing pressure.51–54 With regard to separations, Koh et al. performed CO2/CH4 mixture adsorption experiments on AlPO-5 and compared their experimental results to a set of GCMC simulations that used different force field parameters.55 They obtained CO2/CH4 selectivities of about ∼3, both from their experiments and with the best-performing GCMC approach. Also for AlPO-5, Adhangale and Keffer investigated the adsorption of methane, ethane, and their mixtures, and predicted C2H6/CH4 selectivities for a range of temperatures.56 The adsorption of carbon dioxide in AlPO-18 and in the SAPO STA-7 (SAV) was studied using a combination of GCMC simulations and adsorption experiments by Maurin's group.57,58 In addition to computing adsorption isotherms, these authors also investigated the preferred adsorption configurations of CO2 and, for the case of STA-7, the impact of changes in the silicon distribution on the CO2 adsorption properties. While an extension to simulations of CO2/CH4 mixture adsorption is mentioned in the Conclusions section of ref. 58, it seems that this was never published. Finally, the author of this contribution recently published a GCMC study of CO2/N2 mixture adsorption in 51 aluminophosphate zeotypes.59 This selection comprised the large majority of framework types that have been synthesised either as AlPOs, as SAPOs, or as metal aluminophosphates (MeAPOs). Due to the additional challenges associated with the modelling of SAPOs and MeAPOs, especially the necessity to account for different possible distributions of heteroatoms and charge-balancing species, and the limited availability of suitable interaction parameters, all frameworks were considered in pure-AlPO4 composition. Prior to the GCMC simulations, all AlPOs were optimised using dispersion-corrected density functional theory (DFT) calculations. In addition to predicting CO2/N2 adsorption selectivities and CO2 working capacities for VSA and PSA conditions, interaction energy maps for selected AlPOs were employed to study the microscopic origins of the observed CO2 adsorption properties.
In the present study, a similar strategy is followed to investigate the adsorption of CO2/CH4 and CH4/N2 mixtures in a total of 53 AlPOs. For CO2/CH4 mixtures, both an equimolar composition and a 15/85 composition are considered, whereas an 85/15 molar ratio is assumed for the CH4/N2 mixture. While these compositions are heavily simplified with respect to real natural gas or biogas, which contain other contaminants like water or H2S, they correspond to those used in typical experimental studies evaluating the suitability of adsorbents for use in natural gas/biogas upgrade.9,10,60 The investigation is primarily motivated by the fact that only a relatively small number of frameworks have been characterised experimentally in terms of their adsorption properties. To this end, the simulations can help to identify promising frameworks that warrant further experimental study. Moreover, most experimental studies report only single-component low-pressure isotherms (up to 100 kPa), meaning that selectivities can only be inferred indirectly, whereas the prediction of mixture adsorption isotherms with GCMC simulations is straightforward. Finally, the simulations also provide insights into the microscopic origins of the macroscopically observed adsorption behaviour. Using “interaction energy maps”, i.e. a visualisation of the interaction energy in the accessible pore space, four AlPO frameworks are studied on the microscopic level in some detail. These AlPOs were chosen because they either exhibit exceptionally high selectivities or a pronounced variation of the affinity towards CO2 as a function of loading.
2 Computational details
Prior to the Monte Carlo simulations, all frameworks were optimised using dispersion-corrected DFT. Of the 53 frameworks considered, 51 have already been included in our previous study of CO2/N2 separation,59 and the same structures were used in the present work (CIF files are available as ESI† to ref. 59). The two additional frameworks are the SFW and the SWY frameworks, which correspond to two silicoaluminophosphates that were recently synthesised by Wright and co-workers (STA-18 – SFW and STA-20 – SWY).61,62 Like all other structures, these two frameworks were optimised in pure-AlPO4 composition. The setup of the structure optimisations was chosen on the basis of previous benchmarking work,63,64 using the CASTEP code with on-the-fly-generated ultrasoft pseudopotentials,65 the PBE functional66 in conjunction with the dispersion correction devised by Tkatchenko and Scheffler,67 and an energy cutoff of 700 eV. For both frameworks, only the Γ point was used to sample the first Brillouin zone. CIF files of these two structures are included as ESI.†All Monte Carlo simulations were performed with the “Sorption” module of the DS Biovia “Materials Studio” suite. Appropriately sized simulation boxes were constructed by replicating the crystallographic unit cells in a way that all dimensions of the box exceed 24 Å (at least twice the cutoff of 12 Å used for dispersive interactions, see below). In GCMC simulations, the temperature and fugacity are specified, and the simulation delivers the equilibrium number of guest molecules per box for the given conditions. For pressures up to 100 kPa, ideal gas behaviour was assumed for all guest species. For higher pressures, the fugacity corresponding to a given pressure was calculated using the Peng–Robinson equation of state. To validate the combination of force field parameters described below, GCMC simulations of methane adsorption were performed for three AlPOs for which experimental data are available. These calculations used 5 million equilibration and 10 million production steps. Simulations of 50/50 and 15/85 CO2/CH4 mixture adsorption and 85/15 CH4/N2 mixture adsorption used 5 million equilibration and 25 million production steps. For a given total pressure, the selectivity was calculated according to:

As in our previous study, the Monte Carlo simulations used Lennard-Jones (LJ) 12–6 potentials to model long-range dispersion and short-range repulsion, and point charges to represent electrostatic interactions. A cutoff of 12 Å was used for the LJ potentials, and Ewald summation was employed for electrostatics. LJ parameters representing non-identical atom types were obtained by means of Lorentz–Berthelot mixing rules. Parameters for CO2 and N2 were taken from the TraPPE force field, which was designed to reproduce vapour-liquid equilibrium data (Table 1).68 For methane, parameters were taken from the OPLS-AA force field, as this parameter set includes point charges, whereas the TraPPE-explicit hydrogen force field neglects electrostatics for methane.69,70 While it has to be expected that the contribution of electrostatics to the total interaction energy for methane is marginal, it appeared preferable to include these interactions for the sake of consistency. The OPLS-AA force field gives a good to reasonable prediction of the fluid properties of methane (good agreement in boiling point, critical temperature, and critical pressure, but overestimation of critical density).70 Albeit the OPLS-AA parameters are used less frequently than the TraPPE force field in adsorption simulations, some researchers have employed them to model CH4 adsorption in zeolites,46 MOFs,71 and mesoporous carbon and silica materials.72 The parameters representing the AlPO frameworks were the same as in previous work (Table 1).59 This parameter set uses a combination of point charges obtained from DFT calculations using the REPEAT method73 and empirically derived LJ parameters.74 These LJ parameters were fitted to reproduce experimental CO2 adsorption data for three all-silica zeolites (LTA, MFI, DDR), delivering good agreement with experiment not only for the zeolites included in the fitting, but also for CO2 adsorption in all-silica CHA, and for N2 adsorption in zeolites MFI and DDR. While the parameters were originally developed for all-silica zeolites, their applicability for modelling CO2 and N2 adsorption in aluminophosphate frameworks has been demonstrated.59 Both the guest molecules and the AlPO frameworks were treated as rigid in the simulations. Inaccessible pore spaces, such as cages that are only bordered by six-membered rings and smaller rings, were blocked using non-interacting spheres in order to avoid an artificial adsorption in these areas.
| Atom | q/e | R 0/Å | D 0/kJ mol−1 | ||
|---|---|---|---|---|---|
| a c.o.m. corresponds to a “dummy” site at the centre of mass of the N2 molecule, which is introduced to model the quadrupole moment. | |||||
| AlPOs59 | Al | +1.272 | — | — | |
| P | +1.284 | — | — | ||
| O | −0.639 | 3.457 | 0.8895 | ||
CO2![[thin space (1/6-em)]](https://www.rsc.org/images/entities/char_2009.gif) 68 68 |
C | +0.700 | 3.143 | 0.2245 | d(C–O) = 1.16 Å |
| O | −0.350 | 3.424 | 0.6568 | ||
| CH469 |
C | −0.240 | 3.929 | 0.2761 | d(C–H) = 1.09 Å |
| H | +0.060 | 2.806 | 0.1255 | ||
| N268 |
N | −0.482 | 3.715 | 0.2993 | d(N–c.o.m) = 0.55 Å |
| c.o.m.a | +0.964 | — | — | ||
3 Results and discussion
3.1 Force field validation for methane
The force field parameters for modelling CO2 and N2 adsorption in AlPOs have been validated in previous work.59 In order to ensure that the chosen parameters are also suitable for modelling the adsorption of methane in AlPOs, GCMC simulations were performed for some AlPOs for which experimental methane adsorption data are available, namely AlPO-18 (AEI), AlPO-11 (AEL), and AlPO-17 (ERI). A comparison of the simulation results to experiment is shown in Fig. 1. It should be noted that several sets of experimental data are available for some AlPOs, which often differ considerably in the measured methane uptakes. For example, Delgado et al. reported an uptake of about 0.23 mmol g−1 for AlPO-11 at 298 K and 100 kPa,16 which is about 40% lower than the uptake measured by Predescu et al. at a very similar temperature (0.37 mmol g−1 at 296 K).15 It can be hypothesised that such differences arise from a larger amount of occluded voids and other defects in the sample prepared by Delgado et al. A quantitative approach to account for the impact of defects on the adsorption isotherms could make use of a scaling of the experimental data, with the scaling factor depending on the ratio of the measured specific surface area or pore volume (typically obtained from nitrogen adsorption at 77 K) to the computed ideal value.75,76 Unfortunately, however, many of the experimental studies report neither surface areas nor pore volumes of the AlPO samples, precluding such a scaling of the isotherms. Therefore, the current study relied on the experimental data sets reporting the highest uptakes under given conditions, assuming that the highest uptake should be measured for a sample that resembles the defect-free crystal structure used in the simulations most closely. As is visible from Fig. 1, the simulated methane isotherms agree very well with the experimental data across the range of temperatures considered (273 K to 313 K), giving confidence in the choice of parameters. Simulations using the TraPPE-UA (united atom) force field instead of OPLS-AA parameters for methane, which were carried out for comparative purposes, led to a systematic overestimation of the methane uptakes by 40–60% (see EXCEL file that is part of the ESI†). This indicates that use of the TraPPE-UA model in conjunction with the AlPO framework parameters is unsuitable to describe methane adsorption in these materials. | ||
| Fig. 1 Validation of the force field parameters for simulations of methane adsorption. Black symbols = simulations, coloured open symbols = experimental data. Experimental data taken from Wu et al. (AlPO-18 [AEI], blue symbols),29 Predescu et al. (AlPO-11 [AEL] and AlPO-17 [ERI], orange symbols),15 and Bacsik et al. (AlPO-17, green symbols).18 | ||
3.2 CO2/CH4 mixture adsorption
The full CO2/CH4 adsorption isotherms, selectivities, and isosteric heats of adsorption are supplied in the ESI† (in EXCEL format). Fig. 2 provides an overview of the key results, plotting the CO2/CH4 adsorption selectivity at pads against the CO2 working capacities for the VSA, PSA6, and PSA10 pressure ranges as defined above. Furthermore, results for those frameworks having the highest working capacities under given conditions are compiled in Table 2. All AlPOs selectively adsorb CO2 over CH4, but the variation is very large, ranging from S(CO2/CH4) ≈ 60 for systems like GIS and APC, discussed in more detail below, to a very low selectivity that is close to unity for ATV. As we will see in the following section, ATV has an exceptionally high affinity towards methane, which explains its modest preference for CO2 over CH4. Other systems with low CO2/CH4 selectivities in the range of 3 to 5 are large-pore AlPOs such as VFI and FAU. | ||
| Fig. 2 Overview of simulations results for equimolar and 15/85 CO2/CH4 mixtures (T = 298 K). VSA: pads = 100 kPa, pdes = 10 kPa; PSA6: pads = 600 kPa, pdes = 100 kPa; PSA10: pads = 1000 kPa, pdes = 100 kPa. | ||
| Δn(CO2) (VSA) | S(CO2/CH4) at p = 100 kPa | Δn(CO2) (PSA6) | S(CO2/CH4) at p = 600 kPa | Δn(CO2) (PSA10) | S(CO2/CH4) at p = 1000 kPa | |
|---|---|---|---|---|---|---|
| 50/50 CO 2 /CH 4 mixture | ||||||
| GIS | 2.59 | 55.0 | 0.48 | 53.0 | 0.55 | 58.8 |
| SIV | 2.05 | 23.5 | 1.05 | 17.7 | 1.25 | 16.2 |
| ATT | 1.62 | 25.0 | 0.81 | 31.3 | 1.02 | 36.1 |
| AFY | 1.44 | 9.3 | 3.68 | 11.4 | 4.42 | 12.0 |
| BPH | 0.83 | 6.8 | 3.01 | 10.4 | 3.79 | 11.5 |
| KFI | 1.47 | 12.8 | 2.90 | 19.0 | 3.43 | 19.9 |
| LTA | 0.54 | 4.5 | 2.72 | 7.7 | 3.74 | 9.9 |
|
||||||
| 15/85 CO 2 /CH 4 mixture | ||||||
| GIS | 1.89 | 49.3 | 1.34 | 59.6 | 1.42 | 56.3 |
| SIV | 1.16 | 24.1 | 1.30 | 21.3 | 1.56 | 21.7 |
| ATT | 1.07 | 21.6 | 0.91 | 26.9 | 1.07 | 26.8 |
| AFY | 0.44 | 9.2 | 1.90 | 9.7 | 2.63 | 10.1 |
| KFI | 0.50 | 10.8 | 1.65 | 14.7 | 2.34 | 16.6 |
| AEI | 0.38 | 6.6 | 1.39 | 9.1 | 1.97 | 10.4 |
| SAV | 0.40 | 7.4 | 1.37 | 9.6 | 1.98 | 11.2 |
As Fig. 2 shows, there is a correlation between working capacity and selectivity for the large majority of systems under VSA conditions. GIS has the highest working capacities for both the equimolar and the 15/85 mixture, with 2.59 and 1.89 mmol g−1, respectively, and one of the highest CO2/CH4 selectivities (∼50). This mirrors the findings of previous GCMC studies, where the GIS topology was found to exhibit a high CO2/N2 selectivity and a high CO2 uptake at relatively low partial pressures due to the strong interaction of adsorbed CO2 molecules with the framework at the centre and the windows of the gismondine (gis) cages, which constitute the only building block of this framework.59,74,77 Similarly strong framework-CO2 interactions were calculated for the SIV, ATT, and ATN topologies, which also feature among the AlPOs having a relatively high working capacity under VSA conditions (although much lower than that of GIS) and selectivities in the range of 20 to 30. Two other frameworks, APC and AEN, are highly selective towards CO2, but appear less promising for VSA separations due to their low working capacities.
For PSA conditions and the equimolar CO2/CH4 mixture, those frameworks that were found to be most promising under VSA conditions such as GIS and SIV are compromised by their low working capacities. This is easily explained when considering that most of the CO2 adsorbed in these AlPOs is adsorbed at pressures below 100 kPa, i.e. below the PSA desorption pressure. For example, GIS adsorbs 3.45 mmol g−1 CO2 at a total pressure of 100 kPa, and this merely increases to 4.00 mmol g−1 at 1000 kPa. Clearly, these AlPOs are unsuitable adsorbents for PSA separations of CO2-rich mixtures. Instead, the AFY, BPH, KFI, and LTA frameworks emerge as promising due to their much higher working capacities of up to 4.4 mmol g−1 (see Table 2). Among these, KFI seems to have the best balance between a high working capacity and a relatively high CO2/CH4 selectivity of ∼20, whereas the selectivities of the other frameworks are closer to 10. As shown in detail in previous work, the adsorption properties of the KFI framework can be explained with the presence of two different types of cages in the structure:59 In the smaller cages, the interaction with CO2 is strong, incurring a significant preference for carbon dioxide over more weakly adsorbed gases like nitrogen and methane. On the other hand, the presence of larger cages permits a significant adsorption of CO2 up to high partial pressures, leading to a high CO2 working capacity under PSA conditions.
Somewhat different observations can be made for the 15/85 mixture. Here, the highly selective frameworks GIS and APC show working capacities around 1.5 mmol g−1 for the PSA10 case, where the highest working capacities reached by AFY and KFI are in the range of 2.3 to 2.6 mmol g−1. A closer look at the uptakes reached at 100 kPa (i.e. a partial CO2 pressure of 15 kPa) shows that even the frameworks with a high affinity towards CO2 are still relatively far away from reaching saturation, therefore exhibiting reasonable working capacities under PSA conditions. Clearly, the balance would shift in their favour even more for CO2-poor mixtures (e.g. 5/95 CO2/CH4).
While only three particular pressure ranges are considered in Fig. 2, the whole body of data available permits to predict the performance of the AlPO frameworks for other pressure ranges. For example, Rodrigues' group proposed a vacuum pressure swing adsorption process for natural gas upgrade, which employed an adsorption pressure of 320 kPa and a desorption pressure of 10 kPa.78 When using the data supplied in the ESI† to calculate the working capacity Δn(CO2) for a pressure range between 400 kPa and 10 kPa for all 53 AlPOs considered, AFY, KFI, AEI, and SAV are found to have the highest working capacities when an equimolar mixture composition is assumed (4.32/3.76/3.44/3.44 mmol g−1 for AFY/KFI/AEI/SAV), whereas GIS has the highest working capacity for the 15/85 CO2/CH4 mixture (3.10 mmol g−1). The selectivities at 400 kPa are quite close to those at 600 kPa, which are given in Table 2.
As mentioned in the Introduction, all frameworks considered in the present study have been reported either as AlPOs or as heteroatom-substituted AlPO derivatives. However, not all of them can be synthesised in pure-AlPO4 composition, and not all of them are stable upon template removal. Of those frameworks that are most interesting for CO2/CH4 separation under VSA conditions, GIS and ATT have been reported as pure AlPOs,79,80 however, a porosity that is accessible to guest molecules like oxygen or xenon has – to the author's knowledge – only been reported for the latter framework, AlPO-33.80 The SIV framework has so far been synthesised as cobalt aluminophosphate (SIZ-7), and no information regarding its behaviour upon template removal was provided.81AFY, the framework having the highest CO2 working capacities under PSA conditions, has been synthesised in metal aluminophosphate composition, it collapses upon template removal.82 Likewise, the BPH, KFI, and SAV frameworks are only available as heteroatom-substituted AlPO derivatives: KFI and SAV have been reported as SAPOs (STA-14 – KFI, STA-7 – SAV),83 and BPH as MgAPO.84 All these materials are stable upon template removal, and CO2 adsorption isotherms have been measured for STA-7.57 The remaining two frameworks listed in Table 2, AEI and LTA, are both available as porous aluminophosphates. Several adsorption studies of AEI-type AlPO-18 have been mentioned above,15,29,31 and a fully calcined LTA-type AlPO has been proposed recently as a potential adsorbent for water adsorption.85 Of all frameworks identified as promising, these two can thus be considered as being most “mature” in terms of synthesis and activation procedures, and experimental studies of their separation ability under relevant conditions should be feasible without incurring a need for further fundamental material development.
3.3 CH4/N2 mixture adsorption
An overview of the results for 85/15 CH4/N2 mixture adsorption is given in Fig. 3, and results for selected AlPOs are tabulated in Table 3. First of all, it is worth noting that all frameworks prefer methane over nitrogen. This indicates that the stronger dispersive interaction with methane more than offsets the additional electrostatic interaction with nitrogen, which (unlike methane) possesses a quadrupole moment (an analysis of selected system shows that electrostatic interactions may contribute up to ∼5% to the total interaction energy for nitrogen, but constitute a marginal contribution of <1% for methane). A preference for CH4 over N2 is observed for the large majority of adsorbents, including carbon molecular sieves and cation-exchanged zeolites, with the most prominent exception being some cation-containing titanosilicates.2 In the set of AlPOs studied, modest CH4/N2 selectivities between 2 and 4 are predicted for the large majority of frameworks. The only outlier towards higher values is ATV, with a selectivity of 6.5–7.0. Under VSA conditions, ATV also has the highest CH4 working capacity, which however remains modest in absolute terms (∼0.7 mmol g−1). When moving to PSA conditions, some frameworks like ACO, RHO, and AFY surpass ATV in terms of working capacity, especially when an adsorption pressure of 1000 kPa is assumed: in the PSA10 case, their working capacities are close to 2.4 mmol g−1, compared to 1.5 mmol g−1 for ATV. Among these three AlPOs, ACO has the highest CH4/N2 selectivity of 3.8. Overall, the selectivities and working capacities of the “best” AlPOs are much smaller for the CH4/N2 mixture than for the CO2/CH4 mixtures considered above, highlighting the particular challenges associated with the development of an efficient adsorption-based CH4/N2 separation process. | ||
| Fig. 3 Overview of simulations results for an 85/15 CH4/N2 mixture (T = 298 K). | ||
| Δn(CH4) (VSA) | S(CH4/N2) at p = 100 kPa | Δn(CH4) (PSA6) | S(CH4/N2) at p = 600 kPa | Δn(CH4) (PSA10) | S(CH4/N2) at p = 1000 kPa | |
|---|---|---|---|---|---|---|
| ATV | 0.69 | 6.6 | 1.27 | 7.0 | 1.48 | 6.7 |
| JSN | 0.59 | 4.3 | 1.13 | 4.4 | 1.46 | 4.3 |
| ATN | 0.57 | 3.4 | 0.87 | 3.5 | 1.02 | 3.4 |
| RHO | 0.43 | 3.1 | 1.64 | 3.0 | 2.38 | 3.0 |
| AFY | 0.27 | 2.3 | 1.44 | 2.5 | 2.38 | 2.5 |
| ACO | 0.25 | 3.3 | 1.42 | 3.6 | 2.40 | 3.8 |
Among the AlPOs listed in Table 3, the ATV and ATN frameworks can be synthesised as pure AlPO4 frameworks, dubbed AlPO-25 and AlPO-39, respectively, and their calcination results in permanent porosity.86,87 The JSN and ACO frameworks, like AFY, can only be synthesised as MeAPOs, and they lose their crystallinity upon template removal.82,88 A RHO-type SAPO dubbed DNL-6, which shows accessible porosity to CO2, CH4, and N2, has been reported recently, but no AlPO4 analogue is (yet) available.21
3.4 Developing microscopic explanations for macroscopic predictions
Previous work has already provided a microscopic explanation of the high CO2/N2 selectivity of GIS and ATN and the high CO2 working capacity of frameworks like AFY and KFI under PSA conditions by making use of interaction energy maps obtained from Monte Carlo simulations.59 While all these AlPOs were also found to feature among the most interesting systems for CO2/CH4 separations, a repeated discussion of these previous findings would not provide any new insights. Instead, the present study will look at a few other aspects where a microscopic picture of the predicted macroscopic adsorption behaviour can be developed on the basis of the GCMC simulations.The discussion above has focused on the adsorption selectivity at the adsorption pressure pads and the working capacity for the more strongly adsorbed species (Δn1). However, some authors have argued that a better performance indicator for separations should also take the selectivity at the desorption pressure S12(pdes) and the working capacity for the less strongly adsorbed species (Δn2) into account. One such quantity is the sorbent selection parameter as defined by Bae and Snurr:89,90

Test calculations of the sorbent selection parameter for 50/50 CO2/CH4 mixtures (see EXCEL file supplied as ESI†) delivered extremely high values for some systems (most prominently ATN, ATT, and OWE) under PSA conditions: for example, Ssorbent for ATN amounts to more than 100000, which is at least three orders of magnitude larger than typical values obtained for experimentally characterised adsorbents.90 The origin of this peculiar feature lies in the very small value of the methane working capacity: in the case of ATN, the CH4 uptakes from the equimolar mixture at 100 kPa and 1000 kPa are essentially identical (0.0715 and 0.0718 mmol g−1, see Fig. 4). In other words, while the CO2 uptake still increases from 1.8 to 2.5 mmol g−1 (i.e. saturation is not yet reached), the adsorbent does not permit any additional adsorption of methane in this pressure range. To explain this behaviour at the microscopic level, interaction energy maps for CO2 and CH4 were computed from fixed-loading simulations for a loading of one molecule per simulation box. The results are shown in Fig. 5. For the case of CO2, there are two regions of strong interaction (Uint ≈ −33 kJ mol−1), one inside the atn cages and the other one at the centre of the eight-ring windows connecting these cages. This is in accordance with the previous observation of two distinct local minima for CO2 in a simulation study of all-silica ATN.77 At a total pressure of 200 kPa, approximately two CO2 molecules per unit cell (u.c.) are adsorbed (light blue line in Fig. 4). This corresponds to one molecule for each atn cage. The fact that the loading increases to ∼2.5 molecules per u.c. at 1000 kPa indicates that additional molecules can be adsorbed, and the interaction energy map shows that such an additional adsorption of CO2 can be achieved by occupying some of the connecting windows. For methane, the interaction is most favourable at the centre of the atn cages, but much weaker than for CO2 (Uint ≈ −20 kJ mol−1). The variation of the interaction energy inside the cages is rather small, and there are no preferred adsorption regions at the window centres for methane. Therefore, once all cages are occupied by CO2 molecules, the whole pore space that is accessible to methane is essentially blocked, and the co-adsorption of methane becomes energetically unfavourable. As a consequence, the methane loading does not increase anymore after a loading of two CO2/u.c. has been reached.
 | ||
| Fig. 4 Top: 50/50 CO2/CH4 mixture adsorption isotherm for ATN. Bottom: 85/15 CH4/N2 mixture adsorption isotherm for ATV. Note that different y-scales are used for the different species in both plots. | ||
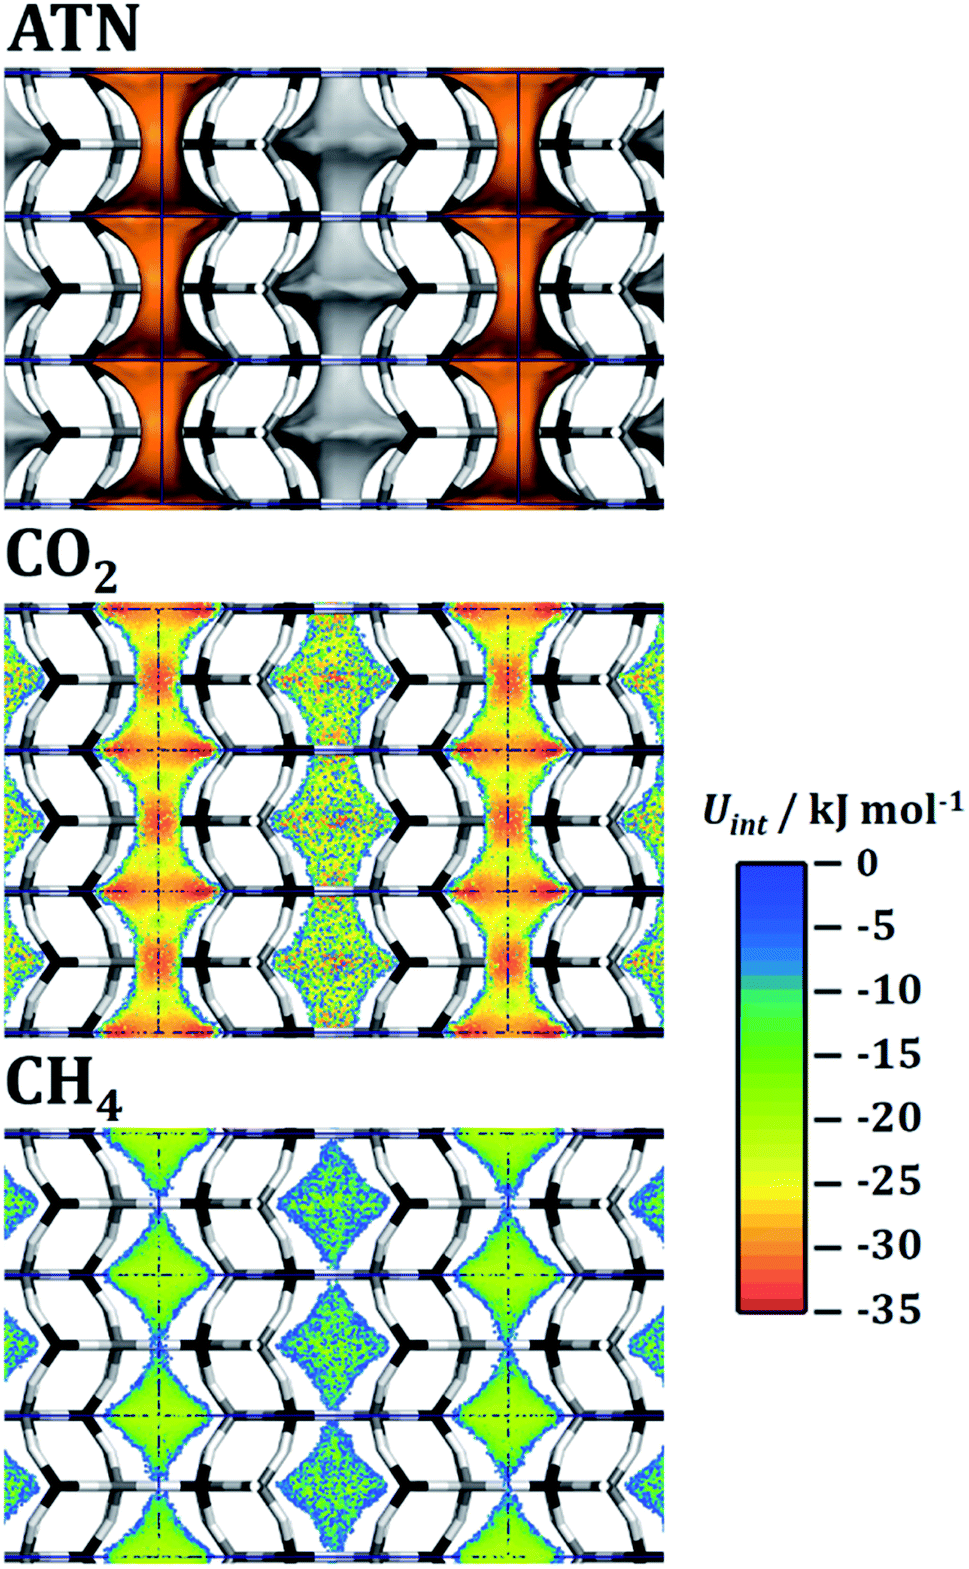 | ||
| Fig. 5 ATN: top: visualisation of the accessible pore space. Centre and bottom: interaction energy maps for CO2 and CH4. Projection along [100]. | ||
As discussed in Section 3.3, ATV is the system having by far the highest CH4/N2 selectivity. The mixture adsorption isotherm is shown in Fig. 4. In order to understand the high preference of this framework for CH4 over N2, interaction energy maps were computed for both species by means of fixed-loading MC simulations for a loading of one molecule per simulation box. The results are shown in Fig. 6. The accessible pore space in the ATV framework consists of one-dimensional channels, running along the c-direction, in which wider segments (cavities) are connected by eight-ring apertures. Fig. 6 clearly shows that the interaction with methane in these cavities is considerably stronger than for nitrogen, with maximal interaction energies of ∼−25 kJ mol−1 and ∼−20 kJ mol−1, respectively. This explains the high heat of methane adsorption observed in this system, which is about 3 kJ mol−1 higher than in the second-best AlPO (25.5 kJ mol−1 in ATV compared to 22.7 kJ mol−1 in DFT). Apparently, the cavities of ATV have the perfect size to maximise the dispersive interaction of adsorbed methane molecules with the pore walls. A comparison of the total number of molecules adsorbed at the highest pressure (∼3.3 CH4 per unit cell at 1000 kPa, where complete saturation is not yet reached) to the number of such cavities (four per unit cell, see dark red line in Fig. 4) clearly shows that each cavity can only be occupied by a single methane molecule. Nevertheless, an increase of the heat of CH4 adsorption from 25.5 kJ mol−1 at low loadings to 27.5 kJ mol−1 at high loadings indicates a significant attractive fluid-fluid interaction. While the present predictions render ATV promising in terms of equilibrium selectivity, a potential drawback is also visible in Fig. 6: although the interaction with nitrogen at the channel apertures remains attractive (interaction energies of approx. −12 kJ mol−1), this is not the case for methane. This observation points to a significant energy barrier towards the diffusion of methane through the eight-ring apertures. On the other hand, it has to be noted that the GCMC simulations neglect a potential flexibility of the framework, which could facilitate diffusion in comparison to a completely rigid model. An MD approach using a suitable force field that describes the framework flexibility would be needed to investigate this in more detail.
 | ||
| Fig. 6 ATV: left: visualisation of the accessible pore space. Centre and right: interaction energy maps for CH4 and N2. Projection along [100]. | ||
In the first two case studies, the microscopic discussion was based on the interaction energy maps obtained for low loadings. In the following, we look at another aspect, namely the loading-dependent evolution of the heat of CO2 adsorption and the CO2/CH4 selectivity in the AEI and GME frameworks. These two AlPOs were chosen as representatives for two types of behaviour that are found in several frameworks: first, AEI, like many other AlPOs studied (among them AFN, AWW, BPH, CHA, ERI, KFI, LEV, LTA, and SAV), exhibits a continuous increase of both heat of adsorption and selectivity with increasing CO2 loading. Second, several frameworks with gmelinite (gme) cages like GME, AFT, AFX, and SFW show an initial decrease of qst(CO2) and S(CO2/CH4), followed by a later increase. Fig. 7 visualises the evolution of both quantities as a function of CO2 loading for both frameworks, taking the GCMC simulations results obtained for the 50/50 CO2/CH4 mixture as a basis. For AEI, the heat of CO2 adsorption increases from ∼23 kJ mol−1 at low loading to 31.5 kJ mol−1 at the highest CO2 loading considered (4.7 mmol g−1), and the CO2/CH4 selectivity concurrently increases from 6 to ∼14. The overall variation of both qst(CO2) and S(CO2/CH4) in GME is less pronounced, however, the fact that both quantities reach a minimum at a CO2 loading of ∼2 mmol g−1 before increasing indicates a rather complex microscopic origin.
 | ||
| Fig. 7 Evolution of the heat of CO2 adsorption (blue) and the CO2/CH4 selectivity (dark red) as a function of CO2 loading in AEI and GME (50/50 CO2/CH4 mixture). | ||
In order to rationalise the evolution of qst(CO2) and S(CO2/CH4) in AEI, fixed-loading simulations were performed for a series of CO2 loadings, ranging from one molecule per simulation box (∼0.042 mmol g−1) to 110 molecules per box (∼4.7 mmol g−1). For each loading, the energy distribution P(Uint) of the adsorbed CO2 molecules was calculated, and these distributions are shown in Fig. 8 (note that the distributions are normalised in a way that the area below the curve is identical). Regardless of the loading, there is only one rather broad peak in the energy distribution, with the maximum shifting from −22 kJ mol−1 to −29.5 kJ mol−1 upon increasing CO2 loading, consistent with the increase of the heat of adsorption. To develop a microscopic explanation, interaction energy maps for CO2 were extracted from the simulations for one, 58, and 110 CO2 molecules per simulation box (corresponding to CO2 uptakes of 0.04, 2.5, and 4.7 mmol g−1, respectively), shown in Fig. 8. At the lowest loading, the regions of strongest interaction are clearly localised at the eight-ring apertures that connect the pear-shaped aei cages (note that only four of the six eight-ring windows of each cage are visible in the projection used in Fig. 8). At the window centres, Uint reaches up to −28 kJ mol−1, but the interaction inside the cages is considerably weaker. Moving to the intermediate loading of 58 CO2 per box, the interaction at the eight-ring windows becomes approximately 3 kJ mol−1 stronger, and an even more pronounced increase is visible in the top part of the aei cage (this top part corresponds to the narrower “neck” area of the pear-shaped cage). The interaction strength further increases at the highest loading, where interaction energies on the order of −34 kJ mol−1 are reached. This pronounced increase can be attributed to attractive CO2–CO2 interactions: at low loadings, CO2 molecules preferentially adsorb inside the eight-ring windows, where they are too far apart for an appreciable guest–guest interaction. Once the windows are mostly occupied, there will be a mutual attractive interaction between the CO2 molecules at the windows and additional CO2 molecules adsorbed inside the cage, thus leading to an increase in the average interaction energy per molecule (and, concurrently, the heat of CO2 adsorption). It has to be noted that the heat of CH4 adsorption also increases from 16.3 kJ mol−1 to 20.8 kJ mol−1, an effect that can be attributed to attractive interactions between methane molecules and adsorbed CO2. However, this increase is significantly smaller than for CO2, which is why the CO2/CH4 selectivity increases with CO2 loading. As mentioned above, an increase of qst(CO2) with CO2 loading is a common feature of many AlPOs. Typically, these frameworks also contain medium-sized to large cages that are connected by eight-ring windows. The explanation developed here for the example of AEI should therefore be transferable to these other topologies.
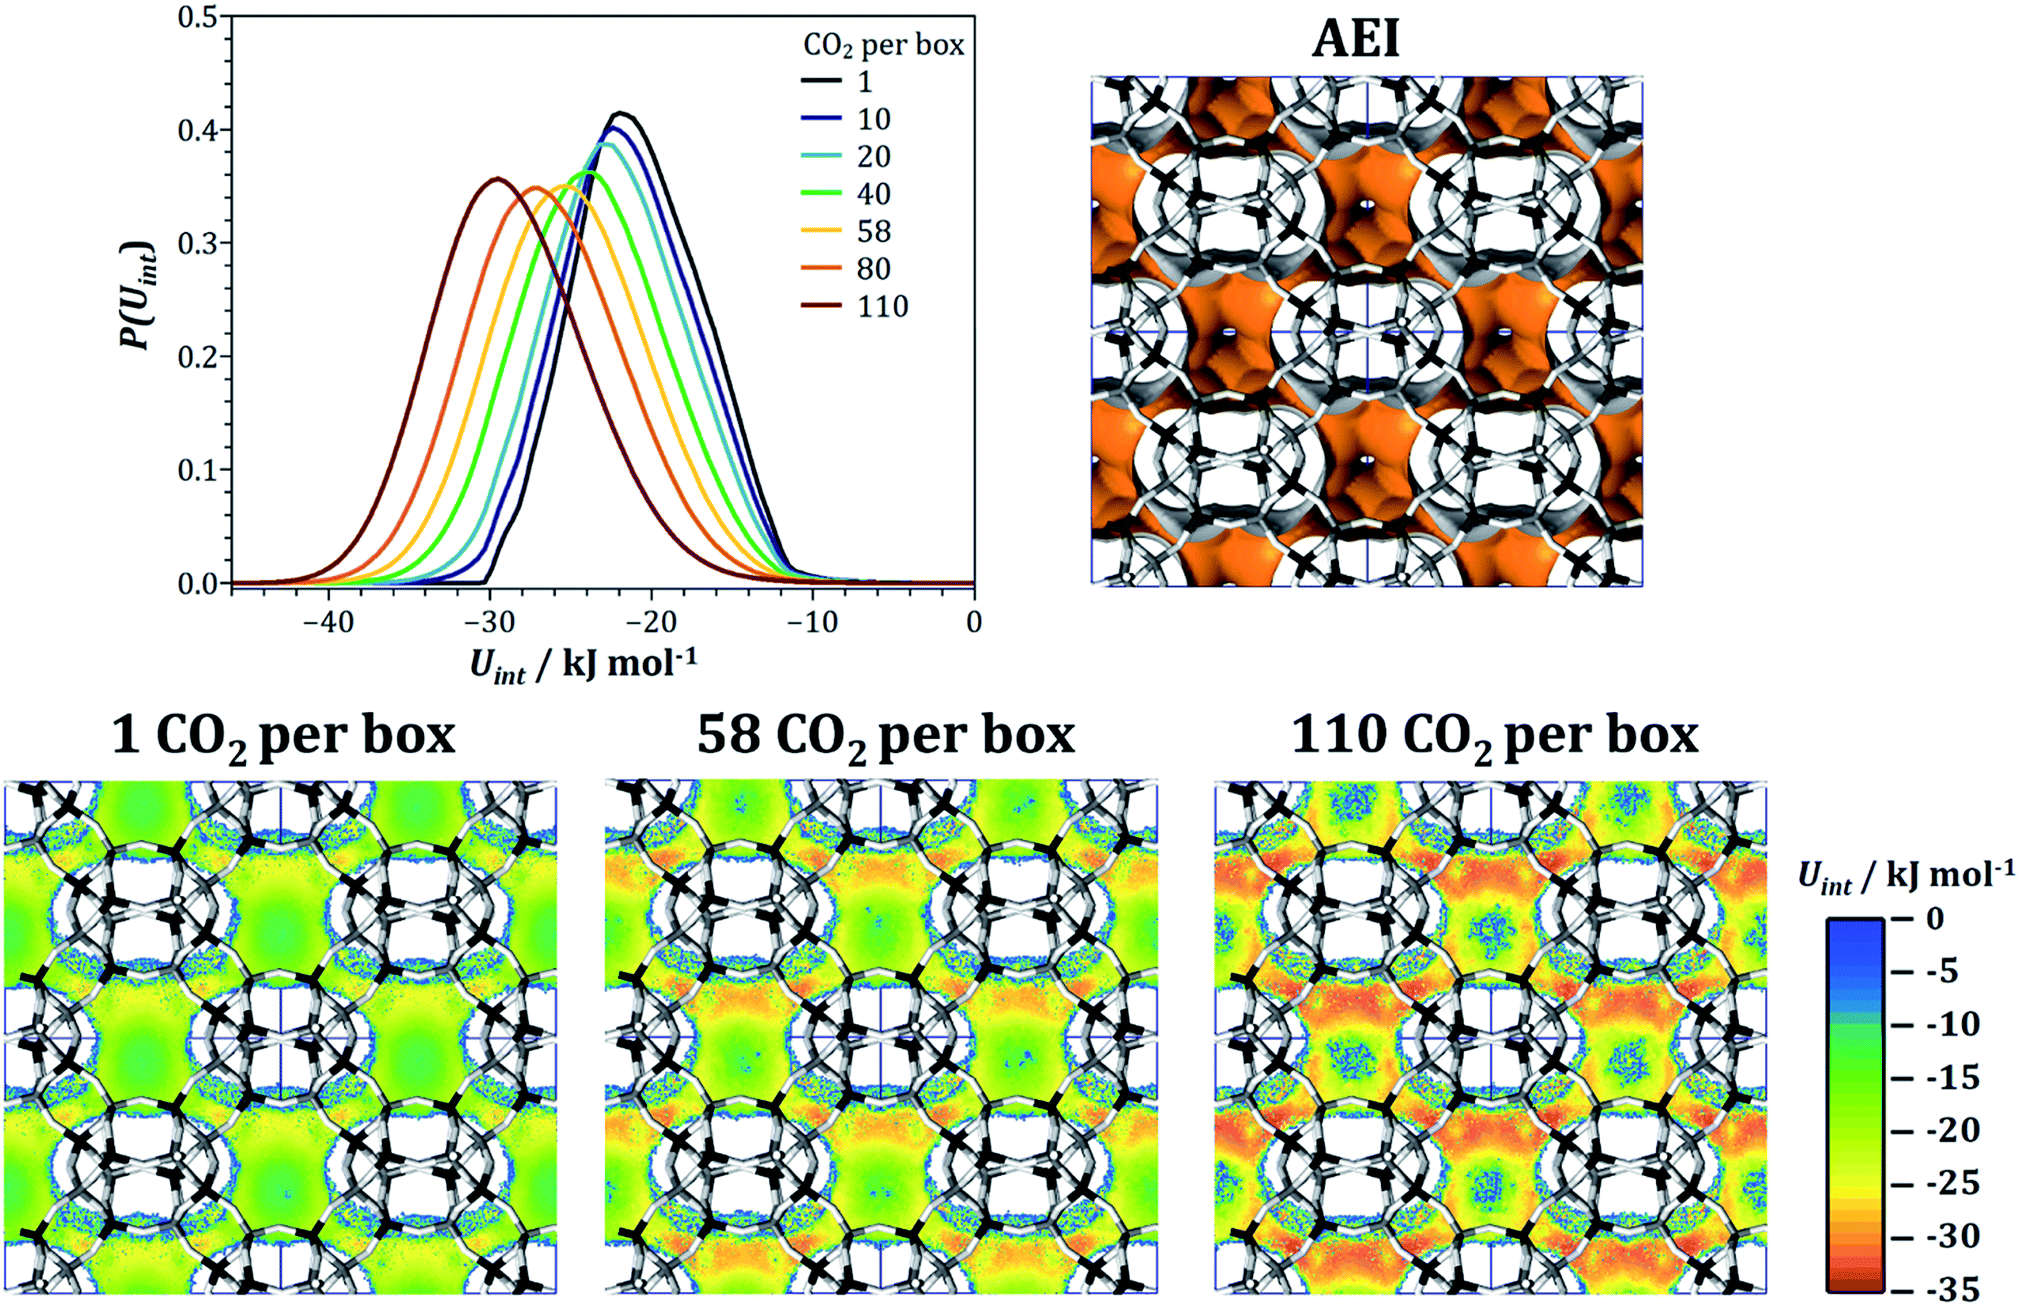 | ||
| Fig. 8 AEI: top: interaction energy distribution at different CO2 loadings and visualisation of the accessible pore space. Bottom: interaction energy maps for CO2 at three selected loadings. Projection along [001]. | ||
We have previously explained the decrease of the heat of CO2 adsorption with increasing loading in all-silica GME with repulsive interactions between CO2 molecules adsorbed in a single gme cage, however, this explanation remained largely phenomenological.74 As for AEI, fixed-loading simulations were performed for a series of CO2 loadings, in this case ranging from one to 80 molecules per box (from ∼0.055 mmol g−1 to ∼4.5 mmol g−1). The energy distributions P(Uint) obtained from these calculations are shown in Fig. 9. At low loadings, there is a clear bimodal distribution of the interaction energies, with a first peak centered at about −32 kJ mol−1 and a second broad peak with a maximum at ∼−17 kJ mol−1. Up to a loading of 36 CO2 per box, the two peaks remain well distinguishable, but the proportions change, with the second peak increasing at the expense of the first peak. At higher loadings, the two peaks tend to merge, with only one very broad maximum extending from about −15 kJ mol−1 to −40 kJ mol−1 remaining at a loading of 80 CO2 per box. While the proportion of CO2 molecules with interaction energies of −17 kJ mol−1 or less increases from one to 48 CO2 per box, it decreases again at higher loading. The peculiar evolution of the interaction energy distribution can be understood when looking at interaction energy maps calculated for different loadings. Fig. 9 shows these maps obtained for the lowest loading, an intermediate loading of 36 CO2/box (∼2.1 mmol g−1), and the highest loading of 80 CO2/box. At the lowest loading, the interaction energy inside the gme cages amounts to −25 to −32 kJ mol−1, whereas the interaction in the twelve-ring channels is considerably weaker. While a certain increase due to attractive CO2–CO2 interactions is observed for the intermediate loading, as found above for AEI, the interaction inside the large channels remains distinctly weaker than in the cages, with Uint values between −13 to −20 kJ mol−1. However, when moving to the highest loading of 80 CO2 molecules per box, the interaction energy increases more markedly, especially in the vicinity of the eight-ring windows that lead into the gme cages. Altogether, the evolution of the heat of CO2 adsorption and CO2/CH4 selectivity can be explained as follows: at low loadings, most adsorbed CO2 molecules are located in the gme cages. However, since an occupation of a cage by more than one molecule is energetically unfavourable, an increase in CO2 loading corresponds to an increasing likelihood for additional molecules to adsorb in the twelve-ring channels, leading to a decrease of the average interaction energy per molecule (this corresponds to the increase of the second peak in the interaction energy distribution). Only at high loadings, where attractive fluid–fluid interactions make a significant contribution to the interaction energy in the twelve-ring channels, the heat of CO2 adsorption starts to increase.
 | ||
| Fig. 9 GME: left: interaction energy distribution at different CO2 loadings. Right: interaction energy maps for CO2 at three selected loadings. Projection along [001]. The colour scheme used for interaction energies is the same as in Fig. 8. | ||
4. Conclusions
On the basis of GCMC simulations for a total of 53 AlPO frameworks, several promising adsorbents for PSA or VSA separations of CO2/CH4 and CH4/N2 mixtures could be predicted. It has to be noted that the working capacities of the best-performing AlPOs are not as high as those of some highly porous MOFs.6,7 However, these purely inorganic frameworks typically exhibit higher thermal and hydrothermal stabilities, which might translate into longer lifetimes in real-world applications. While some of the most interesting frameworks are either not available in pure-AlPO4 composition (like KFI, SAV, and SIV) or tend to lose their crystallinity upon template removal (like GIS and AFY), some others have been reported as aluminophosphates that exhibit an accessible porosity after calcination. Among these, the well characterised AlPO-18 (AEI) as well as AlPO-42 (LTA) and AlPO-33 (ATT) should be most relevant for CO2/CH4 separations, whereas AlPO-25 (ATV) is clearly the most interesting system for CH4/N2 separations. As shown for one example, the full set of results obtained in the present study permits predictions for other pressure ranges (up to 1000 kPa) besides those presented in the discussion. An extension of the simulation approach to different mixture compositions or different temperatures (e.g. aiming at TSA or cryo-PSA applications) would also be straightforward. Here, the present results could help to narrow down the selection of AlPOs for which such simulations are insightful, as they provide a basis for ruling out frameworks having too low selectivities, uptake capacities, or both.Following the prediction of mixture adsorption isotherms for all 53 AlPO frameworks, additional Monte Carlo simulations were performed for selected frameworks in order to improve the microscopic understanding of the macroscopic adsorption properties. Our previous, related work on CO2/N2 mixture adsorption concentrated on an analysis of the framework–CO2 interaction, neglecting the aspect of co-adsorption of the more weakly adsorbed species and fluid–fluid interactions.59 In the present study, a comparison of the interaction energy maps for both species of a mixture allowed to explain the “exclusion” of methane in ATN at high CO2 loadings as well as the unusually high preference of ATV for methane over nitrogen. Interaction energy maps calculated for different loadings helped to rationalise the evolution of the affinity towards CO2 as a function of loading in AEI and GME. These four systems were selected due to their peculiar behaviour and, at least in the cases of AEI and ATV, due to their potential relevance for applications. However, analogous simulations could be employed to study other features of interest. For example, ACO and DFT are two frameworks in which the heat of CH4 adsorption increases more strongly than the heat of CO2 adsorption upon increasing loading, an unusual behaviour that might warrant further study from a fundamental point of view.
Clearly, it would be very interesting to also compare a range of structurally diverse charged-framework SAPOs (and possibly MeAPOs) using a similar simulation approach. However, the necessity to account for different possible silicon (or metal) distributions in the framework renders this issue considerably more complex: on the one hand, such a study would require a strategy to determine the energetically most favourable heteroatom distribution for each system, using either force field calculations (which may lack accuracy) or a DFT-based approach (which becomes computationally very demanding). On the other hand, additional parameters to describe the interaction of guest molecules with the framework protons would be needed, although the previous work of Maurin's group on STA-7 (SAV) might provide a good starting point.57,58 From a general point of view, it can be expected that SAPOs/MeAPOs will exhibit higher CO2/CH4 selectivities and higher CO2 working capacities at low partial pressures due to the stronger electrostatic interaction of carbon dioxide with the charged framework. Conversely, charged frameworks will interact more strongly with nitrogen than with methane, leading to a decrease of the CH4/N2 selectivity.
One aspect that was not considered in the present work is the diffusion of the guest species through the AlPO structures. A quantitative study of the diffusion properties by means of MD simulations would require a parameter set that accounts for the flexibility of the framework, thus becoming computationally fairly demanding. Moreover, the diffusion might, in some cases, be so slow that it cannot be observed on the timescale that is accessible with MD simulations, especially for methane (the largest molecule) diffusing through eight-ring windows. In such instances, it would be necessary to employ rare event simulations to predict diffusion coefficients.37 Altogether, an investigation of this complex issue is beyond the scope of the present study. However, we envisage a detailed study of the diffusion properties to be part of a more complete computational characterisation of some prototypical AlPOs having interesting properties for gas separations.
Conflicts of interest
There are no conflicts to declare.Acknowledgements
The author is grateful to Filip Formalik (Wrocław) for a critical reading of the manuscript. Funding was provided by the Central Research Development Fund (CRDF) of the University of Bremen through an individual grant to M. F. (Funding line 04 – Independent Projects for Post-Docs).References
- K. Zhou, S. Chaemchuen and F. Verpoort, Renewable Sustainable Energy Rev., 2017, 79, 1414–1441 CrossRef.
- T. E. Rufford, S. Smart, G. C. Y. Watson, B. F. Graham, J. Boxall, J. C. Diniz da Costa and E. F. May, J. Pet. Sci. Eng., 2012, 94–95, 123–154 CrossRef.
- M. Tagliabue, D. Farrusseng, S. Valencia, S. Aguado, U. Ravon, C. Rizzo, A. Corma and C. Mirodatos, Chem. Eng. J., 2009, 155, 553–566 CrossRef.
- S. Cavenati, C. A. Grande and A. E. Rodrigues, Chem. Eng. Sci., 2006, 61, 3893–3906 CrossRef.
- R. T. Yang, Gas Separation by Adsorption Processes, Imperial College Press, London, UK, 1997 Search PubMed.
- J.-R. Li, Y. Ma, M. C. McCarthy, J. Sculley, J. Yu, H.-K. Jeong, P. B. Balbuena and H.-C. Zhou, Coord. Chem. Rev., 2011, 255, 1791–1823 CrossRef.
- J. Yu, L. Xie, J. Li, Y. Ma, J. M. Seminario and P. B. Balbuena, Chem. Rev., 2017, 117, 9674–9754 CrossRef PubMed.
- M. Ackley, S. U. Rege and H. Saxena, Microporous Mesoporous Mater., 2003, 61, 25–42 CrossRef.
- A. Jayaraman, A. J. Hernandez-Maldonado, R. T. Yang, D. Chinn, C. L. Munson and D. H. Mohr, Chem. Eng. Sci., 2004, 59, 2407–2417 CrossRef.
- J. A. Delgado, M. A. Uguina, J. L. Sotelo, B. Ruíz and J. M. Gómez, Adsorption, 2006, 12, 5–18 CrossRef.
- P. Li and F. H. Tezel, Microporous Mesoporous Mater., 2007, 98, 94–101 CrossRef.
- S. Himeno, T. Tomita, K. Suzuki and S. Yoshida, Microporous Mesoporous Mater., 2007, 98, 62–69 CrossRef.
- J. Yang, J. Li, W. Wang, L. Li and J. Li, Ind. Eng. Chem. Res., 2013, 52, 17856–17864 CrossRef.
- J. Tamnanloo, S. Fatemi and A. Golmakani, Adsorpt. Sci. Technol., 2014, 32, 707–716 CrossRef.
- L. Predescu, F. H. Tezel and S. Chopra, Adsorption, 1997, 3, 7–25 CrossRef.
- J. A. Delgado, V. I. Águeda, M. A. Uguina, J. L. Sotelo and P. Fernández, Adsorption, 2013, 19, 407–422 CrossRef.
- X. Zhao, X. Xu, L. Sun, L. Zhang and X. Liu, Energy Fuels, 2009, 23, 1534–1538 CrossRef.
- Z. Bacsik, O. Cheung, P. Vasiliev and N. Hedin, Appl. Energy, 2016, 162, 613–621 CrossRef.
- M. E. Rivera-Ramos, G. J. Ruiz-Mercado and A. J. Hernández-Maldonado, Ind. Eng. Chem. Res., 2008, 47, 5602–5610 CrossRef.
- A. Golmakani, S. Fatemi and J. Tamnanloo, Ind. Eng. Chem. Res., 2016, 55, 334–350 CrossRef.
- X. Su, P. Tian, D. Fan, Q. Xia, Y. Yang, S. Xu, L. Zhang, Y. Zhang, D. Wang and Z. Liu, ChemSusChem, 2013, 6, 911–918 CrossRef PubMed.
- M. E. Rivera-Ramos and A. J. Hernández-Maldonado, Ind. Eng. Chem. Res., 2007, 46, 4991–5002 CrossRef.
- C. Baerlocher and L. B. McCusker, http://www.iza-structure.org/databases/, 2018.
- S. Li, J. L. Falconer and R. D. Noble, J. Membr. Sci., 2004, 241, 121–135 CrossRef.
- M. Hong, S. Li, H. F. Funke, J. L. Falconer and R. D. Noble, Microporous Mesoporous Mater., 2007, 106, 140–146 CrossRef.
- S. Li, J. L. Falconer and R. D. Noble, Microporous Mesoporous Mater., 2008, 110, 310–317 CrossRef.
- M. L. Carreon, S. Li and M. A. Carreon, Chem. Commun., 2012, 48, 2310–2312 RSC.
- R. Zhou, E. W. Ping, H. H. Funke, J. L. Falconer and R. D. Noble, J. Membr. Sci., 2013, 444, 384–393 CrossRef.
- T. Wu, B. Wang, Z. Lu, R. Zhou and X. Chen, J. Membr. Sci., 2014, 471, 338–346 CrossRef.
- T. Wu, M. C. Diaz, Y. Zheng, R. Zhou, H. H. Funke, J. L. Falconer and R. D. Noble, J. Membr. Sci., 2015, 473, 201–209 CrossRef.
- B. Wang, N. Hu, H. Wang, Y. Zheng and R. Zhou, J. Mater. Chem. A, 2015, 3, 12205–12212 Search PubMed.
- S. Li, Z. Zong, S. J. Zhou, Y. Huang, Z. Song, X. Feng, R. Zhou, H. S. Meyer, M. Yu and M. A. Carreon, J. Membr. Sci., 2015, 487, 141–151 CrossRef.
- S. Zhong, N. Bu, R. Zhou, W. Jin, M. Yu and S. Li, J. Membr. Sci., 2016, 520, 507–514 CrossRef.
- Z. Zong, S. K. Elsaidi, P. K. Thallapally and M. A. Carreon, Ind. Eng. Chem. Res., 2017, 56, 4113–4118 CrossRef.
- Z. Zong and M. A. Carreon, J. Membr. Sci., 2017, 524, 117–123 CrossRef.
- A. H. Fuchs and A. K. Cheetham, J. Phys. Chem. B, 2001, 105, 7375–7383 CrossRef.
- B. Smit and T. L. M. Maesen, Chem. Rev., 2008, 108, 4125–4184 CrossRef PubMed.
- V. Van Speybroeck, K. Hemelsoet, L. Joos, M. Waroquier, R. G. Bell and C. R. A. Catlow, Chem. Soc. Rev., 2015, 44, 7044–7111 RSC.
- T. J. Grey, K. P. Travis, J. D. Gale and D. Nicholson, Microporous Mesoporous Mater., 2001, 48, 203–209 CrossRef.
- R. Krishna and J. M. van Baten, Chem. Eng. J., 2007, 133, 121–131 CrossRef.
- E. García-Pérez, J. B. Parra, C. O. Ania, A. García-Sánchez, J. M. van Baten, R. Krishna, D. Dubbeldam and S. Calero, Adsorption, 2007, 13, 469–476 CrossRef.
- R. Krishna and J. M. van Baten, J. Membr. Sci., 2010, 360, 323–333 CrossRef.
- G. Sethia, R. S. Pillai, G. P. Dangi, R. S. Somani, H. C. Bajaj and R. V. Jasra, Ind. Eng. Chem. Res., 2010, 49, 2353–2362 CrossRef.
- R. S. Pillai, G. Sethia and R. V. Jasra, Ind. Eng. Chem. Res., 2010, 49, 5816–5825 CrossRef.
- N. E. R. Zimmermann, M. Haranczyk, M. Sharma, B. Liu, B. Smit and F. J. Keil, Mol. Simul., 2011, 37, 986–989 CrossRef.
- É. Csányi, Z. Ható and T. Kristóf, J. Mol. Model., 2012, 18, 2349–2356 CrossRef PubMed.
- J. Kim, M. Abouelnasr, L.-C. Lin and B. Smit, J. Am. Chem. Soc., 2013, 135, 7545–7552 CrossRef PubMed.
- M. Rahmati and H. Modarress, Microporous Mesoporous Mater., 2013, 176, 168–177 CrossRef.
- C. M. Simon, J. Kim, L.-C. Lin, R. L. Martin, M. Haranczyk and B. Smit, Phys. Chem. Chem. Phys., 2014, 16, 5499–5513 RSC.
- P. Gómez-Álvarez, S. Hamad, M. Haranczyk, A. R. Ruiz-Salvador and S. Calero, Dalton Trans., 2016, 45, 216–225 RSC.
- R. F. Cracknell and K. E. Gubbins, J. Mol. Liq., 1992, 54, 239–251 CrossRef.
- A. Boutin, R. J. M. Pellenq and D. Nicholson, Chem. Phys. Lett., 1994, 219, 484–490 CrossRef.
- V. Lachet, A. Boutin, R. J. M. Pellenq, D. Nicholson and A. H. Fuchs, J. Phys. Chem., 1996, 100, 9006–9013 CrossRef.
- T. Maris, T. J. H. Vlugt and B. Smit, J. Phys. Chem. B, 1998, 102, 7183–7189 CrossRef.
- C. A. Koh, T. Montanari, R. I. Nooney, S. F. Tahir and R. E. Westacott, Langmuir, 1999, 15, 6043–6049 CrossRef.
- P. Adhangale and D. Keffer, Langmuir, 2002, 18, 10455–10461 CrossRef.
- I. Deroche, L. Gaberova, G. Maurin, P. Llewellyn, M. Castro and P. Wright, Adsorption, 2008, 14, 207–213 CrossRef.
- I. Deroche, L. Gaberova, G. Maurin, M. Castro, P. A. Wright and P. L. Llewellyn, J. Phys. Chem. C, 2008, 112, 5048–5056 Search PubMed.
- M. Fischer, Phys. Chem. Chem. Phys., 2017, 19, 22801–22812 RSC.
- M. Kacem, M. Pellerano and A. Delebarre, Fuel Process. Technol., 2015, 138, 271–283 CrossRef.
- A. Turrina, R. Garcia, P. A. Cox, J. L. Casci and P. A. Wright, Chem. Mater., 2016, 28, 4998–5012 CrossRef.
- A. Turrina, R. Garcia, A. E. Watts, H. F. Greer, J. Bradley, W. Zhou, P. A. Cox, M. D. Shannon, A. Mayoral, J. L. Casci and P. A. Wright, Chem. Mater., 2017, 29, 2180–2190 CrossRef.
- M. Fischer, F. O. Evers, F. Formalik and A. Olejniczak, Theor. Chem. Acc., 2016, 135, 257 CrossRef.
- M. Fischer and R. J. Angel, J. Chem. Phys., 2017, 146, 174111 CrossRef PubMed.
- S. J. Clark, M. D. Segall, C. J. Pickard, P. J. Hasnip, M. I. J. Probert, K. Refson and M. C. Payne, Z. Kristallogr., 2005, 220, 567–570 Search PubMed.
- J. P. Perdew, K. Burke and M. Ernzerhof, Phys. Rev. Lett., 1996, 77, 3865–3868 CrossRef PubMed.
- A. Tkatchenko and M. Scheffler, Phys. Rev. Lett., 2009, 102, 73005 CrossRef PubMed.
- J. J. Potoff and J. I. Siepmann, AIChE J., 2001, 47, 1676–1682 CrossRef.
- W. L. Jorgensen, D. S. Maxwell and J. Tirado-Rives, J. Am. Chem. Soc., 1996, 118, 11225–11236 CrossRef.
- B. Chen and J. I. Siepmann, J. Phys. Chem. B, 1999, 103, 5370–5379 CrossRef.
- X. Sun, C. D. Wick, P. K. Thallapally, B. P. McGrail and L. X. Dang, Chem. Phys. Lett., 2011, 501, 455–460 CrossRef.
- A. A. Sizova, V. V. Sizov and E. N. Brodskaya, Colloids Surf., A, 2015, 474, 76–84 CrossRef.
- C. Campaná, B. Mussard and T. K. Woo, J. Chem. Theory Comput., 2009, 5, 2866–2878 CrossRef PubMed.
- M. Fischer and R. G. Bell, J. Phys. Chem. C, 2012, 116, 26449–26463 Search PubMed.
- N. Rosenbach, A. Ghoufi, I. Déroche, P. L. Llewellyn, T. Devic, S. Bourrelly, C. Serre, G. Férey and G. Maurin, Phys. Chem. Chem. Phys., 2010, 12, 6428–6437 RSC.
- M. Jorge, M. Fischer, J. R. B. Gomes, C. Siquet, J. C. Santos and A. E. Rodrigues, Ind. Eng. Chem. Res., 2014, 53, 15475–15487 CrossRef.
- M. Fischer and R. G. Bell, J. Phys. Chem. C, 2013, 117, 17099–17110 Search PubMed.
- M. C. Campo, A. M. Ribeiro, A. F. P. Ferreira, J. C. Santos, C. Lutz, J. M. Loureiro and A. E. Rodrigues, Fuel Process. Technol., 2016, 143, 185–194 CrossRef.
- J.-L. Paillaud, B. Marler and H. Kessler, Chem. Commun., 1996, 1293–1294 RSC.
- S. T. Wilson, B. M. Lok, C. A. Messina, T. R. Cannan and E. M. Flanigen, J. Am. Chem. Soc., 1982, 104, 1146–1147 CrossRef.
- E. R. Parnham and R. E. Morris, J. Am. Chem. Soc., 2006, 128, 2204–2205 CrossRef PubMed.
- S. T. Wilson, Stud. Surf. Sci. Catal., 2001, 137, 229–260 CrossRef.
- M. Castro, R. Garcia, S. J. Warrender, A. M. Z. Slawin, P. A. Wright, P. A. Cox, A. Fecant, C. Mellot-Draznieks and N. Bats, Chem. Commun., 2007, 8, 3470–3472 RSC.
- V. Patinec, P. A. Wright, R. A. Aitken, P. Lightfoot, S. D. J. Purdie, P. A. Cox, Å. Kvick and G. Vaughan, Chem. Mater., 1999, 11, 2456–2462 CrossRef.
- A. Krajnc, J. Varlec, M. Mazaj, A. Ristić, N. Z. Logar and G. Mali, Adv. Energy Mater., 2017, 7, 1601815 CrossRef.
- A. K. Sinha, S. G. Hegde, N. E. Jacob and S. Sivasanker, Zeolites, 1997, 18, 350–355 CrossRef.
- Q. Liu, N. C. O. Cheung, A. E. Garcia-Bennett and N. Hedin, ChemSusChem, 2011, 4, 91–97 CrossRef PubMed.
- Z. Liu, X. Song, J. Li, Y. Li, J. Yu and R. Xu, Inorg. Chem., 2012, 51, 1969–1974 CrossRef PubMed.
- S. Rege and R. Yang, Sep. Sci. Technol., 2001, 36, 3355–3365 CrossRef.
- Y.-S. Bae and R. Q. Snurr, Angew. Chem., Int. Ed., 2011, 50, 11586–11596 CrossRef PubMed.
Footnote |
| † Electronic supplementary information (ESI) available. See DOI: 10.1039/c8se00173a |
| This journal is © The Royal Society of Chemistry 2018 |