Impact of the addition of poly-dihydrogen ruthenium precursor complexes on the hydrogen storage properties of the Mg/MgH2 system†
Basile
Galey
 a,
Aline
Auroux
 a,
Sylviane
Sabo-Etienne
 *b,
Mary
Grellier
 b,
Sameh
Dhaher
b and
Georgeta
Postole
 *a
*a
aUniversité Lyon 1, CNRS, UMR 5256, IRCELYON, Institut de Recherches sur la Catalyse et l'environnement de Lyon, 2 Avenue Albert Einstein, F-69626 Villeurbanne, France. E-mail: georgeta.postole@ircelyon.univ-lyon1.fr
bLCC-CNRS, Université de Toulouse, CNRS, UPS, 205 Route de Narbonne, BP 44099, F-31077 Toulouse Cedex 4, France. E-mail: sylviane.sabo@lcc-toulouse.fr
First published on 3rd August 2018
Abstract
In order to improve the hydrogen storage properties of magnesium hydride, poly-dihydrogen ruthenium complexes have been synthesized in powder form and added to commercial MgH2 by mechanically ball milling (5 h under argon). To reveal the influence of the complexes on the hydrogen absorption/desorption kinetics of the Mg/MgH2 system, microstructural characterization of the prepared mixtures was performed by XRD, SEM, TEM-EDX, NMR and XPS and the hydrogen storage properties measured by TPD, DSC and PCT. The complexes used as additives are precursors to the active species and exhibit two different impacts on MgH2. First, during milling, the resulting coating at the surface of the MgH2 particles prevents the aggregation of the powder. This leads, when compared with pure milled MgH2, to an important reduction of the hydrogen desorption temperature (74 °C) and apparent activation energy of MgH2 decomposition (30%) with the addition of only 5 wt% of the complexes. Second, during sorption cycling, the ruthenium dispersed at the surface of the MgH2 particles greatly impacts the hydriding rates. The hydrogen absorption kinetics of the prepared mixtures, which are able to absorb 6.0 wt% of hydrogen at 200 °C in less than 5 min, are significantly improved in comparison with those of the pure milled sample.
1. Introduction
Because of the collective awareness of the impact of fossil resources on global warming and the increasing worldwide demand, new technologies are needed to produce energy with less greenhouse gas emission.1 Renewable sources such as sun and wind are very promising for producing environmentally friendly power but suffer from their fluctuating and intermittent nature. To globalize their utilization, improvement in energy storage and transportation technologies is essential. Batteries, compressed air, flywheels and capacitors can be used locally for short-term purposes but for the long-term storage of electricity a new energy vector is necessary.2Hydrogen has been identified as a promising clean and renewable energy carrier for the future; it is one of the most abundant elements in the Universe, the lightest fuel and it can be easily and efficiently converted into electricity.3 The amount of energy per mass unit of hydrogen is about three times higher than the energy density of petroleum. The ideal combination is to use renewable sources of electricity to produce hydrogen, for example by electrolysis. Fuel cells can then generate electricity back from hydrogen, leaving water vapour as the only exhaust gas. A reliable and secure way to store hydrogen is therefore essential for the expansion of its utilization as an attractive alternative to fossil fuels for both mobile and stationary applications.4
Hydrogen can be stored as (i) pressurized gas, (ii) cryogenic liquid and (iii) solid fuel (by absorption as chemical compounds or by adsorption on carbon materials). For mobile applications, the ideal storage system should be a light-weight material able to store hydrogen in a compact and safe manner.5 The targets given by the DOE for solid-state materials are (i) reversible storage capacity of at least 5.5 wt%, (ii) desorption temperature of 60–120 °C, (iii) low cost and (iv) low toxicity.6 Chemical materials that can reversibly absorb hydrogen by means of chemical reactions are the most suitable to reach these targets.7 Among them, light metals such as magnesium are a promising and safe option. Magnesium has the advantage of being abundant on the Earth, relatively cheap to extract and non-toxic. The metal reacts with hydrogen to form magnesium hydride (MgH2) which has a high reversible storage capacity of 7.65 wt%.8 However, the use of the Mg/MgH2 system at the industrial scale is limited by its high thermal stability, slow hydrogen absorption/desorption kinetics and high reactivity towards air and oxygen. The approaches explored to overcome the drawbacks of MgH2 include transition metal addition,9–17 surface and structural modification18–21 and composite formation with some catalytic components and other hydrogen storage alloys.22–27
Several reviews28–32 summarize the recent developments on Mg-based materials and their hydrogen-storage capacity, kinetics, cyclic behaviour and toxicity. Important advances have been made by using nano-structured magnesium hydride with additives to accelerate the dehydrogenation process. Temperatures of H2 release between 200 and 350 °C and hydrogen-storage capacities from 2.7 up to 7.6 wt% have been reported for different developed Mg-based materials.33 In spite of these promising results, the progress made to date is not enough to meet the requirements for practical applications such as transportation and low temperature fuel cells. Further research work is thus needed and the present study is part of a search for catalysts for addition to MgH2 to overcome the limitations.
In the general area of metal hydrides there is one specific class of complexes which deserves special attention. Indeed, dihydrogen can coordinate transition metal centres without H–H bond breaking, forming the so-called dihydrogen complexes in which dihydrogen becomes a ligand characterized by a three-centre-two-electron interaction.34 With respect to the problem of hydrogen storage, dihydrogen complexes might represent an ideal class of compounds in terms of binding strength, midway between metal hydrides and physisorption.35 For this reason, they might be ideal candidates for hydrogen storage systems designed for room or close to room temperature applications.34–37
Since the pioneering work by Kubas, many dihydrogen complexes have been produced and studied. Complexes bearing the largest amount of η2-dihydrogen coordinated at the molecular level are highly desirable to maintain good weight storage capacity for incorporation into hydrogen storage materials. So far, numerous complexes incorporating one dihydrogen ligand into the coordination sphere of a metal have been prepared but only few having two dihydrogen ligands can be handled under normal conditions of temperature and pressure.38,39
The use of two bis-dihydrogen ruthenium complexes as doping agents for MgH2 is reported for the first time in the present study. It is expected that these complexes will lower the desorption temperature and that the kinetic parameters of the hydrogenation/dehydrogenation process could be improved. These two complexes feature six hydrogen atoms around the metal centre: two as terminal hydrides and two dihydrogen ligands. The first additive used is the bis-dihydrogen complex stabilized by two tricyclohexylphosphine ligands [RuH2(H2)2(PCy3)2],40 while the second is stabilized by two tricyclopentylphosphines [RuH2(H2)2(PCyp3)2].41 In solution, these two complexes can undergo easy and reversible hydrogen release processes.42–44 Indeed, hydrogen thermal release from RuH2(H2)2(PCy3)2 solutions was reported to occur at a temperature of around 87 °C,45 while only ambient temperature is needed for solutions of RuH2(H2)2(PCyp3)2 to start losing H2.41 In the solid state, their behaviour is also quite different, the tricyclohexylphosphine complex46 being much more stable than the analogous tricyclopentylphosphine complex which needs to be kept at low temperatures for storage over long periods.
The main objective of this work is to evaluate the impact of the bis-dihydrogen ruthenium complex addition on the hydrogen storage properties of magnesium hydride. The mixtures “MgH2 + bis-dihydrogen ruthenium complexes” were prepared by grinding in a planetary ball mill under an inert atmosphere. The fractions of additives were small (5 to 20 wt%) in order to increase hydrogenation/dehydrogenation rates without critically decreasing the hydrogen storage capacity. Changes in the microstructure and hydrogen sorption properties of the prepared mixtures were studied in detail.
2. Experimental
2.1 Materials
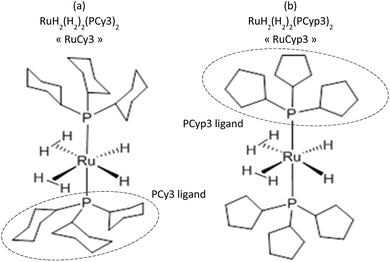
To prevent the oxidation, all the handlings were performed in a glovebox under a protective argon atmosphere. The magnesium hydride powder used in this research was provided by McPhy Company (La Motte-Fanjas, France). The sample used as received is denoted as c-MgH2. The synthesis of the tricyclohexylphosphine ruthenium (Fig. 1a) and tricyclopentylphosphine ruthenium (Fig. 1b) complexes, namely RuCy3 and RuCyp3 here, respectively, was described previously.40,41All “MgH2 + complex” mixtures were prepared by planetary ball milling using a PM100 apparatus from Retsch under an inert argon atmosphere. The milling bowl was hermetically closed inside the glovebox to prevent any oxidation of the powders. The mixtures of MgH2 and complexes were milled for 5 h using balls in zirconium dioxide of 1 mm diameter and a milling frequency of 300 revolutions per minute. The ball to powder mass ratio was 100![[thin space (1/6-em)]](https://www.rsc.org/images/entities/char_2009.gif) :
:![[thin space (1/6-em)]](https://www.rsc.org/images/entities/char_2009.gif) 1. The rotation of the ball in the mill was paused every 2 min and inverted every 5 min to limit the temperature increase in the milling cell. For comparison, MgH2 was milled under the same conditions without any additive and the obtained powder is denoted as m-MgH2.
1. The rotation of the ball in the mill was paused every 2 min and inverted every 5 min to limit the temperature increase in the milling cell. For comparison, MgH2 was milled under the same conditions without any additive and the obtained powder is denoted as m-MgH2.
Two different amounts (5 and 10 wt%) of RuCyp3 were added before milling to the commercial MgH2. For RuCy3, mixtures with 5 and 20 wt% of the complex were prepared. The obtained composites were labelled in relation to the complex used as the additive and its amount as follows: 5-RuCyp3 and 10-RuCyp3 for MgH2 milled with 5 and 10 wt% of RuCyp3, respectively, 5-RuCy3 and 20-RuCy3 for the mixtures MgH2–RuCy3. Due to the highest amount of RuCy3 in the 20-RuCy3 mixture, this sample was used to investigate the complex structure before and after the hydrogen desorption step. For a better understanding of how the complexes can impact the desorption kinetics of MgH2, a sample of MgH2 doped with 0.75 wt% of ruthenium nanoparticles from Sigma-Aldrich (Ru–MgH2) was prepared. The amount of nanoparticles corresponds to the amount of ruthenium present in 5 wt% of the RuCy3 complex. This experiment should help to clarify whether it is the complex or just the ruthenium in the complex that impacts the decomposition of MgH2.
2.2 Characterization
The powders were characterized by thermogravimetric measurements (TGA), X-ray diffraction (XRD), scanning electron (SEM) and transmission electron (TEM-EDX) microscopy, and X-ray photoelectron (XPS) and nuclear magnetic resonance (solid state NMR) spectroscopy. The details of the apparatus and procedures are available in the ESI.†2.3 Storage properties
The hydrogen desorption properties of the samples were studied by Temperature Programmed Desorption (TPD) with a TPD/R/O-1100 apparatus from Thermo. The analyses were performed from ambient temperature to 450 °C under an argon flow of 20 mL min−1 and at a heating rate of 2 °C min−1. The quartz tube and reactor were hermetically closed in the glovebox, which prevented the samples from being oxidized during preparation. A calibration curve obtained from the reduction of different masses of copper(II) oxide was used to determine the amount of hydrogen desorbed by the samples.Calorimetric measurements were performed with a DSC Q100 from TA Instruments by using hermetic aluminium pans with a pin hole, sealed inside the glovebox. The measurements were carried out under a flow of high-purity argon (40 mL min−1) at different heating rates of 2, 5, 7.5 and 10 °C min−1 from room temperature to 450 °C. The activation energy of the samples was determined using Kissinger's method as described in the ESI (eqn (S1)†).47,48
The thermodynamic properties of the samples were determined by PCT analysis with an HVPA-200 Sievert's apparatus from Micromeritics. Hydrogen absorption/desorption isotherms were recorded at 300, 330 and 350 °C. Formation enthalpies and entropies of both absorption and desorption were calculated using the Van't Hoff method (see the ESI, eqn (S2)†).49–51 The apparatus was also used to study the absorption kinetics of the samples. The absorptions were performed at 200 and 325 °C under 30 bar H2.
Finally, in order to study the reversibility, hydrogen absorption/desorption cycles were performed. The absorptions were conducted under 30 bar H2 at 325 °C and the desorptions at 300 °C under vacuum. In parallel, the hydrogen desorption was also followed by TPD analyses from ambient temperature to 450 °C (2 °C min−1). The results for the samples just after milling and after 1 absorption/desorption cycle were compared.
3. Results and discussion
3.1 Thermal stability of the complexes
Fig. 2 presents the results of thermogravimetric analysis of the RuCy3 and RuCyp3 complexes used as additives to MgH2. Mass loss and DTG signals are presented as a function of temperature. The RuCy3 complex starts to decompose at 120 °C in three major steps at 139, 212 and 289 °C. The RuCyp3 complex shows a similar profile of decomposition which starts also around 120 °C and takes place over three stages with the maximum weight loss at 139, 171 and 217 °C. The last two decomposition steps are observed at lower temperatures than for RuCy3. At 450 °C, both complexes are decomposed at 67 wt% and only ruthenium and a few carbon structures are remaining.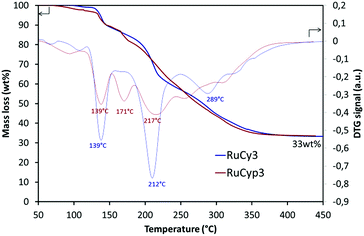 | ||
| Fig. 2 Thermogravimetric analysis results: mass loss and DTG signal of the complexes heated under argon to 450 °C at 2 °C min−1. | ||
3.2 Microstructural characterization: XRD, SEM, TEM-EDX, NMR and XPS analysis
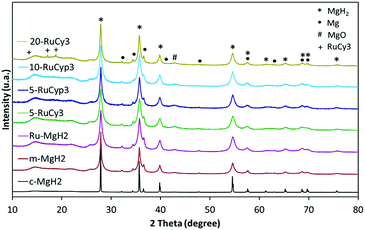
Fig. 3 presents the XRD patterns of the prepared samples. No new phase formation is observed after ball-milling. The samples are mostly composed of magnesium hydride but traces of metallic magnesium and magnesium oxide are also detected in all milled powders as well as in c-MgH2. The amount of ruthenium in the mixtures is expected to be close to that in the complexes used (0.76, 0.86, 1.73 and 3.04 wt% for 5-RuCy3, 5-RuCyp3, 10-RuCyp3 and 20-RuCy3, respectively) taking into account the ball milling method of preparation. The absence of diffraction peaks characteristic of ruthenium could be due to the low amount of ruthenium and to its homogeneous dispersion on the MgH2 surface. For 20-RuCy3, peaks corresponding to carbon species are noticed at 13.6, 17.1 and 18.8°, unfortunately in the same range as that of the Kapton foil (used to protect the sample from oxidation).The mean size of the MgH2 crystallites was determined by the Rietveld method and the results are shown in Table 1. 5 h of milling significantly reduces the mean MgH2 crystallite size from about 213 to 34 nm. When the complexes are added, the milling is even more effective with the mean particle size decreasing to around 15 nm. The difference observed with m-MgH2 could be explained by a limitation of the powder aggregation in the presence of the complexes. They may reduce the cold welding of the particles during milling and prevent further aggregation after milling.
| Samples | Mean crystal size (nm) |
|---|---|
| 20-RuCy3 | 23 ± 5 |
| 10-RuCyp3 | 12 ± 7 |
| 5-RuCyp3 | 20 ± 3 |
| 5-RuCy3 | 14 ± 6 |
| Ru–MgH2 | 16 ± 5 |
| m-MgH2 | 34 ± 13 |
| c-MgH2 | 213 ± 19 |
Addition of ruthenium nanoparticles to MgH2 (see the Ru–MgH2 sample in Table 1) also reduces the mean crystallite size of magnesium hydride in comparison with m-MgH2, probably because of ductility differences between ruthenium nanoparticles and MgH2.20
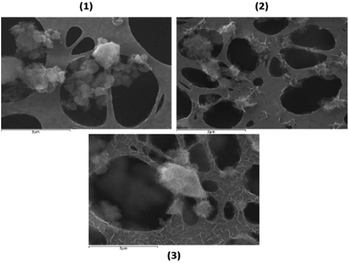
The microstructure and morphology of the samples were studied by SEM. Fig. 4 shows the SEM images of milled MgH2 and MgH2 doped with 5 wt% of RuCy3 and RuCyp3 complexes, respectively. The micrographs show a heterogeneous MgH2 particle size distribution for the three samples with a mean particle size of 0.65, 0.36 and 0.40 μm for m-MgH2, 5-RuCy3 and 5-RuCyp3, respectively.
The largest particles are mostly aggregates of smaller ones. As also observed by XRD analysis, the mean particle size in the samples with complexes is around two times smaller than that in m-MgH2. Fig. S1† compares the MgH2 particle size distribution within the three samples. Powders doped with RuCy3 and RuCyp3 show a homogeneous dispersion of the complexes and fewer aggregates could be observed in comparison with the m-MgH2 sample. Furthermore, a coating shell surrounding the MgH2 particles milled with the bis-dihydrogen complexes appears, modifying the morphology. No major visual differences could be noticed when using RuCy3 or RuCyp3 complexes.
The composition of the 5-RuCy3 mixture was investigated by TEM-EDX (Fig. S2†). In addition to magnesium and ruthenium, oxygen is present in the EDX spectrum as a result of the EDX experimental conditions together with the presence of some MgO in the starting c-MgH2 sample, as observed by XRD. The amount of ruthenium determined by EDX (0.64 wt%) is close to that of 5 wt% of the RuCy3 complex (0.76 wt%). The presence of the different elements of the complex in freshly prepared MgH2-based mixtures is also confirmed by XPS analysis (Fig. S3†): ruthenium, phosphorus, carbon, oxygen and magnesium are detected.
To further investigate the complex structure after milling with MgH2, 13C and 31P solid-state NMR experiments were performed. Fig. S4† displays the main spectroscopic features of 20-RuCy3 (just after milling) and, for comparison, those of the RuCy3 complex and free PCy3. In 20-RuCy3, the main signal detected appears in the same region as the resonance for free PCy3. Similar behavior is expected for all samples doped with different amounts of the complexes. It is difficult to determine the exact nature of the coating shell surrounding the MgH2 particles. Most likely, free PCy3 (or PCyp3) is still present together with transformed ruthenium species resulting from partial elimination of benzene as previously reported46 in the case of RuCy3 (or with cyclopentadienyl species in the case of RuCyp3). Nevertheless, the analyses indicate that the complexes are precursors to active ruthenium nanoparticle/phosphine derived species that have been dispersed on the storage material surface during milling.
3.3 Impact of the bis-dihydrogen ruthenium precursor complexes on the hydrogen desorption properties of MgH2
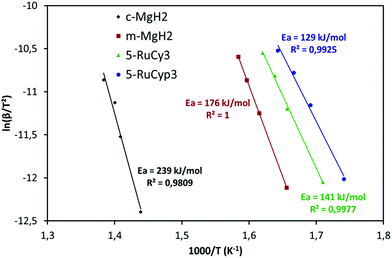
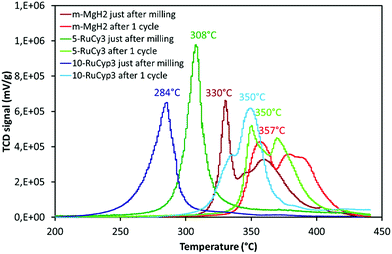
The impact of the bis-dihydrogen ruthenium precursor complexes on MgH2 decomposition was studied by TPD analysis (Fig. 5 and Table 2). Fig. 5 displays the TPD plots while the evolution of the amount of hydrogen desorbed as a function of temperature is given in Fig. S5.† In Table 2, the onset and desorption peak maximum temperatures as well as the amount of hydrogen desorbed (the contribution of the decomposition of the complexes is negligible, Fig. S6†) are summarized together with the apparent activation energy of MgH2 decomposition. To calculate the apparent activation energy of hydrogen desorption in the samples, DSC analyses were performed at different heating rates (Fig. S7†). The activation energy values were determined using Kissinger's method and the resultant Kissinger plots are shown in Fig. 6.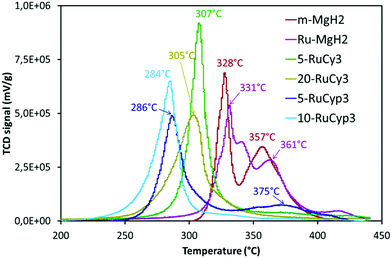 | ||
| Fig. 5 Temperature programmed desorption profiles of MgH2 milled with and without the complexes. Experiments performed under argon from ambient temperature to 450 °C with heating at 2 °C min−1. | ||
| Samples | TPD | DSC | |||
|---|---|---|---|---|---|
| Onset temperature (°C) | Peak temperature (°C) | Hydrogen releaseda (wt%) | Normalized hydrogen releasedb (wt%) | Activation energy (kJ per mol H2) | |
| a g H2/gsample. b g H2/gMgH2. c Not determined. The apparent activation energy of the Ru–MgH2 sample is supposed to be the same as that of m-MgH2. | |||||
| c-MgH2 | 393 | 419 | 7.0 | 7.7 | 239 |
| m-MgH2 | 310 | 328–357 | 6.8 | 7.5 | 176 |
| Ru–MgH2 | 292 | 331–361 | 6.8 | 7.6 | n.d.c |
| 5-RuCy3 | 279 | 307 | 6.4 | 7.5 | 141 |
| 20-RuCy3 | 255 | 305 | 5.3 | 7.5 | 140 |
| 5-RuCyp3 | 260 | 286–375 | 6.4 | 7.4 | 129 |
| 10-RuCyp3 | 236 | 284 | 6.0 | 7.4 | 131 |
The obtained experimental data show that at a heating rate of 2 °C min−1, milled MgH2 releases 6.8 wt% of hydrogen in a two-step process between 300 and 400 °C. Such behaviour is the result of a large MgH2 particle size distribution within the sample (see Fig. S1†). The amount of hydrogen evolved is lower than that for the c-MgH2 sample probably due to partial decomposition of MgH2 during ball-milling. Yet an important decrease in the desorption temperature and apparent activation energy can be noticed, because of the decreasing particle size.18–21
Addition of ruthenium nanoparticles to MgH2 does not have a significant influence on hydrogen desorption temperature. The Ru–MgH2 and m-MgH2 TPD curves display similar profiles in terms of peak shape and temperature range with the same amount of hydrogen released. The absence of a noticeable kinetic impact by the addition of ruthenium nanoparticles can be the result of a partial oxidation of Ru despite the well-controlled experimental conditions.
The samples doped with complexes 5-RuCy3, 20-RuCy3, 5-RuCyp3 and 10-RuCyp3 show an important decrease of the decomposition temperature and apparent activation energy in comparison with pure milled MgH2. In particular, 10-RuCyp3 displays the lowest onset desorption temperature among all samples and starts to release hydrogen at 236 °C, which is more than 150 °C lower than the onset of commercial MgH2 decomposition (393 °C) and 74 °C lower than that of pure-milled MgH2 (310 °C). The TPD peaks are thinner and show only one desorption step as the size distribution of the MgH2 particles is monomodal (see Fig. S1†) in the mixture with the complexes. It thus confirms the expected positive impact of the ruthenium precursor complexes on cold welding reduction in the powder during milling and on aggregation after milling. The amounts of hydrogen desorbed from MgH2 co-milled with complexes are 6.4 wt% for both 5-RuCy3 and 5-RuCyp3 mixtures, and 6.0 and 5.3 wt% for 10-RuCyp3 and 20-RuCy3, respectively.
The microstructural characterization of the different “MgH2 + ruthenium precursor complex” mixtures does not show major differences between the samples. The sizes of the particles and crystallites are almost the same and both ruthenium precursor complexes produce a coating around MgH2. However, the hydrogen desorption properties of the resulting mixtures are different. The apparent activation energies of the samples doped with the RuCyp3 complex are found to be 10% lower than that of the mixture with RuCy3. It is important to notice that, as shown in Fig. 5, the TPD curve of the 5-RuCyp3 sample presents two decomposition peaks at 286 and 375 °C while only one is remaining when 10 wt% is used, at 284 °C. It seems that when using RuCyp3, a higher amount of the complex is needed in order to obtain a homogeneous mixture. For RuCy3, only 5 wt% is needed to have a single and thin desorption peak but this peak is shifted to a higher temperature of 307 °C. Indeed, when the quantity of RuCy3 is increased from 5 to 20 wt%, the apparent activation energy remains constant and hydrogen is released at a similar temperature with an important decrease of the storage capacity for 20-RuCy3 in comparison with 5-RuCy3.
These differences suggest that the limitation of aggregation is not the only impact of the ruthenium precursor complexes. Indeed, they also have a catalytic effect on hydrogen desorption and this second effect is higher with the PCyp3 ligand type complex. However it is difficult to non-ambiguously identify the origin of these differences, i.e. the dispersion of the ruthenium at the surface of MgH2 particles or the influence of the ligands from the complexes. The major differences between the two ruthenium precursor complexes are the type of ligands (PCy3 or PCyp3) and the temperature of the coordinated dihydrogen release. The complex with PCyp3 ligands desorbs the two coordinated dihydrogen molecules at ambient temperature while the other complex desorbs them at temperatures higher than 60 °C. RuCyp3 is therefore more reactive than RuCy3 as also previously observed in catalysis,41,52 and this is confirmed here by the faster hydrogen desorption when using it as an additive to MgH2. Being more sensitive to an increase of temperature during milling, PCyp3 ligands may undergo a partial denaturation during sample preparation. This could explain why 10 wt% of RuCyp3 instead of only 5 wt% of the RuCy3 complex is needed to obtain a single and sharp hydrogen desorption peak. It was reported14,21 that phosphorus can act as a catalyst for MgH2 decomposition when combined with nickel nanoparticles. The partial decomposition of RuCyp3 during milling may therefore lead to easier interactions between MgH2 and P in comparison with the RuCy3 complex, thus enhancing the hydrogen desorption properties of MgH2 and explaining the difference of desorption temperature observed in Fig. 5.
Table 3 compares the desorption temperature, storage capacity and activation energy of 5-RuCyp3 with data obtained from the literature. Transition metal (TM) complexes9 or carbon-coated transition metals11–13 were targeted for comparison. The reported hydrogen storage properties were also compared with TM nanoparticles.10,16 No major differences can be noticed between the hydrogen desorption properties of 5-RuCyp3 and those of MgH2 doped with transition metal complexes or carbon-coated TM. The peak desorption temperature and storage capacity are in the same range. The activation energies are in the same order of magnitude, although being dependent on the analysis conditions48 the obtained values are more difficult to compare. It is an interesting result considering that ruthenium is not known for enhancing the desorption kinetics of MgH2![[thin space (1/6-em)]](https://www.rsc.org/images/entities/char_2009.gif) 53 as much as nickel, cobalt or iron. Using pure nickel or iron nanoparticles gives better results mostly because the amount of catalytically active phase present in these samples is higher and/or more accessible than for example when the TMs are carbon-coated or bonded to organic ligands (5 wt% of Fe10 against about 0.8 wt% of Ru in this work). In addition, MgH2 samples with nanoparticle addition present poor cycling stability due to particles aggregation during absorption/desorption runs.16 In comparison, the cycling stability of MgH2 doped with carbon-coated TM is reported to be good after several cycles.11–13
53 as much as nickel, cobalt or iron. Using pure nickel or iron nanoparticles gives better results mostly because the amount of catalytically active phase present in these samples is higher and/or more accessible than for example when the TMs are carbon-coated or bonded to organic ligands (5 wt% of Fe10 against about 0.8 wt% of Ru in this work). In addition, MgH2 samples with nanoparticle addition present poor cycling stability due to particles aggregation during absorption/desorption runs.16 In comparison, the cycling stability of MgH2 doped with carbon-coated TM is reported to be good after several cycles.11–13
| Activation energya (kJ per mol H2) | Storage capacity (wt%) | Peak desorption temperatureb (°C) | Additive used | Reference |
|---|---|---|---|---|
| a Apparent activation energy for dehydrogenation given by DSC analysis. b Obtained by thermal analysis at 2 °C min−1. | ||||
| 129 | 6.4 | 286 | 5 wt% RuCyp3 | This paper |
| 110 | 6.7 | 275 | 10 wt% Ni(C5H5)2 | 9 |
| 100 | 6.5 | 288 | 5 wt% Ni3N@NC | 11 |
| 103 | 6.5 | 283 | 5 wt% Ni@C | 12 |
| 115 | 6.1 | 292 | 10 wt% Co@C | 13 |
| 74 | 6.3 | 215 | 5 wt% n-Fe | 10 |
| 94 | 6.5 | 200 | 2% mol Ninano | 16 |
Kumar et al.9 reported that a nickel complex used as an additive decomposes during ball milling with MgH2 and, consequently, the significant kinetic impact comes only from the dispersed nickel within the sample. To our knowledge, no information about the stability of the sample after absorption/desorption cycles was reported. The results obtained so far in this work show that the shell obtained after milling enhances the hydrogen desorption kinetics of MgH2, especially when the RuCyp3 complex is used as a precursor of the active species. The origin of the positive kinetic impact can be attributed to a synergetic effect of the phosphorus ligands and the homogeneous dispersion of ruthenium species at the surface of MgH2 particles.
3.4 Impact of the dispersed ruthenium species on the hydrogen absorption and desorption properties of MgH2
The sorption cycling measurements were performed by using PCT and TPD devices. Before each experiment, the samples were pre-treated overnight at 300 °C under vacuum for total H2 release. The absorption kinetics were then studied at 325 °C under 30 bar H2 by PCT. After hydrogen absorption experiments, the mixture desorption behaviour was studied by TPD and the results are shown in Fig. 7 and labelled “after 1 cycle”. The data obtained just after milling are also presented for comparison. In Fig. 7, the decompositions of 5-RuCy3 and 10-RuCyp3, showing the best hydrogen release properties, are compared with those of m-MgH2.For all samples, the difference between desorption after milling and after only one absorption/desorption cycle is significant. For example, the decomposition temperature of m-MgH2 after cycling is almost 30 °C higher than that just after milling. A shift between 40 and 66 °C towards higher temperatures is also observed for the hydrogen release from the “MgH2 + ruthenium precursor complex” mixtures. Interestingly, the hydrogen desorption curves in Fig. 7 show no significant differences between m-MgH2 and 5-RuCy3 after 1 sorption cycle. The TPD profiles present similarities in terms of peak shape but are shifted toward higher temperatures for m-MgH2. 10-RuCyp3 powder after 1 cycle presents a TPD curve slightly different from the other samples. The degradation of the hydrogen desorption kinetics after sorption cycling is not as high as for 5-RuCy3.
The changes in the hydrogen release properties after cycling must be related with the changes in the morphology and composition of the storage material. The absence of 13C and 31P signals in the NMR spectra (Fig. S4†) of the “MgH2 + ruthenium precursor complex” mixtures after sorption cycling shows that the organic moieties of the complexes (PCy3 and PCyp3 ligands) have been decomposed, most probably during the pre-treatment step at 300 °C. Without the positive impact of the organic ligands, quite similar hydrogen desorption kinetics are observed in all MgH2-based materials. Ruthenium, although present after cycling in MgH2 doped with ruthenium precursor complex samples (as confirmed by XPS analysis, Fig. S8†), does not show a significant catalytic effect on MgH2 hydrogen desorption. However, the hydrogen release shifts towards slightly lower temperatures for the “MgH2 + ruthenium precursor complex” mixtures can be explained by the presence of ruthenium in different amounts (e.g. 1.7, 0.7 and 0 wt% Ru for 10-RuCyp3, 5-RuCy3 and m-MgH2). It is important to note that, during cycling, ruthenium is expected to be activated as the mixtures were treated under 30 bar hydrogen at 325 °C, a temperature higher than necessary for reduction of ruthenium oxides.54–56
The positive impact of ruthenium remains negligible in comparison with the degradation of the hydrogen release properties observed in the absence of the PCy3 and PCyp3 ligands. This may be related with the aggregation of MgH2 particles during cycling without a protective organic coating. Fig. S9† compares the SEM images of m-MgH2 and 5-RuCy3 just after milling and after sorption cycling. It is clear that MgH2 particles aggregate during cycling and this observation is further confirmed by XRD (Fig. S10 and Table S1†). The crystallite sizes of the “MgH2 + ruthenium precursor complex” mixtures are highly increased after cycling in comparison with those found for freshly milled samples, and are in the same range as m-MgH2 after cycling. The sintering of MgH2 particles during cycling, in the absence of a protective organic coating, can explain the observed degradation of the hydrogen desorption properties. It is actually reported as one of the major limitations of the MgH2 nanostructuration for a high-performing hydrogen storage system.18,30,32,49
Several reviews8,29 reported that the limiting kinetic step for MgH2 decomposition is the nucleation and growth process, while chemisorption and H2 dissociation at the surface of Mg are limiting factors for the hydrogen absorption process. Although no major kinetic enhancement was observed for MgH2 decomposition in the presence of ruthenium, a positive impact on the hydrogen absorption properties of Mg was expected. The presence of Ru sites may allow dissociative adsorption of hydrogen, subsequent migration of hydrogen atoms onto the adjacent Mg surface via spillover and further surface diffusion. The ability of ruthenium to adsorb and dissociate H2 molecules to hydrogen atoms was already reported in the literature when supported on high surface area carbon materials57 or doped to magnesium.54
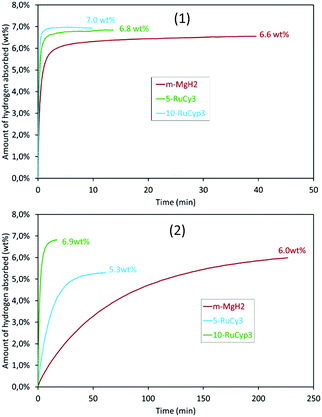
To verify this hypothesis, the hydrogen absorption properties were studied for 5-RuCy3 and 10-RuCyp3 samples and compared with m-MgH2. Fig. 8 presents the isothermal rate of hydrogen absorption at 325 and 200 °C for the three systems. The pure milled MgH2 sample shows relatively slow absorption kinetics at 200 °C. Almost 4 hours is needed to absorb 6.0 wt% of hydrogen. The hydrogen absorption rate increases with temperature and 6.2 wt% of hydrogen is absorbed in 5 min at 325 °C. When ruthenium precursor complexes are added to MgH2, the hydrogen absorption rates increase and the best results are obtained for the 10-RuCyp3 sample. At 325 °C, 10-RuCyp3 absorbs 6.5 wt% of H2 in less than 30 s while 90 s is needed for 5-RuCy3. At 200 °C, the difference is even more visible: 10-RuCyp3 absorbs 5 wt% of H2 in only 3 min, a rate which is 10 times faster than that for 5-RuCy3 and 40 times faster than that for m-MgH2. The difference in absorption rate between 5-RuCy3 and 10-RuCyp3 may arise from the different amounts of ruthenium present in the mixtures: the presence of a larger amount of ruthenium allows higher absorption rates at the temperatures used in this study.
Table 4 compares the absorption properties of the samples with data from the literature. The impact of ruthenium in the 5-RuCy3 mixture is in the same order of magnitude as those reported for carbon-coated TM.11–13 10-RuCyp3 shows absorption rates in the same range as TM nanoparticles such as iron,10 titanium,17 nickel9 or vanadium.17 The ability of ruthenium to act as a hydrogen dissociation source is thus confirmed.
| Absorption conditions | Time to absorb 5 wt% of H2 (min) | Additive used | Reference |
|---|---|---|---|
| 200 °C – 30 bar | 35 | 5 wt% RuCy3 | This paper |
| 200 °C – 30 bar | 3 | 10 wt% RuCyp3 | This paper |
| 200 °C – 20 bar | 40 | 5 wt% Ni3N@NC | 11 |
| 200 °C – 20 bar | 15 | 10 wt% Co@C | 13 |
| 300 °C – 20 bar | 10 | 5 wt% Ni@C | 12 |
| 100 °C – 15 bar | 2 | 10 wt% Ni(C5H5)2 | 9 |
| 20 °C – 20 bar | 35 | 5 wt% n-Fe | 10 |
| 200 °C – 10 bar | 3 | 5 wt% Ti | 17 |
3.5 Impact of the dispersed ruthenium species on the thermodynamic properties
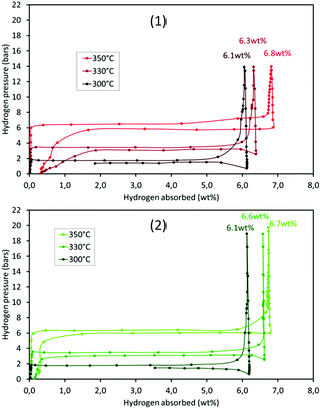
The thermodynamic properties of the samples (pre-treated under vacuum at 300 °C overnight) were determined by PCT analyses. Hydrogen absorption/desorption isotherms were recorded at three different temperatures, 300, 330 and 350 °C. The results for m-MgH2 and 5-RuCy3 are presented in Fig. 9. The absorption and desorption enthalpies and entropies were calculated using the Van't Hoff equation (eqn (S2)†). The Van't Hoff plots are given in Fig. S12† and the obtained values of enthalpy and entropy for absorption and desorption are reported in Table 5.| Samples | ΔH0 (kJ per mol H2) | ΔS0 (kJ per mol H2 per K) | ||
|---|---|---|---|---|
| Absorption | Desorption | Absorption | Desorption | |
| m-MgH2 | −76.4 | −81.9 | −137.6 | −145.7 |
| 5-RuCy3 | −73.6 | −83.3 | −133.1 | −148.2 |
| MgH2 (ref. 32) | −74.7 | −130.0 | ||
No major differences can be noticed when comparing the high pressure volumetric isotherms of m-MgH2 and 5-RuCy3 in Fig. 9. The shape of the curves, the storage capacity and the equilibrium pressures are similar. The calculated enthalpies and entropies are in the same range and are higher for desorption than for absorption for both samples. This difference, often reported in the literature, can be caused by a certain degree of hysteresis, probably because of the observed powder sintering during hydrogen absorption at high temperature.50,51 The obtained results show that dispersed ruthenium has no effect on the thermodynamic parameters of the Mg/MgH2 system and therefore only acts as a catalyst for Mg hydriding (the effect of Ru on MgH2 desorption is present but negligible).
4. Conclusions
The impact of using two bis-dihydrogen ruthenium precursor complexes as doping agents for MgH2 has been reported for the first time. The mixtures were prepared by planetary ball-milling under an argon atmosphere. Microstructural characterisation showed that the ruthenium precursor complexes give rise to a coating on the surface of MgH2 particles during milling. The hydrogen desorption properties of MgH2 with added complexes were enhanced although it was shown that ruthenium did not have a significant impact on the decomposition kinetics. The best results were obtained with the RuCyp3 complex. Indeed, the MgH2 + 10 wt% RuCyp3 mixture starts to release hydrogen at 236 °C and the apparent activation energy of MgH2 decomposition is 30% lower than that with pure milled MgH2.The improved desorption properties of MgH2 were found to be dependent on the thermal stability of the starting complexes. When the organic part of the complexes is decomposed, the hydrogen release properties of MgH2 are no longer enhanced. In contrast, significant improvements were observed in the hydrogen absorption kinetics by addition of the ruthenium precursor complexes. High absorption rates were obtained even after the decomposition of the complexes thanks to ruthenium dispersion within the sample and the spillover effect. For 10-RuCyp3, the absorption rate at 200 °C was found to be 40 times higher than that for pure milled MgH2, and 6.0 wt% of hydrogen was absorbed in less than 5 min.
The results obtained in this study show that mixing precursors such as dihydrogen complexes and metal hydrides such as MgH2 offers promising prospects. By modifying the nature of ligands and/or metal, further reduction of the temperature of hydrogen release could be anticipated, thus approaching a range where reversibility could be feasible.
Conflicts of interest
There are no conflicts to declare.Acknowledgements
This work was supported by the French Agence Nationale de la Recherche [Projet ANR-15-CE29-0023-01]. The authors are thankful for the scientific services of IRCELYON, particularly Y. Aizac for the XRD analyses, L. Burel for the SEM and TEM analyses, C. Lorentz for the NMR analyses and C. Chabanier for the XPS analyses. Dr Y. Coppel is also acknowledged for solid state NMR analyses at LCC. Dr C. Dupuis from McPhy Company is acknowledged for fruitful discussions.Notes and references
- Ş. E. Can Şener, J. L. Sharp and A. Anctil, Renewable Sustainable Energy Rev., 2018, 81, 2335–2342 CrossRef.
- F. Zhang, P. Zhao, M. Niu and J. Maddy, Int. J. Hydrogen Energy, 2016, 41, 14535–14552 CrossRef.
- A. Bakenne, W. Nuttall and N. Kazantzis, Int. J. Hydrogen Energy, 2016, 41, 7744–7753 CrossRef.
- D. J. Durbin and C. Malardier-Jugroot, Int. J. Hydrogen Energy, 2013, 38, 14595–14617 CrossRef.
- J. Ren, N. M. Musyoka, H. W. Langmi, M. Mathe and S. Liao, Int. J. Hydrogen Energy, 2017, 42, 289–311 CrossRef.
- L. E. Klebanoff and J. O. Keller, Int. J. Hydrogen Energy, 2013, 38, 4533–4576 CrossRef.
- N. A. A. Rusman and M. Dahari, Int. J. Hydrogen Energy, 2016, 41, 12108–12126 CrossRef.
- M. Dornheim, S. Doppiu, G. Barkhordarian, U. Boesenberg, T. Klassen, O. Gutfleisch and R. Bormann, Scr. Mater., 2007, 56, 841–846 CrossRef.
- S. Kumar, A. Jain, H. Miyaoka, T. Ichikawa and Y. Kojima, Int. J. Hydrogen Energy, 2017, 42, 17178–17183 CrossRef.
- S. Kumar, A. Singh, G. P. Tiwari, Y. Kojima and V. Kain, Thermochim. Acta, 2017, 652, 103–108 CrossRef.
- Q. Zhang, Y. Wang, L. Zang, X. Chang, L. Jiao, H. Yuan and Y. Wang, J. Alloys Compd., 2017, 703, 381–388 CrossRef.
- L. Li, Z. Zhang, L. Jiao, H. Yuan and Y. Wang, Int. J. Hydrogen Energy, 2016, 41, 18121–18129 CrossRef.
- L. Li, G. Jiang, H. Tian and Y. Wang, Int. J. Hydrogen Energy, 2017, 42, 28464–28472 CrossRef.
- Q. Zhang, L. Zang, Y. Huang, P. Gao, L. Jiao, H. Yuan and Y. Wang, Int. J. Hydrogen Energy, 2017, 42, 24247–24255 CrossRef.
- H. Yu, S. Bennici and A. Auroux, Int. J. Hydrogen Energy, 2014, 39, 11633–11641 CrossRef.
- N. Hanada, T. Ichikawa and H. Fujii, J. Phys. Chem. B, 2005, 109, 7188–7194 CrossRef PubMed.
- G. Liang, J. Huot, S. Boily, A. Van Neste and R. Schulz, J. Alloys Compd., 1999, 292, 247–252 CrossRef.
- N. Hanada, T. Ichikawa, S.-I. Orimo and H. Fujii, J. Alloys Compd., 2004, 366, 269–273 CrossRef.
- B. Paik, I. P. Jones, A. Walton, V. Mann, D. Book and I. R. Harris, J. Alloys Compd., 2010, 492, 515–520 CrossRef.
- B.-H. Chen, Y.-S. Chuang and C.-K. Chen, J. Alloys Compd., 2016, 655, 21–27 CrossRef.
- Q. Zhang, Y. Xu, Y. Wang, H. Zhang, Y. Wang, L. Jiao and H. Yuan, Int. J. Hydrogen Energy, 2016, 41, 17000–17007 CrossRef.
- K. Alsabawi, T. A. Webb, E. M. Gray and C. J. Webb, Int. J. Hydrogen Energy, 2015, 40, 10508–10515 CrossRef.
- H. Y. Sohn and S. Emami, Int. J. Hydrogen Energy, 2011, 36, 8344–8350 CrossRef.
- X. Chen, J. Zou, X. Zeng and W. Ding, J. Alloys Compd., 2017, 701, 208–214 CrossRef.
- L. Xie, J. Li, T. Zhang and H. Kou, Trans. Nonferrous Met. Soc. China, 2017, 27, 569–577 CrossRef.
- Y. Wang, Y. Wang, X. Wang, H. Zhang, L. Jiao and H. Yuan, Int. J. Hydrogen Energy, 2014, 39, 17747–17753 CrossRef.
- X. Xiao, T. Qin, Y. Jiang, F. Jiang, M. Li, X. Fan, S. Li, H. Ge, Q. Wang and L. Chen, Prog. Nat. Sci.: Mater. Int., 2017, 27, 112–120 CrossRef.
- Y. Wang and Y. Wang, Prog. Nat. Sci.: Mater. Int., 2017, 27, 41–49 CrossRef.
- I. P. Jain, C. Lal and A. Jain, Int. J. Hydrogen Energy, 2010, 35, 5133–5144 CrossRef.
- T. Sadhasivam, H.-T. Kim, S. Jung, S.-H. Roh, J.-H. Park and H.-Y. Jung, Renewable Sustainable Energy Rev., 2017, 72, 523–534 CrossRef.
- C. J. Webb, J. Phys. Chem. Solids, 2015, 84, 96–106 CrossRef.
- K.-F. Aguey-Zinsou and J.-R. Ares-Fernández, Energy Environ. Sci., 2010, 3, 526 RSC.
- B. Sakintuna, F. Lamaridarkrim and M. Hirscher, Int. J. Hydrogen Energy, 2007, 32, 1121–1140 CrossRef.
- G. J. Kubas, Chem. Rev., 2007, 107, 4152–4205 CrossRef PubMed.
- T. K. A. Hoang and D. M. Antonelli, Adv. Mater., 2009, 21, 1787–1800 CrossRef.
- A. Hamaed, T. K. A. Hoang, G. Moula, R. Aroca, M. L. Trudeau and D. M. Antonelli, J. Am. Chem. Soc., 2011, 133, 15434–15443 CrossRef PubMed.
- A. I. Cooper and M. Poliakoff, Chem. Commun., 2007, 2965–2967 RSC.
- S. Sabo-Etienne and B. Chaudret, Coord. Chem. Rev., 1998, 178, 381–407 CrossRef.
- M. A. Esteruelas, A. M. López and M. Oliván, Chem. Rev., 2016, 116, 8770–8847 CrossRef PubMed.
- A. F. Borowski, S. Sabo-Etienne, M. L. Christ, B. Donnadieu and B. Chaudret, Organometallics, 1996, 15, 1427–1434 CrossRef.
- M. Grellier, L. Vendier, B. Chaudret, A. Albinati, S. Rizzato, S. Mason and S. Sabo-Etienne, J. Am. Chem. Soc., 2005, 127, 17592–17593 CrossRef PubMed.
- M. Grellier and S. Sabo-Etienne, Chem. Commun., 2011, 48, 34–42 RSC.
- M. Grellier, L. Vendier and S. Sabo-Etienne, Angew. Chem., 2007, 119, 2667–2669 CrossRef.
- G. Alcaraz, M. Grellier and S. Sabo-Etienne, Acc. Chem. Res., 2009, 42, 1640–1649 CrossRef PubMed.
- T. Arliguie, B. Chaudret, R. H. Morris and A. Sella, Inorg. Chem., 1988, 27, 598–599 CrossRef.
- B. Chaudret, P. Dagnac, D. Labroue and S. Sabo-Etienne, New J. Chem., 1996, 20, 1137–1141 Search PubMed.
- H. E. Kissinger, Anal. Chem., 1957, 29, 1702–1706 CrossRef.
- J. Farjas and P. Roura, Thermochim. Acta, 2014, 598, 51–58 CrossRef.
- V. Bérubé, G. Radtke, M. Dresselhaus and G. Chen, Int. J. Energy Res., 2007, 31, 637–663 CrossRef.
- P. Moretto, C. Zlotea, F. Dolci, A. Amieiro, J.-L. Bobet, A. Borgschulte, D. Chandra, H. Enoki, P. De Rango, D. Fruchart, J. Jepsen, M. Latroche, I. L. Jansa, D. Moser, S. Sartori, S. M. Wang and J. A. Zan, Int. J. Hydrogen Energy, 2013, 38, 6704–6717 CrossRef.
- T. B. Flanagan, C.-N. Park and W. A. Oates, Prog. Solid State Chem., 1995, 23, 291–363 CrossRef.
- R. Reguillo, M. Grellier, N. Vautravers, L. Vendier and S. Sabo-Etienne, J. Am. Chem. Soc., 2010, 132, 7854–7855 CrossRef PubMed.
- X. Xu and C. Song, Appl. Catal., A, 2006, 300, 130–138 CrossRef.
- S. Adjimi, J. M. García-Vargas, J. A. Díaz, L. Retailleau, S. Gil, M. Pera-Titus, Y. Guo and A. Giroir-Fendler, Appl. Catal., B, 2017, 219, 459–466 CrossRef.
- L. Li, L. Qu, J. Cheng, J. Li and Z. Hao, Appl. Catal., B, 2009, 88, 224–231 CrossRef.
- L. Di, S. Yao, S. Song, G. Wu, W. Dai, N. Guan and L. Li, Appl. Catal., B, 2017, 201, 137–149 CrossRef.
- L. Wang and R. T. Yang, J. Phys. Chem. C, 2008, 112, 12486–12494 CrossRef.
Footnote |
| † Electronic supplementary information (ESI) available. See DOI: 10.1039/c8se00170g |
| This journal is © The Royal Society of Chemistry 2018 |

