Crystalline niobium phosphates with water-tolerant and adjustable Lewis acid sites for the production of lactic acid from triose sugars†
Xincheng
Wang
 *ab,
Yongji
Song
ab,
Chongpin
Huang
c and
Bin
Wang
*d
aBeijing Key Laboratory of Fuels Cleaning and Advanced Catalytic Emission Reduction Technology, Beijing 102617, PR China. E-mail: wxcnathan@foxmail.com; wangxc@bipt.edu.cn
bCollege of Chemical Engineering, Beijing Institute of Petrochemical Technology, Beijing 102617, PR China
cState Key Laboratory of Chemical Resource Engineering, Beijing University of Chemical Technology, Beijing 100029, PR China
dBeijing Research Institute of Chemical Industry, Sinopec Group, Beijing 100013, PR China. E-mail: binwang@126.com
First published on 2nd May 2018
Abstract
Lactic acid (LA) is a versatile platform chemical for the production of biodegradable polymers as well as starting materials for the pharmaceutical industry. In this study, crystalline niobium phosphates directed by various surfactants were prepared by a facile sol–gel method and studied as heterogeneous Lewis acid catalysts for the direct conversion of triose sugars to LA under aqueous conditions. Metal oxides were used to alter the surface acidity, and pyridine FTIR analyses demonstrated the presence of both Lewis and Brønsted acid sites, which played essential roles in the conversion of biomass sugars. The incorporation of SnO2 and the use of surfactants significantly lowered the Brønsted-to-Lewis site ratio. P–OH groups were determined to be the origin of the Brønsted acid sites, while the partially hydrolyzed framework of tin and niobium species led to the formation of Lewis acid sites. The cationic surfactant-modified samples with highly crystalline structures outperformed the amphiphilic surfactant-modified samples. The optimum cetyltrimethylammonium bromide-modified catalyst afforded an LA yield of ca. 92% with the complete dihydroxyacetone (DHA) conversion at 160 °C. Furthermore, the isomerization of pyruvaldehyde (PA) was found to be the rate-determining step, while the rehydration of PA to DHA could occur in the current reaction system. A possible reaction mechanism involving the evolution of two key catalytic intermediates was proposed. In addition, crystalline niobium phosphates were also effective in the aqueous dehydration of sugars to furan derivatives with a 44% 5-hydroxymethylfurfural yield from glucose after 1 h. The current study can hopefully serve as a model for the development of novel solid acid catalysts for the conversion of sugars to platform chemicals.
1. Introduction
The growing desire to replace petroleum by renewable feed stocks has a large impact on the future energy field and drives the development of chemicals from sustainable resources.1,2 Carbohydrates, representing an abundant and inexpensive feedstock, have received considerable attention as a sustainable alternative for the production of fuels and platform chemicals.3 In this context, lactic acid (LA), has emerged as a versatile platform molecule for the manufacturing of pharmaceuticals, fine chemicals, fuels and most importantly, biodegradable polymers.4,5 Traditionally, LA is produced by fermentation of glucose derived from starch or cellulose-containing materials over genetically modified enzymes.6 However, biotechnological processes tend to suffer from limited space-time yields, high waste production, the need for control over the fermentation broth, and population control regulations for the microorganisms.7 Therefore, novel chemo-catalytic methods that directly convert sugars into LA have emerged as promising approaches in both academia and industry.8Triose sugars are commonly used to study the effects of various catalysts because they have fundamental carbon structures similar to that of LA.9 Dihydroxyacetone (DHA) can be obtained by the stoichiometric or catalytic oxidation of glycerol or by the fermentation of glycerol; therefore, it represents a low-cost precursor for the production of LA.9,10 Accordingly, heterogeneous catalysts possessing the advantage of facile separation from a reaction solution have been extensively explored for the transformation of triose sugars. The Sn-Beta zeolite and ultrastable-Y zeolite (H-USY) have been investigated to be efficient catalysts for the conversion of DHA in water at 125 °C, leading to LA yields of 90 mol% and 71 mol%, respectively.8,9 Alkaline-treated ZSM-5 zeolites attained an LA selectivity exceeding 90%, while the combined use of commercial Pt/Al2O3 with alkali metal hydroxides afforded an LA selectivity up to 96%.11–13 Moreover, Morales et al. demonstrated Sn-containing MFI zeolites as highly active Lewis-acid catalysts for the isomerization of concentrated (15 wt%) DHA to LA with an 85% yield at a 97% conversion.14 A remarkable 100% selectivity to lactic acid was reached from hydroxyacetone on dual metal/base catalysts.15 In our previous work, tin phosphate-derived catalysts, such as tin phosphate phase transfer catalysts and siliceous tin phosphates, have been demonstrated to be highly active for the conversion of carbohydrates to LA with yields of ca. 95%.15,16
Generally, bifunctional catalysts with both Lewis and Brønsted acid sites exhibit high efficiency and selectivity for the conversion of sugars to LA.17 For instance, Clippel et al. reported that carbon–silica composite catalysts with these two types of acid sites were capable of selectively converting sugars into LA; a promising LA selectivity of 83% with 92% DHA conversion was achieved at 110 °C after 6 h over Sn doped carbon–silica composite materials.18 Fe-doped SnO2 catalysts with both Lewis and Brønsted acid sites also exhibited good LA selectivity and reusability for the conversion of sugars. It was then proposed that the presence of weak Brønsted acid sites accelerated sugar conversion, and nanoscale metal catalysts were effective in catalyzing the biomass into the desired platform compounds.19 Water is an environmental benign solvent that has already been widely used in various organic reactions.20 However, zeolites and related materials tend to suffer from hydrothermal instability in aqueous solutions, thus limiting their potential further applications.
Solid acid catalysts can combine the aspects of both Brønsted and Lewis acidity, particularly in terms of acid strength, number of active sites and support morphology.21 Tin-derived materials, such as Sn-Beta, Sn-MONT, Sn-MFI zeolites, and Sn-MWW zeolites, have proved to be efficient catalysts for the reactions of the trioses to LA.22 However, the production of tin-based catalysts is often complicated and involves a multistep, time-consuming synthesis process, which may limit their industrial utilization.23 Therefore, the development of new tin-based catalysts with a simple fabrication process and improved catalytic performance is important for the production of LA from carbohydrates.24 Materials based on niobium phosphates (NbOPO4) have proven to be interesting catalysts in several fields of applications due to their tunable acidity.25 The NbOPO4 solid acidic catalyst was evaluated to have a high acid strength (Ho ≤ −8.2) corresponding to the acid strength of 90% H2SO4. Moreover, NbOPO4 can preserve its strong acid properties even in polar liquids and can retain its properties at high temperatures.
In the present study, a novel SnO2-doped NbOPO4 solid acid catalyst with both Lewis and Brønsted acid sites was synthesized by a simple sol–gel process and was explored in a sugar conversion reaction using a green medium: water. The acid strength and density were successfully adjusted by controlling the SnO2 doping amount, calcination temperature, and synthesis conditions. These catalysts were fully characterized by using various techniques including temperature-programmed desorption of ammonia (NH3-TPD), wide-angle X-ray powder diffraction (XRD), X-ray photoelectron spectroscopy (XPS), BET, scanning electron microscopy (SEM), and FTIR measurements of the adsorbed pyridine. SnO2/NbOPO4-CTAB was identified as the most promising catalyst, and the yields were optimized by varying the process conditions. The as-prepared catalysts allow for facile recyclability and good reusability. In addition, the catalytic mechanism could be inferred from the hydrothermal stability of SnO2/NbOPO4-CTAB via an operando-FTIR study involving water molecules.
2. Experimental
2.1. Catalyst preparation and characterization
Potassium niobate solution was obtained from the hydrothermal treatment of Nb2O5 (Aladdin, 99.95%, China) and KOH at 400 °C for 4 h, followed by dissolution in water. The concentration of Nb was determined to be 0.1 M by ICP-AES analysis. In a typical process, 1.15 g H3PO4 (Aladdin, 85% aqueous solution, China) and 0.91 g cetyltrimethylammonium bromide (CTAB) were dissolved in 25 mL water under vigorous stirring at 40 °C for 2 h. Specifically, a certain amount of potassium niobate solution (0.1 M) and a 0.3 M SnCl4 solution (Sn![[thin space (1/6-em)]](https://www.rsc.org/images/entities/char_2009.gif) :
:![[thin space (1/6-em)]](https://www.rsc.org/images/entities/char_2009.gif) Nb = 1) were simultaneously added dropwise under continuous mechanical stirring for 24 h at 40 °C. The resulting white colloidal mixture was kept for crystallization at 160 °C after 3 days. The white powder catalyst sample was thus prepared after filtration, washed with deionized water, vacuum dried overnight and calcinated (500 °C in static air for 3 h with a heating rate of 10 °C min−1). The obtained material was designated SnO2/NbOPO4-CTAB, where CTAB refers to the surfactant used. Other samples were prepared accordingly by changing the surfactants (P123, F127, and sodium dodecyl benzene sulfonate (SDBS)) or metal salts (sodium aluminate, lead nitrate, and chromium nitrate from Sinopharm Chemical Reagent Co., Ltd, Shanghai, China). NbCl5 (Alfa Aesar, 99%) was also used as the niobium source for the preparation of SnO2/NbOPO4-CTAB according to Mal and Fujiwara.26
Nb = 1) were simultaneously added dropwise under continuous mechanical stirring for 24 h at 40 °C. The resulting white colloidal mixture was kept for crystallization at 160 °C after 3 days. The white powder catalyst sample was thus prepared after filtration, washed with deionized water, vacuum dried overnight and calcinated (500 °C in static air for 3 h with a heating rate of 10 °C min−1). The obtained material was designated SnO2/NbOPO4-CTAB, where CTAB refers to the surfactant used. Other samples were prepared accordingly by changing the surfactants (P123, F127, and sodium dodecyl benzene sulfonate (SDBS)) or metal salts (sodium aluminate, lead nitrate, and chromium nitrate from Sinopharm Chemical Reagent Co., Ltd, Shanghai, China). NbCl5 (Alfa Aesar, 99%) was also used as the niobium source for the preparation of SnO2/NbOPO4-CTAB according to Mal and Fujiwara.26
The powder XRD patterns of the tin oxide and niobium phosphates complex was measured by an X'pert MFD diffractometer using Cu-Kα radiation (λ = 1.5406 Å) generated at a voltage of 40 kV and a current of 40 mA. XPS was performed with an ESCALAB 250 (Thermo Fisher Scientific, America). The spectra were excited by a monochromated Al Kα source at 150 W; pass energy of 30 eV was used for high resolution scans. Binding energies were referenced to the internal standard C 1s (284.5 eV). FTIR spectra were measured on a Bruker Vertex 70 FTIR with a MCT/A detector. The Brunauer–Emmett–Teller (BET) method was used to calculate the specific surface area (SORPTOMATIC 1990, Thermo Electron Co.). SEM images were collected by a JEOL JSM-7610F.
Total acid sites were determined by NH3-TPD (OmniStar, MS200) with a thermal conductivity detector. A sample of approximately 100 mg was initially degassed at 300 °C for 2 h under a constant N2 flow of 40 mL min−1. The sample was cooled and NH3 was adsorbed at 90 °C for 30 min to reach saturation. Afterwards, the ammonia supply line was shut off and N2 was purged at 15 mL min−1 for 2 h to remove physically adsorbed NH3. The sample was then heated linearly at a rate of 10 °C min−1 from 90 °C to 800 °C.
Lewis and Brønsted acid sites were investigated by FTIR using pyridine as the probe molecule. The catalyst powder was pressed into self-supporting wafers (15–20 mg) and activated in an IR cell in vacuum at 500 °C for 1 h prior to the adsorption experiments. The adsorption of pyridine was performed at room temperature for 1 h (excess pyridine was further evacuated for 1 h), followed by time-controlled evacuation at various temperatures. The FTIR spectra of the unloaded catalyst were recorded as reference spectra.
2.2. General reaction procedure
Aqueous solutions of triose sugars were prepared by dissolving DHA or PA in deionized water. Batch reactions were conducted in sealed vials (15 mL capacity) placed in a temperature-controlled oil bath. The amount of the loaded reaction solution was kept constant at 5 mL. Temperatures in the reactor were measured by a thermocouple in contact with the solution. All reaction solutions were mixed at a constant rate of 500 rpm using an internal stirrer. The samples were quenched immediately in an ice water bath after certain reaction times and then filtered with a 0.2 μm syringe filter prior to analysis. The detection methods of substrates and products were described elsewhere.16The conversion of sugars and the product yields were determined based on a carbon basis.27 The experiments were replicated at least three times, and the mean values were reported here. The error was below 5%.
3. Results and discussion
3.1. Catalyst preparation and characterization
The SnO2-doped niobium phosphate catalysts were obtained by a simple sol–gel process with the modification of surfactants. The samples were prepared from single-phase metal precursors by a coprecipitation method to allow for microstructural homogeneity of the prepared catalysts. The crystal structure and the phase change of the different surfactant-directed SnO2-doped NbOPO4 samples were examined by XRD. As shown in Fig. 1, the P123, F127, and SDBS directed samples were dominated by tetragonal SnO2 (JCPDS no. 41-1445), as confirmed by the appearance of diffraction peaks from the (110), (101), (200), (211), (220), and (301) planes. The existence of diffraction peaks of NbOPO4 was also observed with low intensities. However, te addition of CTAB led to the formation of highly crystalline NbOPO4 and tetragonal SnO2 species after calcination at 500 °C according to the X-ray diffraction pattern. Generally, amorphous niobium phosphate solids are expected if the solids are subjected to static heating in air below 800 °C.28 Furthermore, the SEM images of these niobium phosphates showed that the addition of surfactants, such as P123 and F127, significantly destroyed the bulk particles, leading to a higher specific surface area; CTAB led to the formation of disordered stacking crystal flakes (Fig. S1†). In this way, a crystalline material is obtained by a facile sol gel method using CTAB as surfactant under mild conditions.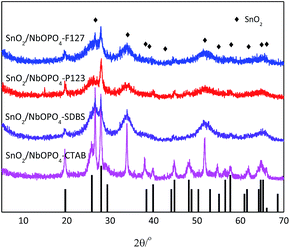 | ||
| Fig. 1 Wide-angle XRD patterns of the SnO2-NbOPO4 catalysts. Black bars represent the crystalline phases of NbOPO4. | ||
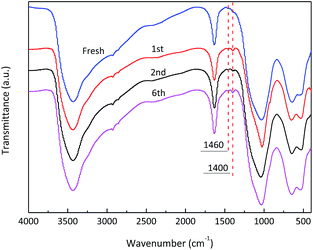
The FTIR spectra of SnO2/NbOPO4-CTAB showed a sharp band centered at approximately 1040 cm−1, which could be assigned to the Sn–O–P or Nb–O–P stretching vibration, indicating the presence of a phosphate framework (Fig. 2).29 The broad bands at approximately ∼3430 and ∼1630 cm−1 are attributed to asymmetric OH stretching and bending vibrations of adsorbed water molecules. In the 750–450 cm−1 zone, there are two bands due to the overlapping of ν(Sn–O) and ν(Nb–O).30 The FTIR spectra are complicated to assign because both SnO2 and NbOPO4 show absorptions.
3.2. XPS analysis
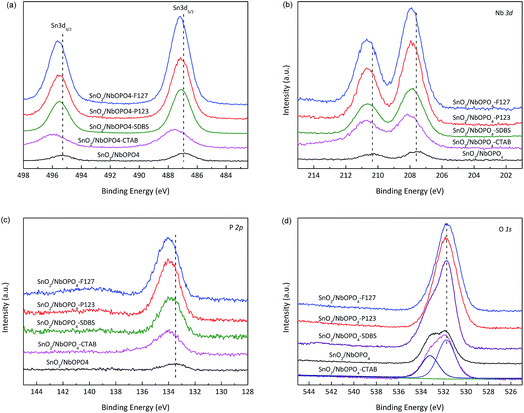
The surface composition and elemental oxidation states of SnO2/NbOPO4 samples were investigated by XPS analysis. As shown in Fig. 3a, the two peaks at 486.9 eV and 495.3 eV were ascribed to Sn 3d5/2 and Sn 3d3/2, respectively, which are characteristic of tetravalent tin.31 The binding energy values of the Nb 3d doublet were in a typical range of Nb(V) in an oxidic environment (Fig. 3b).32 The P 2p core level spectra of the surfactant-directed samples showed symmetric peaks at 134.0 eV, which was assigned to phosphorous in the P–OH species.33 Upward shifts in the Sn 3d, Nb 3d and P 2p binding energies were observed for the surfactant-directed samples, indicating an increased electron density in the Sn, Nb, and P nuclei. The O 1s band of SnO2/NbOPO4-CTAB was structured and the main peak was centered at 531.7 eV; a shoulder (centered at 533.2 eV) occurred on the high binding energy side of the main peak (Fig. 3d). The main peak could be assigned to the lattice oxygen in SnO2 and NbOPO4, while the shoulder was due to the –OHs bonded to phosphorus (the existence of P–OH groups could also be confirmed by FTIR in Fig. 7).34The surface Sn/Nb ratio was roughly consistent with the proportion of the metal salts used, while the surface P/Nb ratio of pure NbOPO4 was determined to be 0.7![[thin space (1/6-em)]](https://www.rsc.org/images/entities/char_2009.gif) :
:![[thin space (1/6-em)]](https://www.rsc.org/images/entities/char_2009.gif) 1. However, when Al3+, Cr3+, and Pb2+ salts were used, the metal/Nb ratios were 0.9, 0.3, and 0.2, respectively, possibly because Cr3+ and Pb2+ could not aggregate into the micelles under the current synthesis conditions.
1. However, when Al3+, Cr3+, and Pb2+ salts were used, the metal/Nb ratios were 0.9, 0.3, and 0.2, respectively, possibly because Cr3+ and Pb2+ could not aggregate into the micelles under the current synthesis conditions.
3.3. Acidity evaluation by NH3-TPD and FTIR spectroscopy of adsorbed pyridine
The total amount and the nature of the acid sites of SnO2/NbOPO4 catalysts were studied by NH3-TPD and FTIR spectroscopy after pyridine chemisorption. The relative amount of acid sites present on the surface of the samples as well as a rough estimate of acid strength could be evaluated via NH3-TPD analysis (Fig. 4). After deconvolution, three NH3 desorption peaks over the ranges of 100 °C to 200 °C, 200 °C to 400 °C, and 400 °C to 600 °C, corresponding to weak, medium and strong acid sites, respectively, were classified.35 Pure NbOPO4 has two desorption peaks at 165 °C and 450 °C, indicating the existence of both weak and strong acid sites. Note that the addition of SnO2 and F127 resulted in increased ratio of strong acid sites. However, when P123, SDBS, and CTAB were used as surfactants during the synthesis of SnO2/NbOPO4, desorption curves composed of medium to weak acidic strengths were observed and their shapes indicated a quite broad distribution of acidic strength. The strong and medium acid sites are usually ascribed to the desorption of ammonia from strong Brønsted and Lewis acid sites. In addition, the weak acid sites could be ascribed to the presence of weak Lewis acid sites (Fig. 5c).36 The total amount of desorbed ammonia decreased dramatically (from 0.59 mmol g−1 to 0.21 mmol g−1) after the incorporation of tin oxide; however, the specific surface area of the surfactant-modified samples increased slightly (Table 1).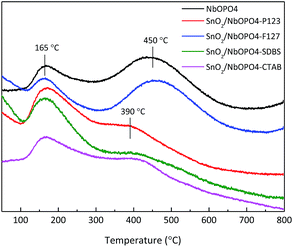 | ||
| Fig. 4 NH3-TPD profiles of the SnO2/NbOPO4 samples (pretreatment at 300 °C for 2 h; and adsorption at 90 °C). | ||
| Entry | Catalysts | P/Sn/Nb ratioa | Specific surface area (m2 g−1) | Total acid sites (mmol g−1)b | BAS/LAS ratioc | GLA (%) | PA (%) | LA (%) | DHA conv. (%) |
|---|---|---|---|---|---|---|---|---|---|
| a Determined by XPS analysis. b Determined by NH3-TPD analysis. c Brønsted/Lewis sites ratio determined by pyridine FTIR desorbed at 150 °C. d Only small amount of Brønsted acid sites were detected after pre-treatment at 500 °C. e NbCl5 was used as the niobium source. | |||||||||
| 1 | Blank | — | — | — | — | 0.5 | 22.6 | <0.5 | 41.3 |
| 2 | NbOPO4 | 0.7![[thin space (1/6-em)]](https://www.rsc.org/images/entities/char_2009.gif) : :![[thin space (1/6-em)]](https://www.rsc.org/images/entities/char_2009.gif) 0 0![[thin space (1/6-em)]](https://www.rsc.org/images/entities/char_2009.gif) : :![[thin space (1/6-em)]](https://www.rsc.org/images/entities/char_2009.gif) 1 1 |
74 | 0.59 | 1.42 | 2.2 | 52.8 | 4.8 | 58.9 |
| 3 | SnO2 | — | 78 | 0.18 | 0.08 | 0.5 | 3.2 | 1.3 | 26.8 |
| 4 | NbOPO4-CTAB | 0.8![[thin space (1/6-em)]](https://www.rsc.org/images/entities/char_2009.gif) : :![[thin space (1/6-em)]](https://www.rsc.org/images/entities/char_2009.gif) 0 0![[thin space (1/6-em)]](https://www.rsc.org/images/entities/char_2009.gif) : :![[thin space (1/6-em)]](https://www.rsc.org/images/entities/char_2009.gif) 1 1 |
90.1 | 0.53 | 3.77 | 0.5 | 68.5 | 14.2 | 93.2 |
| 5 | SnO2/NbOPO4 | 2.5![[thin space (1/6-em)]](https://www.rsc.org/images/entities/char_2009.gif) : :![[thin space (1/6-em)]](https://www.rsc.org/images/entities/char_2009.gif) 1.2 1.2![[thin space (1/6-em)]](https://www.rsc.org/images/entities/char_2009.gif) : :![[thin space (1/6-em)]](https://www.rsc.org/images/entities/char_2009.gif) 1 1 |
62 | 0.42 | 1.08 | 1.7 | 51.0 | 7.24 | 59.5 |
| 6 | SnO2/NbOPO4-P123 | 1.9![[thin space (1/6-em)]](https://www.rsc.org/images/entities/char_2009.gif) : :![[thin space (1/6-em)]](https://www.rsc.org/images/entities/char_2009.gif) 1 1![[thin space (1/6-em)]](https://www.rsc.org/images/entities/char_2009.gif) : :![[thin space (1/6-em)]](https://www.rsc.org/images/entities/char_2009.gif) 1 1 |
95 | 0.31 | 0.45 | 1.2 | 44.6 | 39.5 | 86.9 |
| 7 | SnO2/NbOPO4-F127 | 1.5![[thin space (1/6-em)]](https://www.rsc.org/images/entities/char_2009.gif) : :![[thin space (1/6-em)]](https://www.rsc.org/images/entities/char_2009.gif) 1.1 1.1![[thin space (1/6-em)]](https://www.rsc.org/images/entities/char_2009.gif) : :![[thin space (1/6-em)]](https://www.rsc.org/images/entities/char_2009.gif) 1 1 |
113 | 0.21 | 0.48 | 0.5 | 52.8 | 22.4 | 80.2 |
| 8 | SnO2/NbOPO4-SDBS | 1.6![[thin space (1/6-em)]](https://www.rsc.org/images/entities/char_2009.gif) : :![[thin space (1/6-em)]](https://www.rsc.org/images/entities/char_2009.gif) 1.3 1.3![[thin space (1/6-em)]](https://www.rsc.org/images/entities/char_2009.gif) : :![[thin space (1/6-em)]](https://www.rsc.org/images/entities/char_2009.gif) 1 1 |
91 | 0.25 | 0.22 | 1.1 | 43.2 | 36.5 | 83.7 |
| 9 | SnO2/NbOPO4-CTAB | 1.8![[thin space (1/6-em)]](https://www.rsc.org/images/entities/char_2009.gif) : :![[thin space (1/6-em)]](https://www.rsc.org/images/entities/char_2009.gif) 0.7 0.7![[thin space (1/6-em)]](https://www.rsc.org/images/entities/char_2009.gif) : :![[thin space (1/6-em)]](https://www.rsc.org/images/entities/char_2009.gif) 1 1 |
89 | 0.27 | —d | 0.7 | 32.6 | 47.1 | 90.5 |
| 10 | SnO2/NbOPO4-CTABe | 1.7![[thin space (1/6-em)]](https://www.rsc.org/images/entities/char_2009.gif) : :![[thin space (1/6-em)]](https://www.rsc.org/images/entities/char_2009.gif) 0.7 0.7![[thin space (1/6-em)]](https://www.rsc.org/images/entities/char_2009.gif) : :![[thin space (1/6-em)]](https://www.rsc.org/images/entities/char_2009.gif) 1 1 |
119 | 0.26 | —d | 0.8 | 31.4 | 45.7 | 87.5 |
| 11 | Al2O3/NbOPO4-CTAB | 1.7![[thin space (1/6-em)]](https://www.rsc.org/images/entities/char_2009.gif) : :![[thin space (1/6-em)]](https://www.rsc.org/images/entities/char_2009.gif) 0.9 0.9![[thin space (1/6-em)]](https://www.rsc.org/images/entities/char_2009.gif) : :![[thin space (1/6-em)]](https://www.rsc.org/images/entities/char_2009.gif) 1 1 |
102 | 0.51 | 1.12 | 1.4 | 53.7 | 15.3 | 84.4 |
| 12 | Cr2O3/NbOPO4-CTAB | 0.7![[thin space (1/6-em)]](https://www.rsc.org/images/entities/char_2009.gif) : :![[thin space (1/6-em)]](https://www.rsc.org/images/entities/char_2009.gif) 0.2 0.2![[thin space (1/6-em)]](https://www.rsc.org/images/entities/char_2009.gif) : :![[thin space (1/6-em)]](https://www.rsc.org/images/entities/char_2009.gif) 1 1 |
93 | 0.32 | 0.91 | 0.9 | 46.6 | 24.4 | 91.7 |
| 13 | PbO/NbOPO4-CTAB | 0.8![[thin space (1/6-em)]](https://www.rsc.org/images/entities/char_2009.gif) : :![[thin space (1/6-em)]](https://www.rsc.org/images/entities/char_2009.gif) 0.3 0.3![[thin space (1/6-em)]](https://www.rsc.org/images/entities/char_2009.gif) : :![[thin space (1/6-em)]](https://www.rsc.org/images/entities/char_2009.gif) 1 1 |
75 | 0.29 | 1.26 | 0.6 | 31.8 | 6.3 | 82.1 |
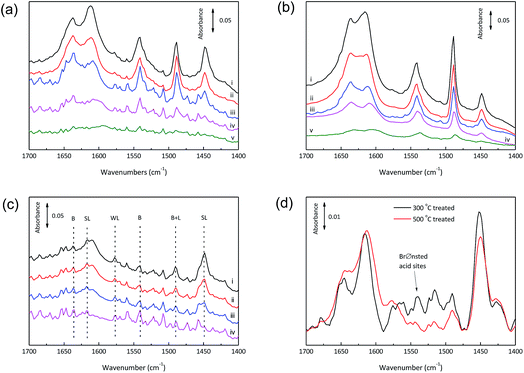
Pyridine has been widely used as an efficient probe molecule for the determination of Lewis and Brønsted acidities of solid acids by monitoring typical bands between 1400 and 1700 cm−1 due to the ring vibration modes of pyridine. Differential FTIR spectra for pyridine-adsorbed calcined SnO2/NbOPO4 are present in Fig. 5. The intensities of bands at 1450, 1489 and 1540 cm−1 assignable to Lewis, overlap of Brønsted and Lewis, and Brønsted acidity, respectively, decreased with an increase in the desorption temperature from 100 to 400 °C.37 The spectra of all the samples exhibited the same band pattern typical of Brønsted and Lewis-type surface acid sites but with different intensities (Fig. 5 and S2†).
The relative Brønsted and Lewis acidity ratios (BAS/LAS ratios) could be deduced by integrating the areas under the characteristic bands while considering the extinction coefficients.38 For NbOPO4 without surfactants, BAS/LAS ratios of 0.8 to 1.8 were obtained with increasing evacuation temperatures between 100 °C and 300 °C (Fig. 6). Moreover, much higher BAS/LAS ratios were observed after the addition of CTAB during the synthesis of NbOPO4. The strong Brønsted acid strength could be reflected by strongly bonded chemisorbed pyridine after heating the sample at 400 °C (Fig. 5b). However, the strong Brønsted acidity is unfavorable to produce high yield LA from triose sugars. Therefore, the in situ incorporation of SnO2 into the NbOPO4 catalyst was developed to strengthen the highly favorable Lewis acidity. The Lewis acidity of SnO2/NbOPO4-CTAB was strong enough to maintain, even after outgassing at 200 °C for 30 min (Fig. 5c). However, only minute amount of Brønsted acid sites could be detected on SnO2/NbOPO4-CTAB; hence, the quantification was not reliable based on the area under the weak peaks, and the corresponding BAS/LAS ratio was displayed as a simulated dashed line for comparison (Fig. 6).
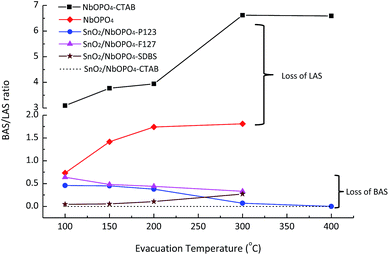 | ||
| Fig. 6 Brønsted: Lewis character as a function of evacuation temperature. The ‘---’ line is a guide line for the simulated BAS/LAS ratios of SnO2/NbOPO4-CTAB. | ||
Obviously, the incorporation of SnO2 and the use of surfactants significantly lowered the BAS/LAS ratio. In contrast to the pure NbOPO4 catalysts, the SnO2 incorporated samples exhibited a decreasing trend in the BAS/LAS ratio with increasing evacuation temperatures except for SnO2/NbOPO4-SDBS (Fig. 5c and 6). Moreover, the amphiphilic surfactants, such as F127, P123, tend to lead to higher BAS/LAS ratios of SnO2/NbOPO4 than that of the cationic surfactant CTAB (Fig. 6).
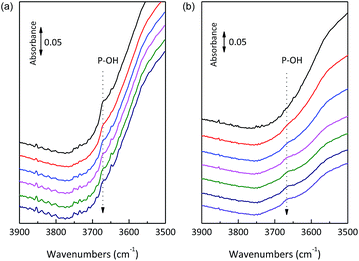
Only Lewis acid sites were detected for SnO2/NbOPO4-CTAB after treatment for 1 h at 500 °C, while both Lewis and Brønsted acid sties could be observed for the catalyst calcined at 300 °C (Fig. S3†). Therefore, the increase in calcination temperature caused a reduction in acidity, especially the Brønsted acidity. The catalysts showed a weak band at 3672 cm−1 before outgassing, reasonably attributable to the –OH stretching mode of the surface hydrogen-phosphate species, which were reduced in intensity due to progressive dehydroxylation of the surface after prolonged outgassing (Fig. 7a).25 Conversely, the band relative to the –OH stretching mode of free Nb–OH was almost never observed, thus making the surface P–OH groups mostly responsible for the Brønsted acidity.39 For the 500 °C calcined sample, P–OH could be recovered after introducing water vapor at 150 °C for 1 h (Fig. 7b). Therefore, when the calcined SnO2/NbOPO4-CTAB catalyst was used in water, a certain amount of recovered Brønsted acid sites could be expected. In this way, the P–OH species played an important role regarding the catalytic reactivity.
In addition, the more intensified band at 150 °C due to pyridine adsorbed on the Lewis acid sites was observed on the 300 °C evacuated sample in comparison to that on the 500 °C evacuated sample, confirming the greater presence of water at 300 °C (Fig. 5d). Therefore, a portion of the Lewis acid sites on SnO2/NbOPO4-CTAB are expected to function as water-tolerant active sites, which are beneficial for the conversion of sugars under aqueous conditions.40,41 Indeed, NbO4–H2O adducts and partially hydrolyzed framework tin species were supposed to be the origin of Lewis acid sites.17,42
3.4. Catalysis
The catalysis of SnO2/NbOPO4-CTAB was evaluated through the conversion of triose sugars to LA in water. The product formation in a typical batch experiment was monitored as a function of reaction times, and the concentration profiles are shown in Fig. 8. When DHA was used as a starting material, GLA was observed at the initial stage of the reaction, indicating the isomerization between DHA and GLA.43 DHA was completely converted after 50 min with only a trace amount of GLA. PA was clearly optimized and reached a yield of ca. 60% in approximately 40 min. The optimum PA yield obtained here was obviously higher than those reported previously,44 suggesting that the SnO2/NbOPO4-CTAB catalyst significantly promoted the dehydration of DHA to PA possibly due to its high acid concentration (Table 1). The highest PA yield was obtained for NbOPO4-CTAB, possibly due to the highest percentage of Brønsted acid sites. The yield of LA increased with a prolonged reaction time and reached 85% in 5 h with a 5.3% PA yield. Herein, PA was an intermediate product, and a clear optimum was typically observed with a consecutive reaction pathway. Therefore, a reaction sequence for the conversion of DHA to LA, involving the dehydration of DHA to PA and the rehydration of PA followed by a 1, 2 intra-molecular hydride shift to LA, was proposed (Fig. 8 inset).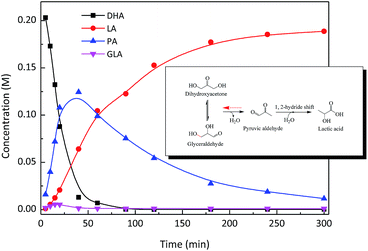 | ||
| Fig. 8 Time course of the DHA conversion over SnO2/NbOPO4-CTAB. Reaction conditions: ([DHA]o = 0.222 M, catalysts = 50 mg, T = 140 °C) inset: proposed reaction pathway. | ||
PA was then employed as the reactant to explore the efficiency of SnO2/NbOPO4-CTAB to produce LA (Fig. 9). The yield of LA increased gradually along with the conversion of PA and a final LA yield of ca. 93% was obtained at 140 °C after 5 h. A relatively slower rate of LA formation was observed compared with PA conversion rate at the initial stage of the reaction. Considering the narrowed gap between the PA conversion and LA selectivity, certain intermediates could be proposed during the reaction. The potential intermediate here might be the hydrated PA, although it was not confirmed by the current detection method.
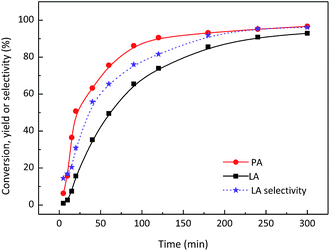 | ||
| Fig. 9 PA conversion over SnO2/NbOPO4-CTAB in an aqueous medium. Reaction conditions: ([PA]o = 0.045 M, catalysts = 50 mg, T = 140 °C). | ||
The effect of the initial PA concentration on the PA conversion and LA yield is presented in Fig. 10. The PA conversion increased in the range of 0.036 M to 0.55 M. In contrast, decreased LA yields were observed with increasing PA concentrations, possibly due to the formation of humin in the concentrated substrates. It is worthwhile to mention that the formation of GLA and DHA was observed when PA was used as the starting material. Therefore, the hydration of PA could lead to the formation of DHA or GLA as well as hydrated PA (Fig. 8 inset: the dashed red arrow). The highest yields of GLA and DHA were obtained with initial PA concentrations of 0.069 M and 0.28 M, respectively. However, a further increase in the PA concentration to 0.55 M led to decreased yields of both GLA and DHA. This could be explained by the fact that the formed LA increased the acidity of the reaction solution, thus favoring the dehydration of GLA and DHA to PA. Indeed, the pH of each aqueous mixture after the reaction has been measured and a decreased trend was obtained in the range of 3.52–2.28.
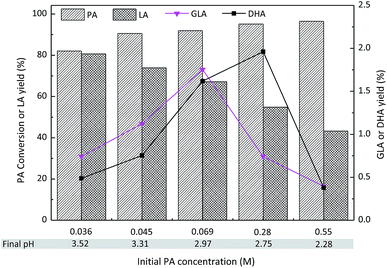 | ||
| Fig. 10 Effect of the initial PA concentration on the conversion of PA to LA with SnO2/NbOPO4-CTAB. Reaction conditions: (catalysts = 50 mg, T = 140 °C, 2 h). | ||
3.5. Effect of varying the surfactants and metal salts on the production of LA from DHA
To investigate the catalytic performance of SnO2/NbOPO4 catalysts with different surfactants and metal salts, the LA yields for the reaction of DHA in water at 140 °C were tested, and results were listed in Table 1. For comparison, the reaction was initially carried out in the absence of a catalyst. A minute amount of LA was obtained for the reaction without a catalyst despite a 22.6% PA yield, which might be caused by the catalytic reaction of subcritical water. Pure NbOPO4 and SnO2 both exhibited little catalytic activity with LA yields of 4.8%, and 1.3%, respectively. It was obvious that the yield of PA over NbOPO4 was higher than that over SnO2, corresponding to the higher amount of total acid sites and a greater BAS/LAS ratio for NbOPO4.High PA yields were observed for catalysts with a high P percentage composition except for SnO2/NbOPO4-CTAB, indicating the promotion effect of Brønsted acidity, which was possibly derived from P–OH for the dehydration reaction of DHA. Meanwhile, a high P amount did not necessarily mean more Brønsted acid sites when considering the SnO2/NbOPO4-CTAB sample (Table 1). The concentrations of acid sites (especially Brønsted acid sites) of various surfactant-modified samples are shown in Table S1.† The use of cationic surfactant CTAB significantly decreased the amount of Brønsted acid sites and led to the highest Lewis acid sites compared with that of P123, F127 or SDBS. The tuning of the two types of acidities caused SnO2/NbOPO4-CTAB to outperform SnO2/NbOPO4, SnO2/NbOPO4-P123, SnO2/NbOPO4-F127, and SnO2/NbOPO4-SDBS for the conversion of DHA to LA.
Rasrendra et al. have screened a wide range of metal salts as homogeneous catalysts for the conversion of DHA into LA in aqueous solutions; they determined that Al3+ and Cr3+ salts were the most promising cations with LA yields of up to 93%.43 The metal ions were postulated to act as Lewis acid catalysts by coordination and activation of the carbonyl group. Therefore, the effect of Al3+ and Cr3+ on the catalytic performance of NbOPO4-CTAB was investigated. Cr2O3-modified catalysts could afford a promising LA yield of 24.4%. Considering the fact that Cr3+ hardly precipitates under the current synthesis process, further studies are needed that focus on the development of synthesis methods to incorporate Cr2O3 into the framework of NbOPO4. Moderate PA yields were obtained for both Al2O3/NbOPO4-CTAB and Cr2O3/NbOPO4-CTAB, possibly due to their high BAS/LAS ratios.
Moreover, dilute Pb(II) ions were reported to be efficient catalysts for the conversion of cellulose into LA in water.45 Therefore, PbO/NbOPO4-CTAB was also prepared by the same procedure. Obviously, Pb(II) could not be preserved by the current synthesis method, too. A low LA yield of 6.3% was obtained with a PA yield of 31.8%, although the conversion of DHA reached 82.1%.
The excellent performance of the SnO2/NbOPO4-CTAB sample indicated that the crystalline catalyst could be efficiently used for the catalytic conversion of triose sugars to LA, even though a slightly lower specific surface area was obtained. Thus, the possible limitation of the niobia catalysts, namely, a phase change from an amorphous phase to a crystalline phase under hydrothermal conditions that leads to the decrease in the catalytic activity, could be hopefully overcome.46 Therefore, a hydrothermally stable catalyst was expected in the current study.
3.6. Effect of process conditions for the SnO2/NbOPO4-CTAB catalyzed reaction of DHA to LA
To gain insights into the influence of process conditions on the production of LA from DHA, the liquid products were identified and quantified by HPLC analyses. Comparable results were obtained using Nb2O5 or NbCl5 during the preparation of catalysts (Table 1, entry 9 and 10). Therefore, SnO2/NbOPO4-CTAB derived from Nb2O5 was selected for further focused studies considering economic aspects. The conversion of DHA and the yield of LA were strongly dependent on the reaction temperature (Fig. 11). The essential quantitative conversion of DHA (99%) was achieved within 20 min at 160 °C. The conversion rate was reduced considerably at lower temperatures, and for instance, a reaction time of 90 min was required for an approximately 98% DHA conversion at 140 °C. When the reaction was conducted at 120 °C, a reaction time of 5 h was needed to acquire nearly complete substrate conversion. Moreover, the reaction temperature has a potent effect on LA yields (Fig. 11b). The yield of LA increased significantly with an increase in the temperature between 120 °C and 160 °C. The reaction rate increased dramatically in the initial stages of the reaction; a maximum LA yield of 92% was observed at 160 °C. However, the LA yield declined distinctly to ca. 36% at 120 °C. Low temperatures tend to favor the production of PA, and the highest PA yield of 43% was obtained at 120 °C after 5 h (Fig. S4†). The reaction profile of PA showed an optimum PA yield due to the drastic dehydration of DHA. A color change in the reaction solution from yellow to dark brown was observed with an increase in temperature, indicating the formation of polycondensation products.47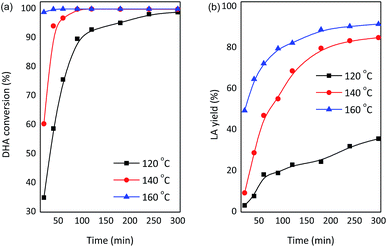 | ||
| Fig. 11 Effect of varying the temperature on the conversion of DHA to LA with SnO2/NbOPO4-CTAB (conditions: 0.222 M DHA, 50 mg catalysts). | ||
The effect of SnO2/NbOPO4-CTAB loading on both the conversion of DHA (0.222 M) and the yield of LA is presented in Fig. 12. Obviously, higher catalyst dosages tended to lead to higher DHA conversions and LA yields with correspondingly lower PA yields. A minute amount of GLA was observed during the reaction, and the total yields of GLA, PA and LA increased gradually along with an increase in catalyst loading. Therefore, the current catalysts were beneficial for the dehydration of DHA to PA and the following conversion of PA to LA. Moreover, the yield of LA was a function of the initial concentration of DHA and was significantly higher when a low initial substrate concentration was used, while the yield of PA showed a reversed trend. The formation of brown soluble materials was more severe when condensed DHA solutions were utilized.48
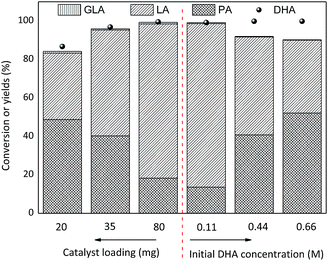 | ||
| Fig. 12 Effect of the SnO2/NbOPO4-CTAB dosage and initial DHA concentration on the conversion of DHA to LA (conditions: 140 °C, 2 h). | ||
3.7. Recycling of the catalyst
To verify the reusability of the catalyst, six consecutive reactions were run with the SnO2/NbOPO4-CTAB sample under the same reaction conditions after catalyst recovery (Fig. 13). Between runs the catalyst was dried at 60 °C under vacuum and then calcined at 500 °C. Before the next run, the catalyst was weighed to maintain a constant substrate-to-catalyst ratio. The conversion of DHA remained above 97% after six consecutive runs. The yield of LA decreased slightly along with the recycling times, and an abrupt decrease was observed only after the third run. Meanwhile, no significant loss in the PA yields was obtained. The FTIR analyses of the recycled samples showed bands at 1400 cm−1 and 1460 cm−1 that could be assigned to the C–C vibrations and the C–H bending vibration of methylene groups, respectively, confirming the deposition of carbon (Fig. 2). After calcination, the deposited organic compounds on the catalyst surface could be significantly removed, and thus the humin deposition should not be the reason for the decreased LA yield. The SEM morphology and the crystal structure of the recycled SnO2/NbOPO4-CTAB were similar to those of the fresh sample (Fig. S5 & S6†). No sign of loss in the specific surface area and total acid sites were observed after six consecutive runs (data not shown). A loss of less than 1.2% of the initial metal content (Sn and Nb) was obtained by ICP analysis, and only a slightly lowered Sn/Nb ratio (0.66![[thin space (1/6-em)]](https://www.rsc.org/images/entities/char_2009.gif) :
:![[thin space (1/6-em)]](https://www.rsc.org/images/entities/char_2009.gif) 1) was obtained. Both Brønsted and Lewis acid sites were maintained on the recycled catalysts after calcination (Fig. S7†). However, a loss of total acid sites to 0.23 mmol g−1 (by 14.8%) was observed. Therefore, the loss of metal content and total acid sites might be responsible for the decreased LA yield. A low reaction temperature and a dilute substrate solution were expected to be beneficial to maintain the catalytic activity of the catalysts; therefore, an intensified reaction process may need further research to investigate the potential of the current sample for use during the conversion of carbohydrates.
1) was obtained. Both Brønsted and Lewis acid sites were maintained on the recycled catalysts after calcination (Fig. S7†). However, a loss of total acid sites to 0.23 mmol g−1 (by 14.8%) was observed. Therefore, the loss of metal content and total acid sites might be responsible for the decreased LA yield. A low reaction temperature and a dilute substrate solution were expected to be beneficial to maintain the catalytic activity of the catalysts; therefore, an intensified reaction process may need further research to investigate the potential of the current sample for use during the conversion of carbohydrates.
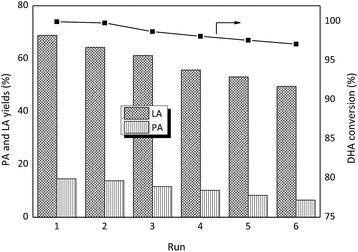 | ||
| Fig. 13 SnO2/NbOPO4-CTAB catalyst reusability for DHA conversion (conditions: 0.222 M DHA, 50 mg catalysts, 140 °C, 2 h). | ||
3.8. Proposed mechanism
The catalytic effects of the SnO2/NbOPO4-CTAB sample were investigated for both the overall reaction of DHA to LA (Fig. 8) and the conversion of PA to LA (Fig. 9). According to the physicochemical analysis and FTIR study, tin and niobium existed in the form of tetragonal SnO2 and a crystallized NbOPO4 species. The partially hydrolyzed framework tin and niobium species were responsible for the presence of Lewis acid sites,39,50 and the P–OH groups resulted in Brønsted acid sites (Scheme 1). The Lewis acid sites were believed to accelerate the keto–enol tautomerization of DHA and the subsequent dehydration by coordination with the carbonyl and hydroxyl groups to form PA.49 The conversion of DHA to LA could also be catalyzed by Brønsted acid sites, as shown for the reaction of DHA in a blank experiment (Table 1, entry 1). Moreover, the reverse reaction from PA to DHA might occur in the current study because both GLA and DHA were observed when PA was used as the substrate (Fig. 10). This reaction was believed to be catalyzed by the Lewis acid sites (see Scheme 1, the dashed route).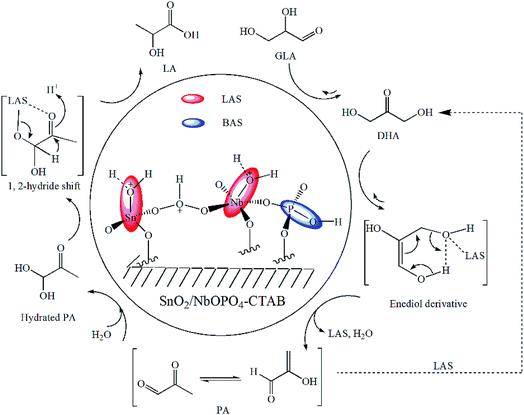 | ||
| Scheme 1 Possible reaction mechanism for the conversion of triose sugars to LA over SnO2/NbOPO4-CTAB.49 | ||
Previously, the dehydration of DHA to PA was demonstrated to be the rate-determining step.18 However, the current reaction network appeared to be dominated by the rehydration and isomerization of PA to LA, according to the reaction profile (Fig. 8), because the high total number of acid sites of SnO2/NbOPO4 efficiently facilitated the rearrangement and dehydration reaction of DHA. The isomerization of the intermediate PA to LA involves a MPVO-type redox reaction of the hydrated PA (catalyzed by the Lewis acid sites) in which a 1,2-hydride shift occurs in a concerted fashion (Scheme 1).
Overall, the coordination of Brønsted acidity and Lewis acidity along with the medium acid sites on the catalyst surface was believed to act synergistically to allow for the good catalytic activity.51 Moreover, further efforts to extend the application of the system to the direct transformation of complicated sugars to platform chemicals are on-going in our group.
3.9. Dehydration of sugars to furan derivatives in an aqueous solution
5-Hydroxymethylfurfural (5-HMF) and furfural have been identified as important biorefining intermediates for the production of solvents, polymers, fine chemicals and plastics.52 The synthesis of such furan derivatives from carbohydrates is generally carried out by the copresence of basic or Lewis and Brønsted acid catalysts. Therefore, the NbOPO4 catalysts prepared currently with both Lewis and Brønsted acid sites were further applied to the aqueous phase conversion of sugars, such as sucrose, glucose, xylose, maltose, and fructose. The results of substrate conversion and products yields are provided in Table 2 and Table S2.† Due to their strong acidic properties, both niobium phosphate catalysts could only provide a minute amount of LA. The products were dominated by 5-HMF or furfural, which resulted from isomerization and dehydration reactions. Comparable conversions were observed for those sugars over CTAB-modified niobium phosphates with or without tin oxides. For NbOPO4-CTAB catalysts without tin oxides, the yield of 5-HMF ranged from 28.5% to 44%, except for sucrose and xylose. The 5-HMF yield from maltose was significantly higher than that from sucrose, which is in contrast to previous reports.53 Moreover, glucose demonstrated the highest 5-HMF yield, which was even higher than fructose. This is interesting because glucose was believed to be isomerized into fructose at the initial stages of the dehydration reaction.54 The production of 5-HMF from fructose was proposed to be easier, although it was not the case under the current reaction conditions. In fact, Hara et al. has demonstrated that stepwise dehydration of glucose forms HMF over anatase TiO2 and phosphate/TiO2 catalysts.55 The dominant product from the dehydration of xylose was furfural (3.2% in yield) due to its pentose structure.| Entry | Substrate | NbOPO4-CTAB | SnO2/NbOPO4-CTAB | ||||
|---|---|---|---|---|---|---|---|
| Conv. (%) | 5-HMF | Furfural | Conv. (%) | 5-HMF | Furfural | ||
| a Reaction conditions: 60 mg sugars, 3 mL water, 30 mg catalyst, T = 413 K, t = 1 h. | |||||||
| 1 | Sucrose | 55.3 | 5.5 | 0.2 | 51.1 | 5.7 | 4.2 |
| 2 | Glucose | 87.1 | 44.0 | 0.1 | 90.2 | 12.8 | 4.1 |
| 3 | Xylose | 83.5 | — | 3.2 | 88.5 | 0.0 | 21.0 |
| 4 | Maltose | 68.6 | 28.5 | 0.1 | 70.3 | 15.2 | 0.1 |
| 5 | Fructose | 91.2 | 29.9 | 4.4 | 89.1 | 17.9 | 4.3 |
Compared with bare NbOPO4, NbOPO4 with the incorporation of SnO2 could lead to a significantly promoted furfural yield of 21.0% from the dehydration of xylose. The SnO2/NbOPO4 modified by P123, F127, and SDBS led to higher furfural yields (29.0%, 23.4%, and 24.1%, respectively) than that modified by CTAB (Table S2†). However, the yields of 5-HMF from other sugars were generally lower, and only a yield of 17.9% was obtained from fructose. The 5-HMF yield from glucose was significantly decreased to 12.8%. On one hand, the acidity property contributed to the dehydration reaction of those sugars. On the other hand, the interaction of Nb and Sn in the catalyst significantly influences the product distribution and promotes the dehydration of pentose. The effect of tin incorporation could not be simply explained by the surface acidity of SnO2/NbOPO4-CTAB, especially considering the yield of 5-HMF from fructose. Therefore, the effect of tin incorporation requires further exploration.
4. Conclusions
This work presented a preliminary study on the feasibility of the use of tin oxide-modified niobium phosphates for the isomerization of triose sugars to LA in water. The incorporation of SnO2 and surfactants significantly affected the surface acidity of niobium phosphates. The product distribution was closely related to the reaction temperatures, catalyst loading, substrate concentrations, and reaction times. An almost quantitative yield (ca. 92%) of LA was obtained by using the cationic surfactant-modified sample. A plausible reaction mechanism suggesting the origin of acid sites was proposed. Moreover, the crystalline niobium phosphates with or without tin oxides were effective for the conversion of sugars to 5-HMF and furfural. This protocol will serve as an efficient method for the development of novel solid acid catalysts. Currently, further efforts to extend the application of the catalysts to other solid acid catalyzed conversion reactions of carbohydrates (especially the traditional protonic acid catalyzed reactions) are ongoing in our group.Conflicts of interest
There are no conflicts to declare.Acknowledgements
This project was supported by Beijing Natural Science Foundation (2184101) and Beijing Education Committee Science and Technology Project (KM201810017001).Notes and references
- A. Corma, S. Iborra and A. Velty, Chem. Rev., 2007, 107, 2411–2502 CrossRef CAS PubMed.
- D. Esposito and M. Antonietti, Chem. Soc. Rev., 2015, 44, 5821–5835 RSC.
- C. Chatterjee, F. Pong and A. Sen, Green Chem., 2015, 17, 40–71 RSC.
- E. Taarning, C. M. Osmundsen, X. Yang, B. Voss, S. I. Andersen and C. H. Christensen, Energy Environ. Sci., 2011, 4, 793–804 CAS.
- R. De Clercq, M. Dusselier and B. F. Sels, Green Chem., 2017, 19, 5012–5040 RSC.
- A. Morone, M. Apte and R. A. Pandey, Renewable Sustainable Energy Rev., 2015, 51, 548–565 CrossRef CAS.
- P. Gallezot, Chem. Soc. Rev., 2012, 41, 1538–1558 RSC.
- P. Mäki-Arvela, I. L. Simakova, T. Salmi and D. Y. Murzin, Chem. Rev., 2013, 114, 1909–1971 CrossRef PubMed.
- E. Farnetti, J. Kaspar and C. Crotti, Green Chem., 2009, 11, 704–709 RSC.
- J. Wang, Y. Masui and M. Onaka, Appl. Catal., B, 2011, 107, 135–139 CrossRef CAS.
- N. Razali and A. Z. Abdullah, Appl. Catal., A, 2017, 543, 234–246 CrossRef CAS.
- E. Taarning, S. Saravanamurugan, M. S. Holm, J. Xiong, R. M. West and C. H. Christensen, ChemSusChem, 2009, 2, 625–627 CrossRef CAS PubMed.
- E. M. Albuquerque, L. E. P. Borges and M. A. Fraga, J. Mol. Catal. A: Chem., 2015, 400, 64–70 CrossRef CAS.
- M. Morales, P. Y. Dapsens, I. Giovinazzo, J. Witte, C. Mondelli, S. Papadokonstantakis, K. Hungerbühler and J. Pérez-Ramírez, Energy Environ. Sci., 2015, 8, 558–567 CAS.
- E. M. Albuquerque, L. E. P. Borges and M. A. Fraga, Green Chem., 2015, 17, 3889–3899 RSC.
- X. Wang, F. Liang, C. Huang, Y. Li and B. Chen, Catal. Sci. Technol., 2015, 5, 4410–4421 CAS.
- S. M. Coman, M. Verziu, A. Tirsoaga, B. Jurca, C. Teodorescu, V. Kuncser, V. I. Parvulescu, G. Scholz and E. Kemnitz, ACS Catal., 2015, 5, 3013–3026 CrossRef CAS.
- F. de Clippel, M. Dusselier, R. Van Rompaey, P. Vanelderen, J. Dijkmans, E. Makshina, L. Giebeler, S. Oswald, G. V. Baron, J. F. M. Denayer, P. P. Pescarmona, P. A. Jacobs and B. F. Sels, J. Am. Chem. Soc., 2012, 134, 10089–10101 CrossRef CAS PubMed.
- X. Zhao, T. Wen, J. Zhang, J. Ye, Z. Ma, H. Yuan, X. Ye and Y. Wang, RSC Adv., 2017, 7, 21678–21685 RSC.
- P. T. Anastas and M. M. Kirchhoff, Acc. Chem. Res., 2002, 35, 686–694 CrossRef CAS PubMed.
- J. Jin, S. Guidi, Z. Abada, Z. Amara, M. Selva, M. W. George and M. Poliakoff, Green Chem., 2017, 19, 2439–2447 RSC.
- Q. Guo, F. Fan, E. A. Pidko, W. N. Van Der Graaff, Z. Feng, C. Li and E. J. Hensen, ChemSusChem, 2013, 6, 1352–1356 CrossRef CAS PubMed.
- P. Y. Dapsens, C. Mondelli and J. Perez-Ramirez, ChemSusChem, 2013, 6, 831–839 CrossRef CAS PubMed.
- J. Pang, M. Y. Zheng, X. S. Li, L. Song, R. Sun, J. Sebastian, A. Wang, J. Wang, X. D. Wang and T. Zhang, ChemistrySelect, 2017, 2, 309–314 CrossRef CAS.
- H. G. Bernal, A. M. R. Galletti, G. Garbarino, G. Busca and E. Finocchio, Appl. Catal., A, 2015, 502, 388–398 CrossRef CAS.
- N. K. Mal and M. Fujiwara, Chem. Commun., 2002, 22, 2702–2703 Search PubMed.
- Y. Wang, F. Jin, M. Sasaki, F. Wang, Z. Jing and M. Goto, AIChE J., 2013, 59, 2096–2104 CrossRef CAS.
- M. Cantero and S. Bruque, Solid State Ionics, 1993, 63–65, 501–505 CrossRef CAS.
- A. Dutta, A. K. Patra, S. Dutta, B. Saha and A. Bhaumik, J. Mater. Chem., 2012, 22, 14094–14100 RSC.
- T. Armaroli, G. Busca, C. Carlini, M. Giuttari, A. M. R. Galletti and G. Sbrana, J. Mol. Catal. A: Chem., 2000, 151, 233–243 CrossRef CAS.
- C. Schütz, T. Dwars, C. Schnorpfeil, J. Radnik, M. Menzel and U. Kragl, J. Polym. Sci., Part A: Polym. Chem., 2007, 45, 3032–3041 CrossRef.
- C. García-Sancho, I. Agirrezabal-Telleria, M. B. Güemez and P. Maireles-Torres, Appl. Catal., B, 2014, 152–153, 1–10 CrossRef.
- E. Rodríguez-Aguado, A. Infantes-Molina, D. Ballesteros-Plata, J. A. Cecilia, I. Barroso-Martín and E. Rodríguez-Castellón, Mol. Catal., 2017, 437, 130–139 CrossRef.
- J. L. Colón, D. S. Thakur, C. Y. Yang, A. Clearfield and C. R. Martini, J. Catal., 1990, 124, 148–159 CrossRef.
- D. Li, W. Ni and Z. Hou, Chin. J. Catal., 2017, 38, 1784–1793 CrossRef CAS.
- M. Casagrande, E. Moretti, L. Storaro, M. Lenarda, J. Gersich, L. Stievano and F. E. Wagner, Microporous Mesoporous Mater., 2006, 91, 261–267 CrossRef CAS.
- A. H. Jadhav, H. Kim and I. T. Hwang, Bioresour. Technol., 2013, 132, 342–350 CrossRef CAS PubMed.
- C. A. Emeis, J. Catal., 1993, 141, 347–354 CrossRef CAS.
- P. Carniti, A. Gervasini, F. Bossola and V. D. Santo, Appl. Catal., B, 2016, 193, 93–102 CrossRef CAS.
- K. Nakajima, Y. Baba, R. Noma, M. Kitano, J. N. Kondo, S. Hayashi and M. Hara, J. Am. Chem. Soc., 2011, 133, 4224–4227 CrossRef CAS PubMed.
- K. Nakajima, J. Hirata, M. Kim, N. K. Gupta, T. Murayama, A. Yoshida, N. Hiyoshi, A. Fukuoka and W. Ueda, ACS Catal., 2018, 8, 283–290 CrossRef CAS.
- X. Wang, F. Liang, C. Huang, Y. Li and B. Chen, Catal. Sci. Technol., 2016, 6, 6551–6560 CAS.
- C. B. Rasrendra, B. A. Fachri, I. G. B. N. Makertihartha, S. Adisasmito and H. J. Heeres, ChemSusChem, 2011, 4, 768–777 CrossRef CAS PubMed.
- R. M. West, M. S. Holm, S. Saravanamurugan, J. Xiong, Z. Beversdorf, E. Taarning and C. H. Christensen, J. Catal., 2010, 269, 122–130 CrossRef CAS.
- Y. Wang, W. Deng, B. Wang, Q. Zhang, X. Wan, Z. Tang, Y. Wang, C. Zhu, Z. Cao, G. Wang and H. Wan, Nat. Commun., 2013, 4, 2141 Search PubMed.
- Y. J. Pagán-Torres, J. M. R. Gallo, D. Wang, H. N. Pham, J. A. Libera, C. L. Marshall, J. W. Elam, A. K. Datye and J. A. Dumesic, ACS Catal., 2011, 1, 1234–1245 CrossRef.
- S. Lux and M. Siebenhofer, Catal. Sci. Technol., 2013, 3, 1380–1385 CAS.
- C. B. Rasrendra, I. G. B. N. Makertihartha, S. Adisasmito and H. J. Heeres, Top. Catal., 2010, 53, 1241–1247 CrossRef CAS.
- Y. Hayashi and Y. Sasaki, Chem. Commun., 2005, 21, 2716–2718 RSC.
- Y. Roman-Leshkov, M. Moliner, J. A. Labinger and M. E. Davis, Angew. Chem., Int. Ed., 2010, 49, 8954–8957 CrossRef CAS PubMed.
- L. Jiang, L. Zhou, J. Chao, H. Zhao, T. Lu, Y. Su, X. Yang and J. Xu, Appl. Catal., B, 2018, 220, 589–596 CrossRef CAS.
- L. Mika, E. Cséfalvay and A. Németh, Chem. Rev., 2018, 118, 505–613 CrossRef CAS PubMed.
- Z. Zhang, B. Du, L. Zhang, Y. Da, Z. Quan, L. J. Yang and X. Wang, RSC Adv., 2013, 3, 9201–9205 RSC.
- Z. Zhang, J. Song and B. Han, Chem. Rev., 2017, 117, 6834–6880 CrossRef CAS PubMed.
- R. Noma, K. Nakajima, K. Kamata, M. Kitano, S. Hayashi and M. Hara, J. Phys. Chem. C, 2015, 119, 17117–17125 CAS.
Footnote |
| † Electronic supplementary information (ESI) available. See DOI: 10.1039/c8se00140e |
| This journal is © The Royal Society of Chemistry 2018 |

