Electrochemical membrane cell for NH3 synthesis from N2 and H2O by electrolysis at 200 to 250 °C using a Ru catalyst, hydrogen-permeable Pd membrane and phosphate-based electrolyte
Kanako
Imamura
and
Jun
Kubota
 *
*
Department of Chemical Engineering, Fukuoka University, 8-19-1, Nanakuma, Jonan-ku, Fukuoka 814-0180, Japan. E-mail: jkubota@fukuoka-u.ac.jp
First published on 28th March 2018
Abstract
Ammonia (NH3) is an energy carrier that can be synthesized from nitrogen and water using electricity generated from renewable sources. The present work investigated NH3 synthesis using an electrochemical system with the structure of Ru/Cs+/MgO|Pd–Ag|CsH2PO4/SiP2O7|Pt and operating at 200 to 250 °C. In this system, the NH3 being generated is isolated from the CsH2PO4/SiP2O7 electrolyte by the hydrogen-permeable Pd–Ag membrane, resulting in the production of dry NH3. A maximum NH3 synthesis rate of 0.90 nmol s−1 cm−2 was obtained from the cathode at the Ru/Cs+/MgO|Pd–Ag side at a current density of 10 mA cm−2, temperature of 250 °C and N2 flow rate of 3 cm3 min−1 as converted to standard temperature and pressure. Deviations in the NH3 production rate from the theoretical amounts predicted by Arrhenius plots were observed at temperatures approaching 250 °C, possibly because the reaction approached equilibrium. A current efficiency for NH3 production of 2.6% was obtained, with the remainder of the current consumed during H2 generation. The apparent activation energies for the NH3 synthesis were 69 and 93 kJ mol−1 at 3.2 and 10 mA cm−2, respectively. These values are significantly lower than that reported for conventional NH3 synthesis from nitrogen and hydrogen (139 kJ mol−1) over the same catalyst in this cell. The optimum N2 flow rates were approximately 0.5 and 5 cm3 min−1 at 3.2 and 10 mA cm−2, respectively, representing nitrogen amounts approximately 42 times the stoichiometric quantities. The provision of an excess of N2 is believed to reduce the suppression of N2 activation by so-called hydrogen poisoning of the catalyst.
1. Introduction
Ammonia (NH3) is one of the most widely used chemical products on a worldwide basis; 170 to 180 million tons of NH3 are synthesized annually, using atmospheric N2 and H2 obtained from fossil fuels, via the so-called Haber–Bosh process.1–3 Over 80% of this NH3 is currently employed for production of artificial fertilizers, and is thus of vital importance to society.4–14 Recently, it has been demonstrated that NH3 can be directly used as a fuel in combustion engines14 and fuel cells15–18 and that it can be converted to H2 by catalytic decomposition.19,20 The emissions from these systems are ideally only N2 and H2O, which is advantageous compared to carbon-based fuels that emit CO2. The ready liquefaction of NH3 (which has a boiling point of −33.3 °C at 101 kPa and 20 °C at 860 kPa) is also an advantage. The mass-based percentage of H2 in NH3 is 17.6%, which is much higher than the levels in organic hydrides and hydrogen-storage alloys. In addition, a certain level of infrastructure for the transportation and storage of NH3 is already in place based on its current usage. Up to now, most hydrogen for the synthesis of NH3 has been obtained from the conversion of fossil fuels, so that the use of NH3 as a fuel appears counter-productive. However, if NH3 can be produced from N2 and H2O using renewable energy and without fossil fuels, it could represent a viable chemical energy carrier. Thus, the synthesis of NH3 using renewable energies has attracted significant attention as a means of achieving a sustainable energy society.Even using conventional technologies, NH3 could conceivably be synthesized by a combination of water electrolysis (based on renewable electricity sources such as wind, solar, and hydro) and the Haber–Bosh process.21–23 In fact, hydrogen derived from water electrolysis using hydroelectric energy has already been applied to NH3 synthesis. The one serious drawback associated with this system is that the Haber–Bosh process is highly exothermic, with a heat of reaction of 91 kJ mol−1.1–3 Therefore, considerable heat is released, and essentially wasted, during NH3 synthesis. Although water electrolysis is endothermic, the waste heat from NH3 synthesis cannot readily be employed for the latter process because the two processes are typically physically separated and run at different temperatures. If NH3 could be synthesized directly from nitrogen and water by electrolysis, this energy loss could be avoided.24–27 Furthermore, the direct electrochemical synthesis of NH3 should be able to proceed in association with small-scale fluctuating electrical power.24–27 In fact, both fuel cells and water electrolysis systems can operate in conjunction with dispersed off-grid power systems connected to fluctuating electric power. Therefore, the electrochemical synthesis of NH3 from nitrogen and water has attracted significant attention, and there has been much research in this field.24–27 An additional advantage of the direct electrochemical synthesis of NH3 is that the cathodic conditions are conducive to promote the electrochemical activation of N2 at the electrode interface as explained by the non-faradaic electrochemical modification of catalytic activity (NEMCA) effect.28,29 However, the presence of the NEMCA effect in the nitrogen activation and NH3 synthesis has been still controversial; some reports propose that NEMCA is negligibly weak,28,30 while the other report indicates the presence of electrochemical promotion.31
There have been many attempts to develop an electrochemical synthesis of NH3. Electrolysis using molten salt systems such as LiCl–KCl and LiCl–KCl–CsCl (at 300 and 450 °C, respectively) has been applied to the generation of NH3 from N2 and H2O.32,33 The electrochemical synthesis of NH3 using H+-conducting solid oxide electrolytes at 500 to 1000 °C has also been intensively studied.24–27,34 Based on the reaction equilibrium between NH3 and N2/H2, a low reaction temperature is preferred for NH3 formation. As such, regardless of the electrochemical potential of the electrode, NH3 is readily decomposed to N2 and H2 over various surfaces at higher temperatures. Electrolysis with phosphate electrolytes over the relatively low temperature range of 180 to 250 °C has been examined for this reason.35,36 Polymer electrolyte systems operating below 100 °C have also been studied by several researchers.24–27,37,38 However, although there have been numerous attempts at developing an electrochemical NH3 synthesis, working at a wide variety of temperatures, a system with a suitable level of efficiency has not yet been developed.24–27
As discussed, the electrochemical synthesis of NH3 involves various challenges. As an example, the reaction going from N2 and H2 to NH3 is exothermic and thus is unfavourable at high temperatures.1–3 For this reason, high temperature electrolysis in the range of 600–1000 °C using solid oxide electrolysis cells (SOECs), a range which is much higher than the typical Haber–Bosh temperature span of 400 to 500 °C, is not appropriate. At such high temperatures, NH3 is readily decomposed to N2 and H2 even when rapidly generated under electrochemical conditions. In contrast, at relatively low temperatures (below 100 °C), the chemical equilibrium favours the formation of NH3. Polymer electrolyte electrolysis cells (PEECs) can operate in this temperature range, although it is extremely difficult to promote the dissociative adsorption of N2 on solid-catalyst surfaces (that is, the activation of N2) at these temperatures.39 It is evident that solid electrolyte systems are helpful when working with gaseous reactants because the large surface area of the electrocatalysts would not be covered with the liquid electrolyte. On this basis, our own group has focused on the synthesis of NH3 in the range between 200 and 250 °C, in which solid oxoacid compounds may be employed as electrolytes. Among these, phosphates such as CsH2PO4 and CsH5(PO4)2 have been intensively studied with regard to applications in fuel cells,40–44 and so were examined in the present work.
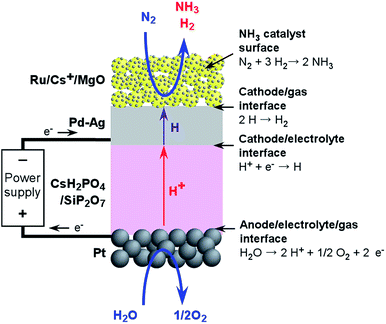
Another difficulty associated with the electrochemical synthesis of NH3 is that the resulting NH3 is readily exchanged with protons in the proton-conductive electrolyte and thus can be absorbed in various electrolytes, including water, because of the alkaline nature of NH3 and its affinity for water. Thus, we have proposed the use of hydrogen-permeable alloy membranes at the cathode interface to separate the NH3 and the acidic electrolyte. Fig. 1 presents a design summarizing the proposed system. The chemical reactions on the respective interfaces are also shown in Fig. 1. Here, hydrogen atoms penetrate the hydrogen-permeable membrane from the cathode/electrolyte interface to the cathode/gas interface, and react with nitrogen on the catalyst surfaces. Since NH3 synthesis is performed in isolation from the cathode/electrolyte interface, electrochemical effects such as NEMCA cannot be expected for nitrogen activation in this system, in contrast to the pure electrochemical synthesis of NH3 directly on the cathode catalyst surfaces. It has not been clarified whether the penetrated hydrogen atoms are transferred to NH3 catalyst surfaces directly with migration on the surfaces or through the gas phase with desorption and adsorption. In the present cell, NH3 is made without the application of an electrochemical potential, while the electrochemical potential of hydrogen penetrating the hydrogen membrane is controlled by the electrode potential of the hydrogen-permeable membrane.
Our previous communication described a system with the structure of Ru/Cs+/MgO|Pd–Ag|CsH2PO4/SiP2O7|Pt for the synthesis of NH3 from N2 and H2O at 250 °C and 1.2 V, and demonstrated the production of NH3 in this manner.45 However, the limited length of the prior publication precluded a detailed discussion of the associated kinetics and thermodynamics. The experimental techniques and apparatus in the previous work were also primitive in some parts, and have since been advanced. In this article, the kinetics and thermodynamics of this system are reported and improved NH3 production is discussed.
2. Experimental section
The electrochemical cell consisted of a Ru/Cs+/MgO catalyst, a Pd–Ag membrane, a CsH2PO4/SiP2O7 electrolyte and Pt paste. The schematic diagram of cell is illustrated in Fig. 2. The details of the materials and experimental procedures are provided in our previous communication and its ESI.45 A catalyst of 2 wt%-Ru/Cs+/MgO was prepared by impregnating MgO (Ube Material Industries, Ltd, 500A) with a tetrahydrofuran solution of Ru3(CO)12 (Furuya Metal Co., Ltd) with stirring for 8 h at room temperature. The resulting slurry was evaporated using a rotary evaporator below 50 °C at reduced pressure. The yellow powder resulting from this step was heated at 300 °C under vacuum to decompose the carbonyl groups, then impregnated with an aqueous solution of CsNO3 (Wako Pure Chemical Industries, Ltd) at room temperature, and finally dried using a rotary evaporator. The catalyst powder was subsequently heat treated in a tubular furnace at 300 °C under a 100 cmSTP3 min−1 H2 flow. Here, STP indicates that the volume has been converted to that at standard temperature and pressure (0 °C and 101 kPa). The resulting catalyst powder was formed into granules 600–800 μm in size using a hydraulic press.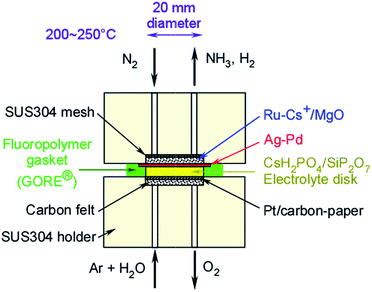 | ||
| Fig. 2 Diagram of the Ru/Cs+/MgO|Pd–Ag|CsH2PO4/SiP2O7|Pt cell for NH3 synthesis from N2 and H2O via electrolysis. | ||
A Pd–Ag membrane disk, 24 mm in diameter and 0.1 mm thick and containing 25% Ag on a molar basis, was purchased from the Nilaco Co.
The CsH2PO4/SiP2O7 electrolyte was synthesized by adding the desired amount of H3PO4 to an aqueous solution of CsCO3, followed by drying of the mixture at 120 °C for 24 h. In addition, H3PO4 was mixed with SiO2 and kneaded to obtain a viscous slurry that was subsequently calcined at 200 °C for 3 h and 700 °C for 3 h. The CsH2PO4 and SiP2O7 obtained from the above procedures were combined in a 1![[thin space (1/6-em)]](https://www.rsc.org/images/entities/char_2009.gif) :
:![[thin space (1/6-em)]](https://www.rsc.org/images/entities/char_2009.gif) 2 molar ratio and then crushed and mixed in a mortar. The resulting powder was formed into a disk 20 mm in diameter and 2 mm thick by a hydraulic press.
2 molar ratio and then crushed and mixed in a mortar. The resulting powder was formed into a disk 20 mm in diameter and 2 mm thick by a hydraulic press.
Pt paste (Tanaka Kikinzoku Kogyo K.K.) was applied to a 20 mm diameter section of carbon paper (Toray, TGP-H-120H) at a density of 3 mg-Pt per cm2. The Pd–Ag membrane, CsH2PO4/SiP2O7 electrolyte and Pt/carbon paper were then stacked on top of one another and hot-pressed at 3 MPa and 220 °C to obtain a membrane–electrolyte–electrode assembly. This assembly, together with 600 mg of the catalyst (191 mg cm−2) was placed in a stainless steel cell equipped with an electric heater and thermocouple. The cell was transferred to an oven and heated at 100 °C to avoid condensation of water being supplied through tubes connected to the cell.
A flow of N2 or N2 + H2 was sent to the cathode (Ru/Cs+/MgO) side of the apparatus using mass flow controllers. The anode (Pt/carbon paper) side was supplied with Ar at 10 cmSTP3 min−1 using a mass flow controller, with the addition of H2O at 0.016 cmliq3 min−1via a syringe pump. The gaseous products released from the cathode side were intermittently sampled and analysed using a gas chromatograph with a thermal conductivity detector (GC-TCD, GL Sciences, GC-3200) to estimate the concentration of H2. Otherwise, the gases were bubbled through a stirred 25 ml quantity of an aqueous 1 mM H2SO4 solution to allow the amount of NH3 produced to be determined based on decreases in the electrical conductivity of the solution.
Prior to the electrochemical NH3 synthesis, a N2 + H2 mixture was passed through the cathode side at 250 °C for at least 8 h to reduce the Ru catalyst. After the NH3 synthesis was observed to achieve equilibrium conditions, the H2 flow was cut and electrolysis was initiated.
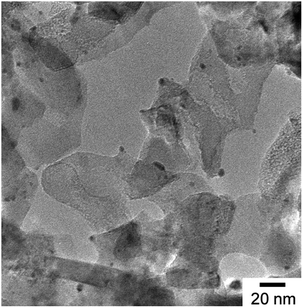
Transmission electron microscopy (TEM) images were obtained using a JEOL JEM-2100F at Kyushu University, Japan and a TEM image of the Ru/Cs+/MgO is shown in Fig. 3. Small black particles with diameters of several nm are evident on MgO particles with sizes of several tens of nm. It is also apparent that the Ru is well dispersed as nm-scale particles on the MgO.
3. Results and discussion
3.1 NH3 synthesis from N2 and H2O
The amounts of NH3 formed over time at various temperatures are summarized in Fig. 4. The quantities of NH3 obtained in each trial were determined from changes in the electro-conductivity of the 1 mM H2SO4 solution that absorbed the gases exiting the cell. NH3 formation is seen to increase monotonically over time in each case, such that the rates of formation at each temperature could be estimated from the slopes. During these trials, the cell was operated at a constant current of 10 mA cm−2 and the N2 flow to the cathode was 3 cmSTP3 min−1. The highest NH3 formation rate of 0.90 nmol s−1 cm−2 was obtained at 250 °C. The 2 wt%-Ru/Cs+/MgO catalyst loading of 191 mg cm−2 corresponds to a mass-based reaction rate of 17.0 μmol h−1 g−1. Previously, a NH3 synthesis rate over a 2 wt%-Ru/Cs+/MgO catalyst of approximately 1 mmol g−1 was reported at 315 °C and 101 kPa.45,46 Assuming that the apparent activation energy for NH3 synthesis is 139 kJ mol in this temperature region (see the subsequent discussion), the NH3 generation rate at 315 °C should be 35 times that at 250 °C, and so the value of 17.0 μmol h−1 g−1 obtained in this work is reasonable. As outlined further on, the rate of NH3 formation was limited by the chemical equilibrium of the synthesis reaction, such that the rate was less than the theoretical value.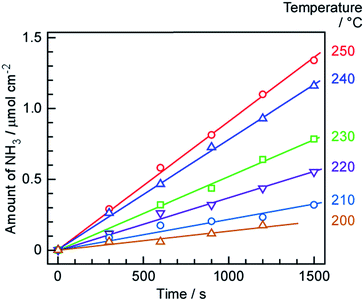 | ||
| Fig. 4 Time courses of NH3 formation at various temperatures and 10 mA cm−2, using N2 as the cathode gas at 3 cmSTP3 min−1. | ||
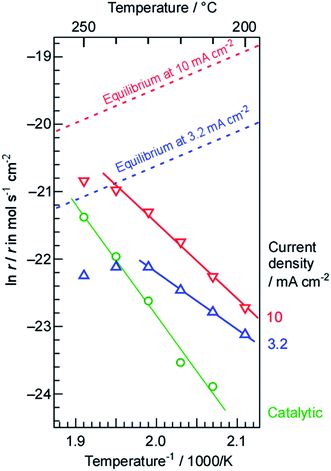
The NH3 formation rates at current densities of 3.2 and 10 mA cm−2 are shown as Arrhenius plots in Fig. 5, along with the rates obtained from a mixture of N2 and H2 in the present cell without electrolysis. It is evident that the absolute rates of NH3 formation at both current densities were much higher than that for catalytic NH3 formation from the mixture of N2 and H2 below 230 °C, even when the N2 and H2 flows were higher than that for the electrolysis. It should also be noted that the current density of 10 mA cm−2 was equivalent to a H2 flow of only 0.22 cmSTP3 min−1. The apparent activation energy values for NH3 formation using electrolysis at 3.2 and 10 mA cm−2 were estimated to be 69 and 93 kJ mol−1, respectively. In contrast, the apparent activation energy for NH3 formation from N2 and H2 was 139 kJ mol−1, which is slightly higher than previously reported values, possibly because of the relatively low temperature compared to those typically applied for NH3 synthesis (300 to 500 °C).45,46 It may also be that adsorbed intermediate species behaved as inhibitors to increase the apparent activation energy. Since the apparent activation energy for NH3 formation via electrolysis was not far from that for a more typical NH3 synthesis, the rate determining process in the present system is believed to be the dissociative adsorption of N2 on the Ru/Cs+/MgO catalyst, just as in a standard NH3 synthesis.1,46,47
It should be noted that the apparent activation energy for NH3 synthesis via electrolysis was lower than that for synthesis from a mixture of N2 and H2 without electrolysis. In addition, the absolute rates of NH3 formation with electrolysis were higher than those without the electrolysis. The H2 transport rates from the Pd–Ag membrane to the Ru catalyst side were estimated to be 17 and 52 nmol s−1 cm−2 based on current densities of 3.2 and 10 mA cm−2, respectively; N2 flow rates of 1 and 3 cmSTP3 min−1 are equivalent to 240 and 710 nmol s−1 cm−2. Therefore, the amount of N2 provided to the Ru catalyst was approximately 42 times (H2/N2 = 0.071) the stoichiometric quantity (H2/N2 = 3) based on the amount of H2. As demonstrated in the following section, this flow rate was almost optimum for the applied current density. Ru-based NH3 catalysts are known to undergo so-called hydrogen poisoning, such that the reaction order for NH3 synthesis with respect to H2 pressure is typically negative (−1.0 to −0.1, except for a few rare cases).46 In the case of Ru catalysts, hydrogen covers the Ru surfaces to block the dissociative adsorption of N2. Therefore, we conclude that the lower apparent activation energy for NH3 synthesis with electrolysis resulted from the excess N2 flow. The dependence of the rate of NH3 formation on the N2 flow rate is examined in Section 3.2.
Another important aspect of the Arrhenius plots is the deviation from the theoretical slope at relatively high temperatures. Because NH3 synthesis is exothermic, the chemical equilibrium can limit the reaction rate at high temperatures. The thermodynamic limits by the chemical equilibrium of NH3 with N2 flow and H2 from the electrolysis were estimated against the present H2/N2 ratio at respective temperatures as discussed in Section 3.3, and they are also shown in Fig. 5 by dashed lines. Evidently, the rates of NH3 formation approach the equilibrium limits shown by the dashed lines around 250 °C. Thus, this deviation from the Arrhenius slope around 250 °C can be reasonably explained from that the reaction approaches equilibrium.
The NH3 formation rates and current efficiencies for NH3 and H2 are summarized in Table 1. Current efficiency, also known as faradaic efficiency (FE), is defined as24–27
![[thin space (1/6-em)]](https://www.rsc.org/images/entities/char_2009.gif) 500C mol−1) and the electric charge through the cell (C), respectively. The Faraday reaction in the present system involved only the reduction of protons to hydrogen atoms, such that NH3 was produced without any charge transfer reaction. Therefore, in this paper, FE indicates the total current efficiency associated with the production of NH3 and H2 in the cell. That is, it is the ratio of the actual to the ideal amounts of H2 electrolyzed to NH3. The theoretical thermodynamic equilibrium was calculated as described in Section 3.3. The degree of attainment of equilibrium (%), AE, for NH3 formation was estimated as listed in Table 1. At 10 mA cm−2, 3 cmSTP3 min−1 and 250 °C, approximately 2.6% of the current was used for NH3 formation, while the remaining part was employed for H2 formation (based on GC analysis). It should be noted that an experimental error of about ±5% was associated with the estimated rates of formation of NH3 and H2 in this work. The sum of the current efficiencies for NH3 and H2 was almost 100% above 220 °C. It is therefore evident that detrimental processes, such as the emission of H2 from the Pd–Ag membrane to the anode side and leakage of O2 around the anode to the Pd–Ag side through the electrolyte, occurred to a minimal extent. At 10 mA cm−2, the sum of the current efficiencies was slightly below 100% at 200–210 °C. It is possible that the H2 and O2 products underwent cross-over in the cell to reduce the current efficiency. The sum of the current efficiencies was also less than 100% at 0.5–1.0 cmSTP3 min−1 and 3.2 mA cm−2, due to the experimental error in accurately setting the N2 flow rate via the mass flow controller at low flows. The concentration of H2 in the product gas was based on the amount of N2, so that any error in the N2 flow rate was directly reflected in the estimated rate of H2 formation.
500C mol−1) and the electric charge through the cell (C), respectively. The Faraday reaction in the present system involved only the reduction of protons to hydrogen atoms, such that NH3 was produced without any charge transfer reaction. Therefore, in this paper, FE indicates the total current efficiency associated with the production of NH3 and H2 in the cell. That is, it is the ratio of the actual to the ideal amounts of H2 electrolyzed to NH3. The theoretical thermodynamic equilibrium was calculated as described in Section 3.3. The degree of attainment of equilibrium (%), AE, for NH3 formation was estimated as listed in Table 1. At 10 mA cm−2, 3 cmSTP3 min−1 and 250 °C, approximately 2.6% of the current was used for NH3 formation, while the remaining part was employed for H2 formation (based on GC analysis). It should be noted that an experimental error of about ±5% was associated with the estimated rates of formation of NH3 and H2 in this work. The sum of the current efficiencies for NH3 and H2 was almost 100% above 220 °C. It is therefore evident that detrimental processes, such as the emission of H2 from the Pd–Ag membrane to the anode side and leakage of O2 around the anode to the Pd–Ag side through the electrolyte, occurred to a minimal extent. At 10 mA cm−2, the sum of the current efficiencies was slightly below 100% at 200–210 °C. It is possible that the H2 and O2 products underwent cross-over in the cell to reduce the current efficiency. The sum of the current efficiencies was also less than 100% at 0.5–1.0 cmSTP3 min−1 and 3.2 mA cm−2, due to the experimental error in accurately setting the N2 flow rate via the mass flow controller at low flows. The concentration of H2 in the product gas was based on the amount of N2, so that any error in the N2 flow rate was directly reflected in the estimated rate of H2 formation.
| Current mA cm−2 | N2 flowa cm3 min−1 | Temp. °C | r NH3 nmol s−1 cm−2 | FENH3c % | AEd % | FEH2e % |
|---|---|---|---|---|---|---|
| a Flow rates are in standard temperature and pressure, cmSTP3 min−1. b Rate of NH3 formation. c Current efficiency for NH3 formation. d Degree of attainment of thermodynamic equilibrium. e Current efficiency for H2 formation. | ||||||
| 10 | 3.0 | 200 | 0.14 | 0.39 | 2.2 | 85 |
| 210 | 0.22 | 0.62 | 4.3 | 95 | ||
| 220 | 0.37 | 1.1 | 9.4 | 100 | ||
| 230 | 0.52 | 1.5 | 16 | 101 | ||
| 240 | 0.78 | 2.3 | 29 | 102 | ||
| 250 | 0.90 | 2.6 | 41 | 103 | ||
| 3.2 | 0.5 | 250 | 0.17 | 1.5 | 24 | 65 |
| 1.0 | 0.28 | 2.5 | 40 | 82 | ||
| 2.0 | 0.27 | 2.5 | 38 | 95 | ||
| 5.0 | 0.18 | 1.6 | 25 | 103 | ||
| 7.0 | 0.15 | 1.4 | 21 | 100 | ||
3.2 Dependence on the flow rate of N2
As discussed in Section 3.1, the optimal N2 flow rate greatly exceeded the stoichiometric requirement based on the amount of H2. Thus, it is possible that lowering the N2 flow rate may increase the rate of NH3 formation. In fact, our previous work indicated that the rate of NH3 formation increased upon decreasing the N2 flow rate, and so the N2 flow rate to the Ru/Cs+/MgO side was varied to investigate the kinetics of the present system. The results are shown in Fig. 6, and demonstrate that the maximum NH3 formation rates were 0.5 to 1.0 and 5 to 7 cmSTP3 min−1 at current densities of 3.2 and 10 mA cm−2, respectively. As discussed in Section 3.1, the N2 flow rate was 42 times higher (H2/N2 = 0.071) than the stoichiometric requirement at 1.0 cmSTP3 min−1 and 3.2 mA cm−2. However, the maximum rate of NH3 formation was obtained at a similarly unbalanced ratio of N2 and H2. Based on chemical equilibrium, the stoichiometric ratio of N2 to H2 should provide the highest rate of NH3 formation, as discussed in Section 3.3. This is in agreement with our previous observation that the NH3 production rate was increased when reducing the N2 flow rate over the range between 1 and 7 cmSTP3 min−1 at 3.2 mA cm−2.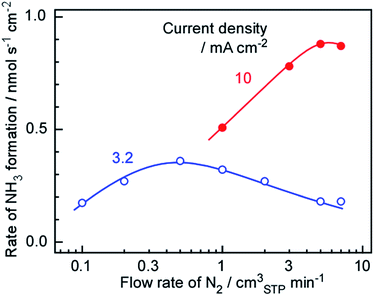 | ||
| Fig. 6 Rate of NH3 formation as a function of the flow rate of N2 at 250 °C and current densities of 3.2 (filled circles) and 10 mA cm−2 (solid circles). | ||
There are two possible reasons why the NH3 formation was reduced along with the N2 flow rate in the present study. The most likely cause is that NH3 synthesis on the Ru catalyst was greatly suppressed by increase in the proportion of H2. That is, hydrogen poisoning of the catalyst decreased the rate of NH3 formation at lower N2 flow rates, meaning that an excess of N2 is required to avoid this effect. The other possibility is that this cell operated under very complex conditions. In this apparatus, NH3 is synthesized on the catalyst layer under a counter-flow of N2 and H2, but there is no evidence that the N2 and H2 undergo typical counter-flow diffusion. It may be that local flow channels are formed in the catalyst layer and various hydrodynamic effects become important. Although the latter effect should be considered, it is thought that the decreased synthesis rate at lower N2 flows resulted primarily from hydrogen poisoning.
3.3 Chemical equilibrium of NH3 synthesis
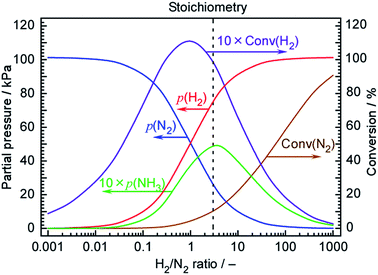
The Arrhenius plots in Fig. 5 suggest that the rate of NH3 formation was close to that expected from the chemical equilibrium among N2, H2 and NH3 at 250 °C. Fig. 7 plots the theoretical NH3 partial pressures at 250 °C and a total pressure of 101.3 kPa as calculated using 46.1 kJ mol−1 as the heat of formation for NH3 (ΔH0f) and −16.5 kJ mol−1 as the Gibbs energy change for the reaction (ΔG0r). The temperature-dependent molar specific heats at constant pressure used in these calculations were48| N2: 28.9–1.57 × 10⁻³T + 8.08 × 10⁻⁶T2 − 2.87 × 10⁻⁹T3 (J mol−1 K−1), |
| H2: 29.1–1.92 × 10⁻³T + 4.00 × 10⁻⁶T2 − 8.70 × 10⁻¹⁰T3 (J mol−1 K−1), |
| NH3: 27.6 + 2.56 × 10⁻²T + 9.91 × 10⁻⁶T2 − 6.69 × 10⁻⁹T3 (J mol−1 K−1), |
![[thin space (1/6-em)]](https://www.rsc.org/images/entities/char_2009.gif) :
:![[thin space (1/6-em)]](https://www.rsc.org/images/entities/char_2009.gif) 3) will generate 5.1 kPa of NH3, where 10% of the N2 and 10% of the H2 are converted to NH3. However, as discussed above, a 42-fold excess of N2 was supplied to the cell, such that the H2/N2 ratio was 0.071. At this ratio, only 0.27 kPa of NH3 and 6.4% H2 conversion would be expected. Thus, FEs of 6.4 and 93.6% for NH3 and H2 formation are thermodynamic limits in this H2/N2 ratio at 250 °C. The current efficiency for NH3 formation obtained during this trial was 2.6%, which is close to half the equilibrium limitation. Therefore, the deviations seen in the Arrhenius plots at high temperature can be reasonably considered to be due to the effects of chemical equilibrium. To obtain the degree of attainment of thermodynamic equilibrium in Table 1, the equilibrium limits in the range between 200 and 250 °C were similarly estimated. At 200 °C, the thermodynamic limit was estimated as 18% in this H2/N2 ratio, indicating that the lower temperature is preferable for higher NH3 production in the view point of chemical equilibrium.
3) will generate 5.1 kPa of NH3, where 10% of the N2 and 10% of the H2 are converted to NH3. However, as discussed above, a 42-fold excess of N2 was supplied to the cell, such that the H2/N2 ratio was 0.071. At this ratio, only 0.27 kPa of NH3 and 6.4% H2 conversion would be expected. Thus, FEs of 6.4 and 93.6% for NH3 and H2 formation are thermodynamic limits in this H2/N2 ratio at 250 °C. The current efficiency for NH3 formation obtained during this trial was 2.6%, which is close to half the equilibrium limitation. Therefore, the deviations seen in the Arrhenius plots at high temperature can be reasonably considered to be due to the effects of chemical equilibrium. To obtain the degree of attainment of thermodynamic equilibrium in Table 1, the equilibrium limits in the range between 200 and 250 °C were similarly estimated. At 200 °C, the thermodynamic limit was estimated as 18% in this H2/N2 ratio, indicating that the lower temperature is preferable for higher NH3 production in the view point of chemical equilibrium.
These results suggest that further improvements in the NH3 formation rate could be obtained by employing a H2/N2 ratio closer to the stoichiometric value at H2/N2 = 3. Despite this, the optimal N2 flow rate in Fig. 6 is far from the stoichiometric ratio and the development of catalysts for which stoichiometric H2/N2 ratios are optimized is required. The development of catalysts that are resistant to hydrogen poisoning will therefore be required to realize further improvements.
During the electrochemical synthesis of NH3, the limitations imposed by chemical equilibrium are evidently important, because NH3 is readily decomposed to N2 and H2 even if a greater quantity of NH3 is electrochemically synthesized by a potential effect.
3.4 Current–voltage properties
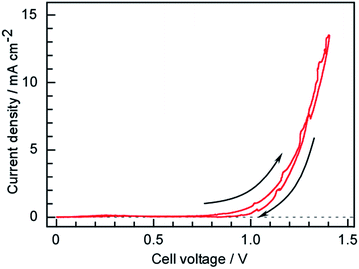
The current–voltage characteristics of the present cell having a Ru/Cs+/MgO|Pd–Ag|CsH2PO4/SiP2O7|Pt structure were ascertained via voltage cycling between 0 and 1.4 V at a sweep rate of 0.2 mV s−1 as shown in Fig. 8. Here, the voltage is defined as the anode potential against the cathode potential. A current appeared around 0.8 V, which is much lower than the theoretical value of 1.15 V for water electrolysis at 250 °C under standard pressure conditions. The partial pressure of H2 in the Ru catalyst layer was far below 101 kPa due to the excess flow of N2. O2 produced in the anode side was also purged by Ar resulting in the small partial pressure of O2. Because H2 at the cathode surface and O2 at the anode surface were purged by N2 and Ar reducing the partial pressures of H2 and O2, respectively, the practical cell voltage for water electrolysis to form H2 and O2 became lower than the theoretical value for the standard pressure. The current exponentially increased with increasing voltage, indicating that the current was determined by electrochemical reaction kinetics in accordance with the Tafel equation.3.5 Time courses of the cell voltage
The cell voltage values obtained over time during constant current operation are plotted in Fig. 9. At 3.2 mA cm−1, the voltage was constant at 1.03 V for longer than 800 min, in agreement with the behaviour observed in our previous work. In fact, the voltage was found to remain stable over several days, with intermittent starts and stops, when the cell was operated at approximately 3.2 mA cm−1. However, at 10 mA cm−1, the cell voltage increased with time and this increase was exponential after 600 min. This result demonstrates that some components of the cell were degraded at the higher current density. At present, the cause of this degradation is unclear and additional research is needed to improve the component materials, such as the Ru catalyst, Pd–Ag membrane, electrolyte and anode, as well as to optimize the auxiliary parts, such as the electric conductors, inner cell walls and gaskets.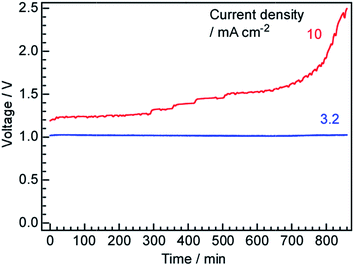 | ||
| Fig. 9 Time courses of the cell voltage at current density values of 3.2 and 10 mA cm−2 at 250 °C using N2 as the cathode gas at 3 cmSTP3 min−1. | ||
3.6 General discussion
This work examined the applicability of a Ru/Cs+/MgO|Pd–Ag|CsH2PO4/SiP2O7|Pt cell to NH3 synthesis from N2 and H2O. It was found that the rate of NH3 formation was limited by chemical equilibrium. The present FE of NH3 formation was 2.6% but the equilibrium limit of NH3 formation was 6.4% of H2 conversion. To improve the rate of NH3 formation, lowering the temperature of the cell can be generally considered. The equilibrium limit of NH3 formation increases with decreasing temperature because of the exothermic reaction of NH3 synthesis. However, the activity of the present catalyst was not sufficient to achieve equilibrium especially around 200 °C. The development of more active catalysts is required for further improvement of the cell. More active catalysts can also reduce the thickness of the catalyst layer. The thickness of the catalyst layer of the present cell is ca. 2 mm, but that below a few hundred μm is more preferable for achieving a variety of designs of electrochemical cells.A H2/N2 ratio close to the stoichiometric value is expected to give a higher rate of NH3 formation in the view point of chemical equilibrium. However, the Ru/Cs+/MgO catalyst is prone to hydrogen poisoning and so decreasing the N2 flow does not enhance NH3 generation. Thus, limiting the hydrogen poisoning of the Ru catalyst might be the next challenge. Recently, several newer NH3 catalysts have been proposed, some of which have been reported to exhibit minimal hydrogen poisoning.49–51 As an example, the addition of lanthanide compounds to Ru catalysts has been found to reduce this effect.51,52 At present, hydrogen poisoning is the most viable explanation for the need to provide an unbalanced H2/N2 ratio to maximize the rate of NH3 formation.
One advantage of this cell is that the water electrolysis and NH3 synthesis components are thermally equilibrated in a single unit, resulting in thermodynamics equivalent to those for the pure electrochemical synthesis of NH3. As such, the exothermic and endothermic NH3 synthesis and water electrolysis processes balance out, leading to a highly efficient device without appreciable heat loss, just as in the pure electrochemical synthesis of NH3. Among the elemental steps that occur during the electrochemical synthesis of NH3, including the reduction of H+ to H(ads) (where “ads” refers to an adsorbed species), the activation of N2 to form N(ads) and the hydrogenation of N(ads) by H(ads) to give NH(ads), NH2(ads) and NH3(ads), the sole faradaic process is the first one. It remains uncertain whether or not the application of an electrochemical potential activates N2 to produce N(ads) or promotes the hydrogenation of N(ads) by H(ads), but these elemental steps are not faradaic reactions involving charge transfer. In this sense, the present system can be regarded as comparable to the electrochemical synthesis of NH3. Furthermore, because of the isolation of the NH3 formation catalyst from the electrode interface by the hydrogen membrane, the NH3 product is not contaminated with the water that is required for water electrolysis. In addition, the poisoning of the catalyst by humidity is not an issue in the present system.
Proton-conductive polymer membrane electrolytes could also potentially be used in this cell in place of phosphate electrolytes, as the former have already found practical applications in water electrolysis. If the operating temperature could be reduced to approximately 100 °C, these polymer membranes could become feasible. Non-precious metal hydrogen-permeable membranes also have potential in the present system.53,54 In fact, hydrogen-membrane fuel cells have been proposed,55–57 and show promise as electrochemical systems. At present, we have not successfully applied alternative catalysts, hydrogen-permeable membranes or electrolytes, but these are all still possibilities. Thus, since the selection of materials for use in this work was limited and there is room to improve the system, it is thought that the fusion of technological improvements in catalysis, hydrogen-permeable membranes, and proton-conductive electrolytes will lead to further evolution of this system.
4. Conclusions
NH3 synthesis using a Ru/Cs+/MgO|Pd–Ag|CsH2PO4/SiP2O7|Pt cell was investigated in the temperature region between 200 and 250 °C. The temperature dependence of the NH3 formation rate indicated that the rate was influenced by the chemical equilibrium that occurs at high temperatures. The apparent activation energies of the present system were estimated to be 69 and 93 kJ mol−1 at 3.2 and 10 mA cm−2, respectively, both of which are significantly lower than that for conventional NH3 synthesis from N2 + H2 (139 kJ mol−1). The current efficiency for NH3 formation was estimated to be 2.6%, with the remaining current going to H2 formation. The optimum N2 flow rates for NH3 formation were 0.5 to 1.0 and 5 to 7 cmSTP3 min−1 at current densities of 3.2 and 10 mA cm−2, respectively, both of which are significantly greater than the stoichiometric amounts. The cell was operated in a stable manner for longer than 800 min at 1.03 V and 3.2 mA cm−2, although performance degradation within 800 min was observed at 10 mA cm−2.Conflicts of interest
The authors declare no conflict of interest.Acknowledgements
This work was supported as a project under the “Creation of Innovative Core Technology for Manufacture and Use of Energy Carriers from Renewable Energy” CREST program of the Japan Science and Technology Agency (JST).Notes and references
- A. Ozaki and K. Aika, Catalysis-Science and Technology, ed. J. R. Anderson and M. Boudart, Springer-Verlag KG, Berlin, 1981, vol. 1, pp. 87–158 Search PubMed.
- Ammonia: Catalysis and Manufacture, ed. A. Nielsen, Springer-Verlag, Berlin Heidelberg, 1995 Search PubMed.
- H. Liu, Ammonia Synthesis Catalysts: Innovation and Practice, World Scientific, Singapore, 2013 Search PubMed.
- L. Green Jr, Int. J. Hydrogen Energy, 1982, 7, 355–359 CrossRef.
- W. H. Avery, Int. J. Hydrogen Energy, 1988, 13, 761–773 CrossRef CAS.
- C. H. Christensen, T. Johannessen, R. Z. Sørensen and J. K. Nørskov, Catal. Today, 2006, 111, 140–144 CrossRef CAS.
- C. Zamfirescu and I. Dincer, J. Power Sources, 2008, 185, 459–465 CrossRef CAS.
- C. Zamfirescu and I. Dincer, Fuel Process. Technol., 2009, 90, 729–737 CrossRef CAS.
- F. Schüth, Chem. Ing. Tech., 2011, 83, 1984–1993 CrossRef.
- R. Lan, J. T. S. Irvine and S. Tao, Int. J. Hydrogen Energy, 2012, 37, 1482–1494 CrossRef CAS.
- D. Miura and T. Tezuka, Energy, 2014, 68, 428–436 CrossRef CAS.
- S. Giddey, S. P. S. Badwal, C. Munnings and M. Dolan, ACS Sustainable Chem. Eng., 2017, 5, 10231–10239 CrossRef CAS.
- O. Elishav, G. Tvil, B. Mosevitzky, D. Lewin, G. E. Shter and G. S. Grader, Energy Procedia, 2017, 135, 3–13 CrossRef CAS.
- A. J. Reiter and S.-C. Kong, Fuel, 2011, 90, 87–97 CrossRef CAS.
- N. V. Ress and R. G. Compton, Energy Environ. Sci., 2011, 4, 1255–1260 Search PubMed.
- F. Ishak, I. Dincer and C. Zamfirescu, J. Power Sources, 2012, 202, 157–165 CrossRef CAS.
- G. Cinti, U. Desideri, D. Penchini and G. Discepoli, Fuel Cells, 2014, 14, 221–230 CrossRef CAS.
- A. F. S. Molouk, T. Okanishi, H. Muroyama, T. Matsui and K. Eguchi, J. Electrochem. Soc., 2015, 162, F1268–F1274 CrossRef CAS.
- F. Schüth, R. Palkovits, R. Schlöegl and D. S. Su, Energy Environ. Sci., 2012, 5, 6278–6289 Search PubMed.
- K. Sato, N. Abe, T. Kawagoe, S. Miyahara, K. Honda and K. Nagaoka, Int. J. Hydrogen Energy, 2017, 42, 6610–6617 CrossRef CAS.
- T. Grundt and K. Christiansen, Int. J. Hydrogen Energy, 1982, 7, 247–257 CrossRef CAS.
- E. Morgan, J. Manwell and J. McGowan, Renewable Energy, 2014, 72, 51–61 CrossRef CAS.
- J. Tallaksen, F. Bauer, C. Hulteberg, M. Reese and S. Ahlgren, J. Cleaner Prod., 2015, 107, 626–635 CrossRef CAS.
- I. A. Amar, R. Lan, C. T. G. Petit and S. Tao, J. Solid State Electrochem., 2011, 15, 1845–1860 CrossRef CAS.
- S. Giddey, S. P. S. Badwal and A. Kulkarni, Int. J. Hydrogen Energy, 2013, 38, 14576–14594 CrossRef CAS.
- V. Kyriakou, I. Garagounis, E. Vasileiou, A. Vourros and M. Stoukides, Catal. Today, 2017, 286, 2–13 CrossRef CAS.
- X. Guo, Y. Zhu and T. Ma, J. Energy Chem., 2017, 26, 1107–1136 CrossRef.
- C. G. Vayenas, S. Bebelis and S. Neophytides, J. Phys. Chem., 1988, 92, 5083–5085 CrossRef CAS.
- A. Katsaounis, J. Appl. Electrochem., 2010, 40, 885–902 CrossRef CAS.
- I. Garagounis, V. Kyriakou and M. Stoukides, Solid State Ionics, 2013, 231, 58–62 CrossRef CAS.
- F. Kosaka, T. Nakamura, A. Oikawa and J. Otomo, ACS Sustainable Chem. Eng., 2017, 5, 10439–10446 CrossRef CAS.
- T. Murakami, T. Nohira, T. Goto, Y. H. Ogata and Y. Ito, Electrochim. Acta, 2005, 50, 5423–5426 CrossRef CAS.
- Y. Ito, T. Nishikiori and H. Tsujimura, Faraday Discuss., 2016, 190, 307–326 RSC.
- F. Kosaka, N. Noda, T. Nakamura and J. Otomo, J. Mater. Sci., 2017, 52, 2825–2835 CrossRef CAS.
- G. Qing, R. Kikuchi, S. Kishira, A. Takagaki, T. Sugawara and S. T. Oyama, J. Electrochem. Soc., 2016, 163, E282–E287 CrossRef CAS.
- G. Qing, K. Sukegawa, R. Kikuchi, A. Takagaki and S. T. Oyama, J. Appl. Electrochem., 2017, 47, 803–814 CrossRef CAS.
- V. Kordali, G. Kyriacou and C. Lambrou, Chem. Commun., 2000, 1673–1674 RSC.
- S. Chen, S. Perathoner, C. Ampelli, C. Mebrahtu, D. Su and G. Centi, Angew. Chem., Int. Ed., 2017, 56, 2699–2703 CrossRef CAS PubMed.
- K. Aika, Angew. Chem., Int. Ed., 1986, 25, 558–559 CrossRef.
- T. Matsui, T. Kukino, R. Kikuchi and K. Eguchi, J. Electrochem. Soc., 2006, 153, A339–A342 CrossRef CAS.
- A. B. Papandrew, C. R. I. Chisholm, R. A. Elgammal, M. M. Özer and S. K. Zecevic, Chem. Mater., 2011, 23, 1659–1667 CrossRef CAS.
- J. Otomo, T. Ishigooka, T. Kitano, H. Takahashi and H. Nagamoto, Electrochim. Acta, 2008, 53, 8186–8195 CrossRef CAS.
- N. Mohammad, A. B. Mohamad, A. A. H. Kadhum and K. S. Loh, J. Power Sources, 2016, 322, 77–92 CrossRef CAS.
- G. Qing, R. Kikuchi, A. Takagaki, T. Sugawara and S. T. Oyama, J. Power Sources, 2014, 272, 1018–1029 CrossRef CAS.
- K. Imamura, M. Matsuyama and J. Kubota, ChemistrySelect, 2017, 2, 11100–11103 CrossRef CAS.
- K. Aika, Catal. Today, 2017, 286, 14–20 CrossRef CAS.
- K. Aika, T. Takano and S. Murata, J. Catal., 1992, 136, 126–140 CrossRef CAS.
- O. A. Hougen, K. M. Watson and R. A. Ragatz, Chemical Process Principles, Part II, John Wiley & Sons, New York, 2nd edn, 1959 Search PubMed.
- M. Kitano, Y. Inoue, Y. Yamazaki, F. Hayashi, S. Kanbara, A. Matsuishi, T. Yokoyama, S. W. Kim, M. Hara and H. Hosono, Nat. Chem., 2012, 4, 934–940 CrossRef CAS PubMed.
- M. Hara, M. Kitano and H. Hosono, ACS Catal., 2017, 7, 2313–2314 CrossRef CAS.
- K. Sato, K. Imamura, Y. Kawano, S. Miyahara, T. Yamamoto, S. Matsumura and K. Nagaoka, Chem. Sci., 2017, 8, 674 RSC.
- Y. Kadowaki and K. Aika, J. Catal., 1996, 161, 178–185 CrossRef CAS.
- J. N. Armor, Catal. Today, 1995, 25, 199–207 CrossRef CAS.
- C. Kura, Y. Kunisada, E. Tsuji, S. Zhu, H. Habazaki, S. Nagata, T. P. Michael, R. A. de Souza and Y. Aoki, Nat. Enegy, 2017, 2, 786–794 CrossRef CAS.
- Y. Aoki, S. Kobayashi, T. Yamaguchi, E. Tsuji, H. Habazaki, K. Yashiro, T. Kawada and T. Ohtsuka, J. Phys. Chem. C, 2016, 120, 15976–15985 CAS.
- N. Ito, M. Iijima, K. Kimura and S. Iguchi, J. Power Sources, 2005, 152, 200–203 CrossRef CAS.
- N. Ito, S. Aoyama, T. Masui, S. Matsumoto, H. Matsumoto and T. Ishihara, J. Power Sources, 2008, 185, 922–926 CrossRef CAS.
| This journal is © The Royal Society of Chemistry 2018 |

