Renewable bio-phenols from in situ and ex situ catalytic pyrolysis of Douglas fir pellet over biobased activated carbons†
Received
20th December 2017
, Accepted 13th February 2018
First published on 13th February 2018
Abstract
In situ and ex situ catalytic upgrading of pyrolysis vapors from Douglas fir pellets in the presence of activated carbon (AC) prepared by chemical activation was studied in a microwave pyrolyzer. The in situ catalytic upgrading configuration gave lower bio-oil yields (10.25–25.5 wt%) than ex situ catalytic upgrading configuration (20.03–32 wt%). The bio-oil yield from the in situ upgrading process was significantly affected by both catalytic reaction temperature and catalyst to biomass ratio. However, the bio-oil yield from ex situ upgrading process was only significantly affected by catalyst to biomass ratio. Bio-oils compositional analysis indicated that the ex situ upgrading process generated higher phenols concentration (4.14–19.76 mg ml−1) than in situ upgrading (4.14–9.90 mg ml−1). However, the selectivity of phenols from in situ upgrading process reflected by the peak area percentages was higher than that from ex situ upgrading. The catalyst recycling tests showed that the prepared AC catalyst can be reused for three times in phenol-rich bio-oil production via catalytic microwave pyrolysis.
1. Introduction
Lignocellulosic biomass has been recognized as a renewable carbon source that has the potential to supplement fossil fuels for producing fuels, chemicals and materials.1 Conversion of biomass can be generally achieved through biochemical or thermochemical methods. Current approaches to thermochemical conversion mainly include gasification and pyrolysis. In gasification, biomass is partially oxidized at high temperature (700–1000 °C) to form syngas, a mixture of H2, CO, CH4 and CO2, which can be used in engine or turbine for power, or converted to liquid fuels via Fischer–Tropsch synthesis.2 However, the complex syngas conditioning (e.g. tar removal), low selectivity towards high-value products such as C2–C4 olefins are the main issues that hinder the commercialization of the technology.2 Pyrolysis, which thermally (400–700 °C) decomposes the recalcitrant biomass in the absence of oxygen is one of the primary thermochemical conversion technologies. The liquid product of pyrolysis, known as bio-oil is a complex mixture of organic compounds, providing a pool for value-added chemicals, such as phenolics, cyclic ketones, levoglucosan, and aromatic hydrocarbons.3 However, the complexity of bio-oil composition presents challenges to the separation of these valuable products via existing chemical refinery, thus compromising the economic viability of bio-oil as a potential feedstock for valuable products. Nowadays, research efforts have been focused on developing efficient methods to control the pyrolysis reactions with catalysts to selectively produce bio-oils with enriched valuable compounds.4,5
Phenol and its derivatives are of particular interest in bio-oil due to their wide applications in synthesis of advanced materials and products, such as phenol-formaldehyde (PF) resins, biopolymers and disinfectants.6 They are mainly derived from depolymerization of lignin matrix and further cracking of lignin monomers, namely para coumaryl alcohol, coniferyl alcohol and sinapyl alcohol. For this reason, lignin derived chemicals are attractive substitution for phenol in phenolic resins due to its high phenolics concentration and vast availability. The hydrogens on both para and ortho positions of the phenol molecule are believed to be the active sites for polymerization with formaldehyde.7 However, bio-oil from conventional fast pyrolysis of biomass can only serve as a partial (∼50%) phenol replacement due to its abundant methoxy-substituted phenolic compounds, which have fewer available positions for polymerization than pure phenol.8 In addition, the presence of sugars, acids and other chemicals may negatively affect the thermomechanical properties of derived PF resins. Thus, to advance the production of renewable PF resins from biomass, it is necessary to obtain bio-oil with high selectivity of reactive phenolics.
Recently, increasing interests have been focused on the catalytic pyrolysis of biomass to selectively produce phenolics. Various catalysts systems, such as activated carbon (AC), alkaline catalysts and phosphates (e.g. K3PO4, K2HPO4 and KH2PO4) have shown promising catalytic performance.5,9–15 Catalytic microwave-assisted pyrolysis using activated carbon was initiated by our research group in Washington State University. Bu et al.16–20 conducted a series of studies on microwave-assisted pyrolysis using commercial activated carbons as catalysts under different pyrolysis conditions. The addition of AC resulted in a high amount (up to 78 area %) of phenolics in the bio-oil and an increase in H2 yield under optimized condition (catalyst/biomass ratio of 3 and reaction temperature of 400 °C).20 It is worth noting that the phenolics were mostly phenol and alkyl-substituted phenols that were free of alkoxy groups, which are of high interests. A plausible reaction mechanism based on the experimental results was also proposed. It was suggested that activated carbon acted as a microwave absorber which created hot spots under microwave heating. These hot spots favored the gasification reactions, releasing H2 that could promote the decomposition of lignin and further deoxygenation of lignin-derived monomers to form phenolics.16 Alkaline catalysts, including carbonates (e.g. Na2CO3 and K2CO3) and hydroxides (e.g. NaOH, KOH and Ca(OH)2) promoted the decarboxylation and decarbonylation reactions of lignin-derived monomers, as well as the elimination of side chains on phenol ring.21 K3PO4 also exhibited catalytic reactivity towards phenolics when used as a catalyst in pyrolysis of biomass.14 The addition of K3PO4 resulted in a significant decrease in hydroxyl and alkoxyl substituted phenols, which indicated an enhanced dehydroxylation and decarbonlyation reactions of lignin during pyrolysis. More information on recent development on catalytic pyrolysis processes for phenol-rich bio-oil can be found in a literature review written by Kim et al.9
Our previous studies showed that ACs are effective in selectively producing phenols from microwave-assisted catalytic pyrolysis of biomass. However, the existing precursors for AC production mainly include nonrenewable resources (e.g. coal) and other high-cost agroforestry resources such as bamboo, wood and coconut as the feedstock. Attempts have been made on using fruit waste, such as shell or stone of fruit as AC precursors,22,23 but the outputs of these resources are low. This study for the first time demonstrated a proof-of-concept of a novel catalytic pyrolysis process to simple phenols free of methoxy substitutes. The AC obtained from chemical activation of a low-cost and abundant agricultural waste, corn stover was used as a catalyst for phenol production during microwave-assisted pyrolysis. In situ and ex situ catalytic upgrading of pyrolysis vapors of Douglas fir pellets were investigated. The objective of this study was to investigate the effects of catalyst-to-biomass ratio and catalytic reaction temperature on catalytic pyrolysis process. The stability of catalytic activity was also evaluated by catalyst recycling tests.
2. Materials and methods
2.1. Preparation of the AC from corn stover
Corn stover collected from Brookings, South Dakota, USA was selected as the AC precursor in this study. Prior to use, the as-received corn stover was milled and sieved to a particle size of less than 2 mm. The proximate analysis of corn stover was given elsewhere.24 Phosphoric acid (85 wt%, Alfa Aeser, USA) was used as the activation agent. Approximately 100 g of corn stover were impregnated at room temperature in the phosphoric acid at an acid (dry basis) to biomass ratio of 1.8 for 24 h. To insure complete wetting of biomass, 700 g distilled water was added to the acid/biomass mixture. The impregnated samples were then dried at 105 °C for 24 h and then subjected to activation using a Sineo MAS-II microwave pyrolysis system (Shanghai Sineo Microwave Chemistry Technology Co., Ltd., Shanghai, China). Details about this reaction system were described elsewhere.25 The microwave irradiation power was 800 W and the holding time was 60 min. The obtained AC was first washed with 0.1 M hydrochloric acid at 55 °C overnight to remove residual phosphoric acid and ash content, and then with deionized water repeatedly until the pH of the filtrate became neutral. Finally, the obtained ACs were filtered out, dried in oven at 105 °C for 24 h, and restored in a desiccator for future use.
2.2. Microwave-assisted catalytic pyrolysis of Douglas fir sawdust
The catalytic performance of prepared ACs were tested in the microwave reaction system mentioned above. Douglas fir sawdust pellet (DF, Bear Mountain Forest Products Inc.) with a diameter of 7 mm was used as the biomass feedstock for phenol-rich bio-oil production. More details about the experiment setup and procedures can be found in our previous studies.24,26 For in situ catalytic pyrolysis, the biomass and AC catalyst were successively loaded into a 250 ml quartz cylindrical bottle (170 mm in length) and separated by quartz wool. The cylindrical quartz reactor was then subjected to pyrolysis reaction inside the cavity of microwave oven. For ex situ catalytic pyrolysis, biomass was loaded into a 500 ml quartz flask for microwave-assisted pyrolysis and the pyrolysis vapors was upgraded in a packed bed reactor (1 inch inner diameter, 10 inches in length) filled with AC catalyst. The microwave-assisted pyrolysis conditions were set at 400 °C, 800 W and a holding time of 20 min. Detailed descriptions on the experimental setup can be found elsewhere.27 After the end of the experiment, the condensable vapors were recovered as bio-oil and the char residue was collected and weighed. The weight of syngas was determined by subtracting the weight of bio-oil and biochar from initial biomass input weight.
2.3. GC/MS analysis of bio-oil
Bio-oil composition was analyzed using an Agilent gas chromatography-mass spectrometer (GC/MS; GC: 7890A, MS: 5975C, Agilent Technologies, USA) with a DB-5 capillary column (30 ml × 0.32 mm I.D., 0.25 μm film thickness). Prior to analysis, the bio-oil components were extracted by dichloromethane (HPLC grade, 99.7%, Alfa Aesar, USA) with a mixing ratio of 1![[thin space (1/6-em)]](https://www.rsc.org/images/entities/char_2009.gif) :
:![[thin space (1/6-em)]](https://www.rsc.org/images/entities/char_2009.gif) 1. After phase separation, the bottom layer (solvent phase) was sampled for analysis. The initial GC oven temperature was set to 40 °C and held for 2 min, and then increased to a final temperature of 280 °C at 10 °C min−1 and held for 10 min. The inlet temperature was kept constant at 280 °C, and the sample injection was made in the splitless mode. High purity helium (99.99%) was used as the carrier gas at a flow rate of 0.9 ml min−1. The compounds were identified by comparing their mass spectra with National Institute of Standards and Technology (NIST) mass spectral library. The concentrations of selected compounds in bio-oil in terms of mg ml−1 were determined using external standards calibration method. Briefly, a stock solution was prepared by dissolving 1 g of each individual calibration compound in a 100 ml volumetric flask containing analytical grade dichloromethane. Aliquots of the 10
1. After phase separation, the bottom layer (solvent phase) was sampled for analysis. The initial GC oven temperature was set to 40 °C and held for 2 min, and then increased to a final temperature of 280 °C at 10 °C min−1 and held for 10 min. The inlet temperature was kept constant at 280 °C, and the sample injection was made in the splitless mode. High purity helium (99.99%) was used as the carrier gas at a flow rate of 0.9 ml min−1. The compounds were identified by comparing their mass spectra with National Institute of Standards and Technology (NIST) mass spectral library. The concentrations of selected compounds in bio-oil in terms of mg ml−1 were determined using external standards calibration method. Briefly, a stock solution was prepared by dissolving 1 g of each individual calibration compound in a 100 ml volumetric flask containing analytical grade dichloromethane. Aliquots of the 10![[thin space (1/6-em)]](https://www.rsc.org/images/entities/char_2009.gif) 000 μg ml−1 stock solution was then diluted to concentrations of 400, 600, 800, 1000, 1500, and 2000 μg ml−1. 1 μL of each stock solution was injected into the GC-MS and the peak area of each standard compound was then plotted against the mass of the compound in μg ml−1 solution and then linearly regressed to obtain the calibration curve of the compound. The R2 value was greater than 0.98 for all standards. The regression equation was then used to calculate the concentrations of selected compounds in bio-oil samples.
000 μg ml−1 stock solution was then diluted to concentrations of 400, 600, 800, 1000, 1500, and 2000 μg ml−1. 1 μL of each stock solution was injected into the GC-MS and the peak area of each standard compound was then plotted against the mass of the compound in μg ml−1 solution and then linearly regressed to obtain the calibration curve of the compound. The R2 value was greater than 0.98 for all standards. The regression equation was then used to calculate the concentrations of selected compounds in bio-oil samples.
2.4. Experimental design
A central composite design (CCD) was used to study the effects of catalytic reaction temperature (X1, °C) and the catalyst to biomass ratio (X2) on catalytic pyrolysis process. For in situ process, the biomass input was fixed at 15 g. The catalytic pyrolysis temperature and the catalyst to biomass ratio were varied from 350 to 450 °C (a step of 50 °C) and 0.25 to 1 (a step of 0.375), respectively (Table 1). For ex situ process, the biomass input was fixed at 30 g. The catalytic upgrading temperature and the catalyst to biomass ratio were varied from 300 to 500 °C (a step of 100 °C) and 0.25 to 0.33 (a step of 0.375), respectively (Table 2).
Table 1 Coded levels of independent variables for in situ catalytic pyrolysis
| Independent variables |
Range and levels |
| −r (−1.41) |
−1 |
0 |
1 |
+r (1.41) |
|
X
1 (temperature, °C) |
329.3 |
350 |
400 |
450 |
470.7 |
|
X
2 (catalyst to biomass ratio) |
0.095 |
0.25 |
0.625 |
1 |
1.16 |
Table 2 Coded levels of independent variables for ex situ catalytic pyrolysis
| Independent variables |
Range and levels |
| −r (−1.41) |
−1 |
0 |
1 |
+r (1.41) |
|
X
1 (temperature, °C) |
280 |
300 |
400 |
500 |
540 |
|
X
2 (catalyst to biomass ratio) |
0.095 |
0.25 |
0.625 |
1 |
1.16 |
For statistical calculations, the variables Xi were coded as xi, according to eqn (1):
where
xi is the dimensionless value of the independent variable while
Xi is the real value.
X0 is the real value of the variable at the center point and Δ
X is the step length. A 2
2-factorial CCD, with 4 axial points (
r = 1.41) and 5 replications at the center points (
n0 = 5) leads to the total number of 13 experiments that were employed to optimize the reaction conditions. A second order polynomial equation was used to describe the effect of independent variables in terms of linear, squared, and interaction. The predicted model for the response (
Yi) is determined by
eqn (2):
| |  | (2) |
where
Yi is the predicted response;
b0 is the interception coefficient,
bi,
bii, and
bij are coefficients of the linear, quadratic, and interaction effects,
Xi is the independent variables, and
ε is the random error. The statistical analysis of the model was performed by Design Expert 8 software. The coefficient of determination (
R2) and the
F test (
p < 0.05) were used to determine the significance of the model. The effect of each independent variable and their interactions were determined.
2.5. Characterizations of ACs
The AC catalysts were characterized in terms of surface area, pore structures, surface chemistry and morphology. Surface area and pore structures of AC catalysts were evaluated by N2 adsorption/desorption isotherms at 77 K using a physisorption analyzer (Micromeritics® Tristar II 3020). Prior to analysis, the AC samples were degassed at 250 °C overnight to remove any moisture and impurities. The specific surface area was calculated according to Brunauer–Emmett–Teller (BET) theory. Micropore volume, micropore and external surface area were determined using t-plot method.28 Fourier Transform Infrared (FTIR) spectra of AC samples were obtained with an IR Prestige 21 spectrometer in attenuated total reflection (ATR) mode (Shimadzu, Ge crystal). The spectra were recorded at a range of 500–4500 cm−1 at a resolution of 8 cm−1 using a combined 64 scans. The total acidity and acid strength distribution of the catalysts have been determined by temperature programmed desorption of ammonia (NH3-TPD) which was performed using a Micromeritics Autochem 2920 instrument in a quartz reactor coupled with a Mass Spectroscopy (MS) as the detector. Initially, approximate 0.1 g sample was purged at a flow of Ar/He gas (5%/95%, 50 ml min−1) at 300 °C for 1 h. After cooling down to the room temperature, the sample was saturated with 10% NH3/He for 1 h at 100 °C. After saturation, the sample was purged with Ar/He gas (5%/95%, 50 ml min−1) until no NH3 was detected in the outlet gas. The desorption was performed by ramping the temperature up to 400 °C at a heating rate of 10 °C min−1. The desorbed NH3 was detected by MS. The surface morphology of ACs were identified using scanning electronic microscope/energy dispersive X-ray (SEM/EDX, FEI Quanta 200 F).
3. Results and discussions
3.1. AC production from phosphoric acid activation
The production process of AC from corn stover using phosphoric acid activation is depicted in Fig. 1. Four operation steps were considered and consisted of sample pretreatment (acid soaking and drying), microwave-assisted activation, product rinsing and acid recovery, and finally drying. During acid soaking operation, additional water was added in the soaking container to ensure all the biomass particles were fully wetted. The wet biomass must be fully dried prior to pyrolysis in order to save the activation time in pyrolysis step. After drying process, the biomass partially turned black, indicating that the biomass was highly dehydrated under acidic environment. For the pyrolysis step, microwave-induced self-gasification of char is believed to be the important for the development of pore structures,29 even though the observed weight loss (23%) was minimal compared to normal biomass pyrolysis. The obtained AC/H3PO4 mixture was washed with water to remove the residual acid. Based on our experiment data, the washing process removed 85 wt% of phosphoric acid, resulting in an AC yield of 41 g per 100 g dry corn stover input.
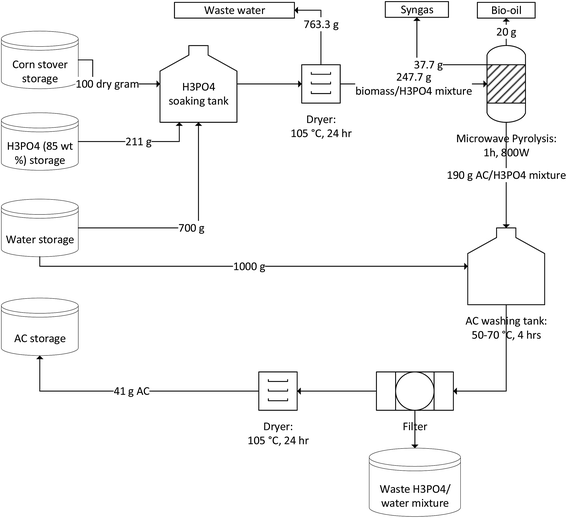 |
| | Fig. 1 Process flow diagram of AC production from corn stover. | |
3.2. Characterization of corn stover derived AC
Phosphoric acid has been well-known used for preparation of porous carbon materials. During impregnation process, the biomass reacts with phosphoric acid to form a biomass-phosphoric acid complex.30 Water is removed in drying process afterwards. The pyrolysis step31 is the major porosity development process which involves the devolatilization of biomass-phosphoric acid complex, decomposition of phosphoric acid and evaporation of P2O5. The effectiveness of prepared AC is a function of its textural properties (e.g. surface area, pore size distribution, and morphology) and surface chemistry (e.g. surface functional groups and acid strength). Our preliminary results indicated that higher phosphoric acid impregnation ratio led to higher values of surface area and total volume. The N2 isotherms illustrated in Fig. 2(a) is a typical type IV hysteresis loop, which suggests the adsorption on mesopores followed by capillary condensation. The values of BET surface area is 1338 m2 g−1 with a micropore surface area of 131 m2 g−1, which further confirms a well-developed mesoporous structure. SEM image shown in Fig. 2(b) also confirmed the existence of highly porous structure with abundant mesopores. The NH3-TPD profile (shown in Fig. 2(c)) shows a broad desorption peak at a temperature ranged from 80 to 220 °C, corresponding to the weak acid sites.32 The value of total acidity is 0.247 mmol NH3 g−1, which is comparable to that of common solid acid catalysts, such as zeolite reported in literature.33 FTIR spectrums of both raw corn stover (CS) and corn stover derived AC (CSAC) were obtained to investigate the change of surface functional groups due to activation. As shown in Fig. 2(d), the broad absorption band at 3100–3600 cm−1 indicated the presence of both free and hydrogen bonded –OH groups on carbon surface. Its intensity decreased significantly after activation by phosphoric acid. The small peak at 2850 cm−1 corresponding to –CH stretching was also not visible after activation. The band at 1550 cm−1 may reflect the –C![[double bond, length as m-dash]](https://www.rsc.org/images/entities/char_e001.gif) C structures. The peaks at 1050, 1122 and 1150 may correspond to characteristic structures of cellulose and hemicellulose, including primary alcohol (–CH2OH), secondary alcohol (–CHROH) and ether (–C–O–C).24 After activation, the peak at 1122 cm−1 nearly diminished since phosphoric acid can oxidize hydroxyl groups into phosphoric-containing acidic groups, such as –C–O–PO3 and –C–PO3 on carbon surface.34 The presence of phosphorous was confirmed by EDX analysis (Fig. S1†). From the results of physical and chemical properties analysis, it can be concluded that the prepared AC showed a highly porous structure with acidic functionality, and could provide excellent catalytic reactivity for biomass conversion.
C structures. The peaks at 1050, 1122 and 1150 may correspond to characteristic structures of cellulose and hemicellulose, including primary alcohol (–CH2OH), secondary alcohol (–CHROH) and ether (–C–O–C).24 After activation, the peak at 1122 cm−1 nearly diminished since phosphoric acid can oxidize hydroxyl groups into phosphoric-containing acidic groups, such as –C–O–PO3 and –C–PO3 on carbon surface.34 The presence of phosphorous was confirmed by EDX analysis (Fig. S1†). From the results of physical and chemical properties analysis, it can be concluded that the prepared AC showed a highly porous structure with acidic functionality, and could provide excellent catalytic reactivity for biomass conversion.
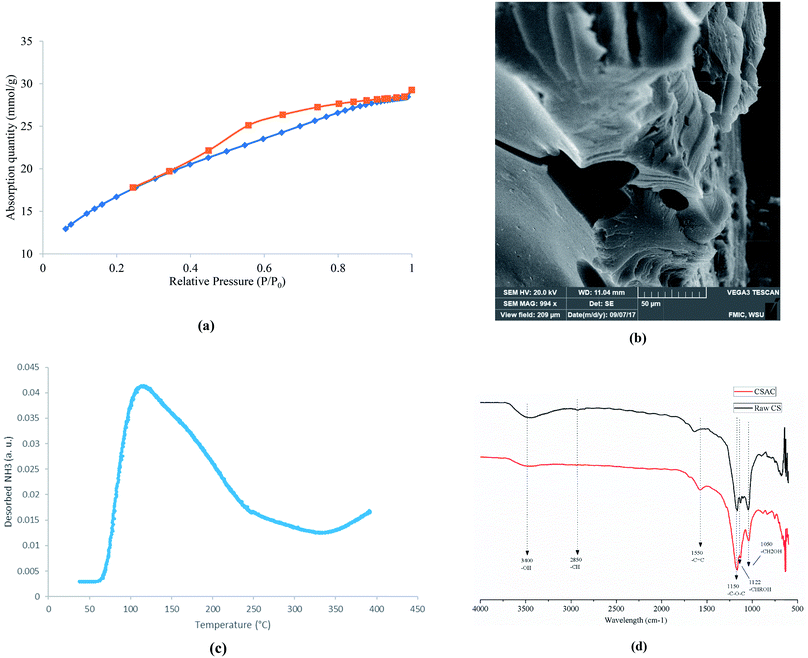 |
| | Fig. 2 Characterization of cornstover derived AC (a) N2 isotherms; (b) SEM images; (c) NH3-TPD profile; (d) FTIR spectrum. | |
3.3. Catalytic reactivity of corn stover derived AC
3.3.1. Product yield from in situ and ex situ catalytic pyrolysis.
CCD was used to establish the correlation between the product yields from catalytic pyrolysis (both in situ and ex situ) and operation conditions (temperature and catalyst to biomass ratio). Table S1† summarizes the complete design matrix together with the product yields as response factors for in situ catalytic pyrolysis. It was observed that the bio-oil yield ranged from 12.5 to 25.5 wt%; the biochar yield ranged from 14.5 to 25.85 wt%; the syngas yield ranged from 55.4 to 72.5 wt%. The highest and lowest bio-oil yield was obtained under the same temperature (400 °C) but catalyst to biomass ratio of 0.094 and 1.15, respectively. Such result implies that catalyst to biomass ratio negatively affect the bio-oil yield. Response surface analysis for yields of bio-oil, biochar and syngas is shown in Fig. 3. For bio-oil yield, the quadratic response surface model was selected, as suggested by the software. The statistical significance of the model and factors were evaluated using the variance analysis (ANOVA) to the 95% of confidence from the hypothesis F test. ANOVA on main effects indicated that both catalyst to biomass ratio (p-value < 0.05) and reaction temperature (p-value < 0.05) were significant factors. According to the main effects plots (Fig. S2†), catalyst to biomass ratio exhibited a remarkable negative linear correlation towards bio-oil yield. When higher amounts of catalyst were loaded, the contact time of primary pyrolytic volatiles and catalyst was extended, thus providing more active sites for secondary cracking, resulting the decrease of liquid product. This can be confirmed by the increasing syngas yield with catalyst to biomass ratio shown in Fig. 2(b). The reaction temperature showed a second order relationship with the maximum value around 420 °C. The second order term of temperature was also significant (p-value < 0.05) according to ANOVA results. The final empirical equation in terms of actual factors for bio-oil yield is shown by eqn (3):| |  | (3) |
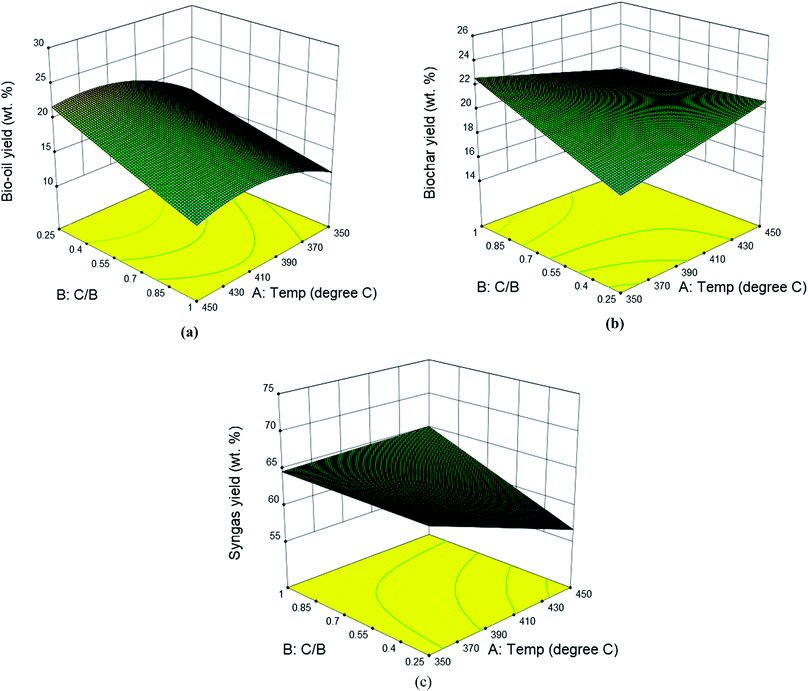 |
| | Fig. 3 Effects of reaction temperature and catalyst to biomass ratio on the yields of bio-oil (a), biochar (b) and syngas (c) from in situ catalytic pyrolysis of DF. | |
The quadratic regression model fitted to the observed bio-oil yield was significant (p-value < 0.05), indicating that the model finely presented the relationship between the bio-oil yield and reaction conditions. Accordingly, the model can predict the maximum bio-oil yield with respect to the two variables. Results of ANOVA on biochar and syngas yield showed no significant contribution from either temperature or catalyst to biomass ratio, therefore, the linear surface model was not significant as well.
In ex situ catalytic pyrolysis, the volatiles evaporated from microwave-assisted pyrolysis were upgraded in a packed bed reactor outside the microwave reactor. The operation conditions for microwave pyrolysis were kept constant so that two independent variables catalytic reaction temperature and catalyst to biomass ratio can be investigated. The bio-oil yield obtained from ex situ catalytic pyrolysis ranged from 20.03 to 32 wt% (Table S2†), which was higher than that obtained from in situ catalytic upgrading process. Similar to in situ catalytic pyrolysis, the highest bio-oil yield was also obtained from the lowest level of catalyst to biomass ratio. The main effects plot (Fig. S3†) indicated that catalyst to biomass ratio had a strong negative impact on the bio-oil yield. Whereas, catalytic reaction temperature demonstrated a quadratic relationship with bio-oil yield with the maximum value around 400 °C. Results of ANOVA confirmed the significance (p-value < 0.05) of catalyst to biomass ratio while disagreed the significance of catalytic temperature. In addition, the second order term of catalytic temperature was nonsignificant suggested by the quadratic model as well. From the ANOVA result for bio-oil yield, the model F-value of 7.14 and p-value of 0.0094 revealed that the quadratic model was significant. The obtained model in terms of actual factors with respect to response Ybio-oil, excluding the insignificant terms, is shown by eqn (4):
| |  | (4) |
Due to the length limitation of catalyst bed, the catalyst loading in ex situ catalytic process cannot match that used in in situ catalytic process. However, the comparison between the bio-oil yield obtained from ex situ and in situ catalytic pyrolysis can still be realized by predicting values from the empirical equations. At 450 °C, the plot of predicted bio-oil yield obtained from in situ catalytic pyrolysis intersected with the plot of ex situ catalytic pyrolysis at catalyst to biomass ratio of 0.5 (Fig. S4†). After this point, the bio-oil yield from in situ catalytic pyrolysis was higher than that from ex situ catalytic pyrolysis. The result suggested that in situ catalytic pyrolysis generated higher bio-oil yield than ex situ catalytic pyrolysis when operated under higher catalyst to biomass ratios. The same phenomenon was also observed in previous studies on both in situ and ex situ catalytic pyrolysis.35–37Ex situ catalytic pyrolysis generally resulted in a longer gaseous residence time than in situ catalytic pyrolysis. Thus, the contact time of pyrolytic vapors and catalyst were extended, improving the secondary cracking reactions that convert the condensable volatiles into gases (Fig. 4).36
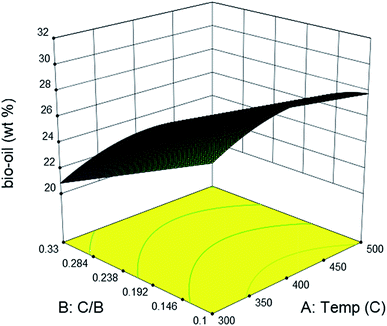 |
| | Fig. 4 Effects of catalytic bed temperature and catalyst to biomass ratio on the yield of bio-oil from ex situ catalytic pyrolysis of DF. | |
3.3.2. Bio-oil composition.
Fig. 5 shows the GC/MS peak area percentages of chemical compounds detected in bio-oil from in situ catalytic pyrolysis. The chemical compounds in bio-oil can be classified into phenols, furfurals, guaiacols, catechols, ketones and other oxygenates (such as aldehydes and hydrocarbons). It was observed that the major chemical compounds in bio-oil were phenols, furfurals and guaiacols, which added up to 70–99% of total peak area. The bio-oil from pyrolysis without adding AC at 450 °C mainly contained furfurals (21%), guaiacols (32%), ketones (15%), and pyrolytic lignin monomers (17%) which were not observed in bio-oil obtained from catalytic pyrolysis. It was noticed that the phenols content in bio-oil obtained from catalytic pyrolysis with ACs (15–89%) were much higher than that from noncatalytic pyrolysis (4.6%). In addition, the guaiacols content from noncatalytic pyrolysis was also much higher than that from catalytic pyrolysis (5.2–21%). These observations indicated that the addition of ACs promoted the conversion of lignin monomers and guaiacols into phenolic compounds during microwave pyrolysis. Since the GC/MS peak area percentages can only approximately reflect the product selectivity, we have obtained the actual concentrations of the three most abundant species: phenols, furfurals and guaiacols in bio-oil by establishing the calibration curves. The calibrated values for phenols, furfurals, and guaiacol were obtained for all bio-oil samples and were reported in mg ml−1 basis (Table S3†). The results indicated that the phenols concentration ranged from 4.14 to 9.90 mg ml−1; the furfurals concentration ranged from 2.38 to 20.90 mg ml−1; the guaiacols concentration ranged from 0 to 3.50 mg ml−1. The effects of reaction temperature and catalyst to biomass ratio on these product concentrations were studied. According to the ANOVA results, phenols concentration was not significantly affected by reaction temperature but significantly affected by catalyst to biomass ratio (p-value < 0.05). Both furfurals (p-value < 0.05) and guaiacols (p-value < 0.05) concentrations were significantly affected by catalyst to biomass ratio, but not significantly affected by reaction temperature. Further main effects analysis (shown in Fig. 6) indicated that phenols concentration decreased as the temperature increased, while increased as the catalyst to biomass ratio increased. Whereas furfurals and guaiacols concentrations showed a decreasing trend as the catalyst to biomass ratio increased. These results suggest that low reaction temperature (350 °C) and high catalyst to biomass ratio (1![[thin space (1/6-em)]](https://www.rsc.org/images/entities/char_2009.gif) :
:![[thin space (1/6-em)]](https://www.rsc.org/images/entities/char_2009.gif) 1) should be used in order to produce bio-oil rich-in phenols. Garcia-Perez et al.38 obtained the maximum mono-phenols concentration between 400 to 450 °C from auger pyrolysis of Douglas fir wood. Jiang et al.12 reported the highest phenol concentration (4.13 mg ml−1) at 500 °C from microwave pyrolysis of palm kernel shell using commercial AC as the microwave absorber. The secondary cracking reactions were intensified at elevated temperatures, resulting the conversion of large phenolic compounds into mono-phenols. Obviously, the addition of AC can decrease the temperature requirement for secondary cracking reactions compared to noncatalytic pyrolysis.
1) should be used in order to produce bio-oil rich-in phenols. Garcia-Perez et al.38 obtained the maximum mono-phenols concentration between 400 to 450 °C from auger pyrolysis of Douglas fir wood. Jiang et al.12 reported the highest phenol concentration (4.13 mg ml−1) at 500 °C from microwave pyrolysis of palm kernel shell using commercial AC as the microwave absorber. The secondary cracking reactions were intensified at elevated temperatures, resulting the conversion of large phenolic compounds into mono-phenols. Obviously, the addition of AC can decrease the temperature requirement for secondary cracking reactions compared to noncatalytic pyrolysis.
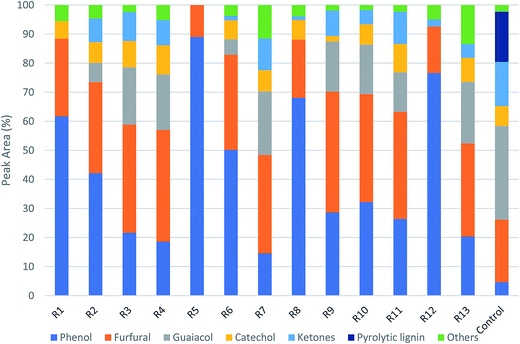 |
| | Fig. 5 Product distribution of bio-oils from in situ catalytic pyrolysis (R1–R13 are the run orders as shown in Table S1†). | |
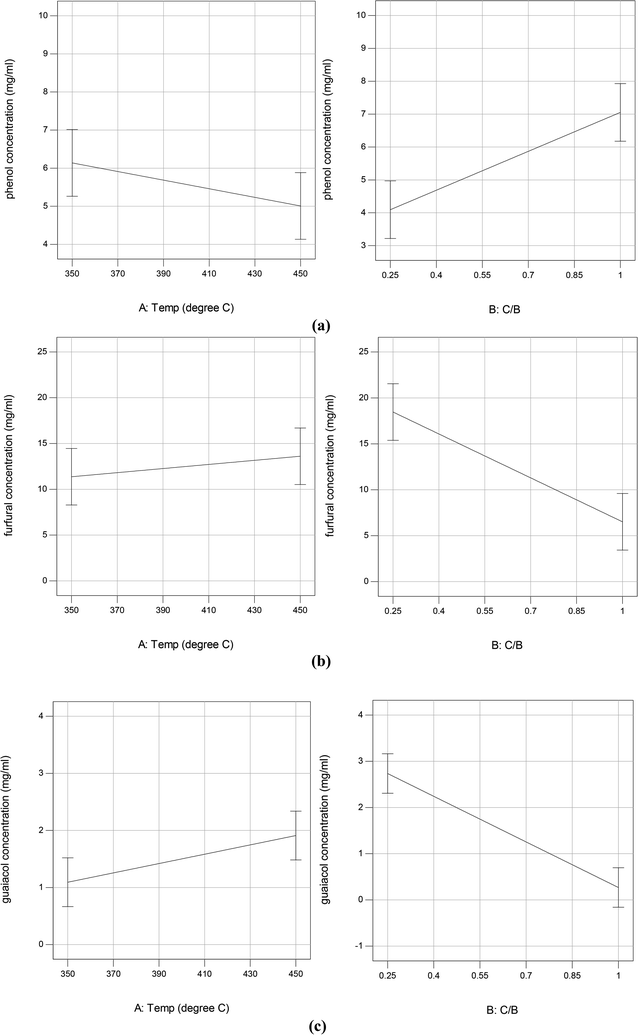 |
| | Fig. 6 Plots of main effects on phenol (a), furfural (b), and guaiacol (c) yield in bio-oil from in situ catalytic pyrolysis. | |
The bio-oil compositions from microwave-assisted pyrolysis coupled with ex situ catalytic upgrading was shown in Fig. 7. Compared to in situ catalytic upgrading, the ex situ catalytic upgrading generated polyaromatic hydrocarbons and pyrolytic lignin that were not observed in in situ catalytic upgrading. The difference of in situ and ex situ catalytic upgrading bio-oils can be attributed to the variations of catalytic reaction environment. For in situ catalytic upgrading, the AC catalytic bed acted as a microwave absorber, providing microwave plasma and hot spots that promoted the heterogenous catalytic reactions of pyrolysis vapors.39 Thus, the pyrolytic vapors can be upgraded once diffused into the channel of AC efficiently, resulting small molecules that quickly desorbed. For ex situ upgrading process, the pyrolytic vapors are likely to condense during transport before contacting with AC catalyst, compromising the catalytic reactivity. In addition, the AC catalytic bed cannot take advantages of promoted heterogeneous reactivity once placed out of microwave. This explains the presence of substantial amount of pyrolytic lignin in bio-oil from ex situ upgrading. Similar to bio-oil obtained from in situ upgrading, phenols, furfurals and guaiacols were still the dominant chemical compounds that account for 57–89% of total peak area in bio-oils obtained from ex situ upgrading. The phenols peak area from ex situ catalytic upgrading ranged from 7.3% to 51%, which was much lower compared to that from in situ catalytic upgrading. High guaiacols content (5.3–35%) was noticed for most of bio-oils from ex situ upgrading. The actual concentrations of phenols, furfurals and guaiacols in bio-oils were quantitatively determined (Table S4†). It can be seen that the concentrations of these compounds in bio-oils obtained from ex situ upgrading are all higher than those in bio-oils obtained from in situ upgrading. In detail, the concentration of phenols, furfurals and guaiacols were in the range of 4.14–19.76, 12.98–39.66, and 1.1–14.12 mg ml−1 bio-oil. Surface plots of phenol concentrations in bio-oils obtained from in situ and ex situ catalytic pyrolysis were shown in Fig. 8. Statistical results indicated that the concentration of phenols was not significantly affected by catalytic reaction temperature and catalyst to biomass ratio, while the concentration of furfurals (p-value < 0.05) and guaiacols (p-value < 0.05) were significantly affected by catalyst to biomass ratio but not significantly affected by catalytic temperature. Similar to in situ catalytic pyrolysis, the concentrations of furfurals and guaiacols showed a decreasing trend towards catalyst to biomass ratio. The difference in bio-oils obtained from in situ and ex situ catalytic upgrading indicated that in situ catalytic upgrading was more suitable for selectively producing phenol-rich bio-oils.
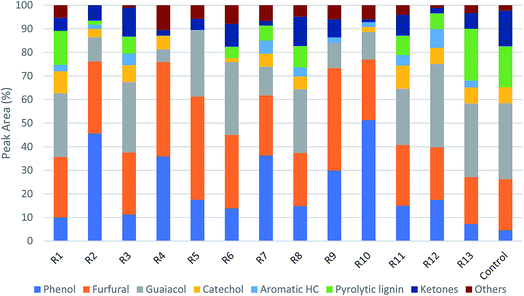 |
| | Fig. 7 Product distribution of bio-oils from ex situ catalytic pyrolysis (R1–R13 are the run orders as shown in Table S2†). | |
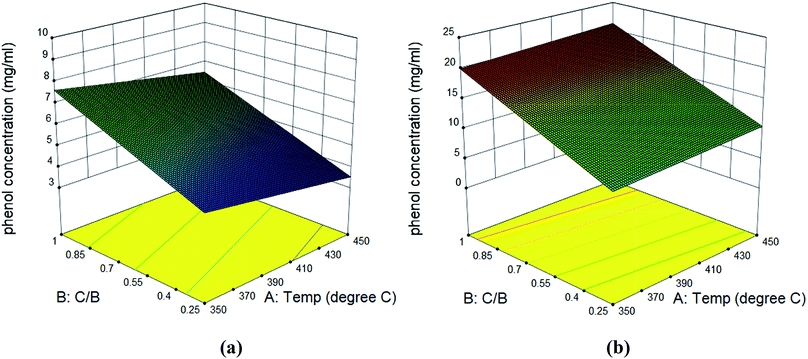 |
| | Fig. 8 Surface plots of phenol concentration in bio-oil obtained from in situ catalytic pyrolysis (a) and ex situ catalytic pyrolysis (b). | |
In order to investigate the lifetime and recyclability of the prepared AC catalyst, the catalyst was reused for 7 times via ex situ catalytic upgrading process at 450 °C and a catalyst to biomass ratio of 0.33. GC/MS chromatograms of bio-oil samples obtained with fresh and used AC catalyst was illustrated in Fig. S5.† It can be seen that the used catalyst loses its high product selectivity compared to the fresh AC. The concentrations of major compounds, including phenols, furfurals, and guaiacols were shown in Fig. 9. It is observed that the phenols concentration decreased significantly after three recycles. In contrast, the curves of furfurals and guaiacols showed an increasing trend towards recycle times until the fourth recycle, and then descended at the fifth recycle. These results indicated that the prepared AC catalyst can be reused for at least three times without any treatment for production of phenol-rich bio-oil.
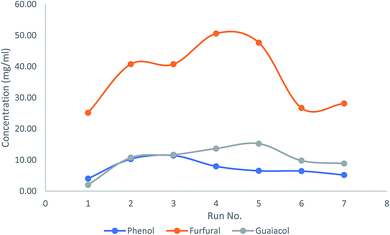 |
| | Fig. 9 Effects of catalyst recycling on concentrations of phenols, furfurals and guaiacols in bio-oil from ex situ catalytic upgrading. | |
4. Conclusions
In this study, the activated carbon catalyst prepared by chemical activation of corn stover was used for catalytic upgrading of pyrolytic vapors from Douglas fir pellet. The effects of reaction temperature and catalyst to biomass ratio on product distribution and bio-oil compositions were comparatively investigated in both in situ and ex situ upgrading configurations. The results indicated that the catalyst to biomass ratio negatively affected the bio-oil yield in both configurations. Prediction results from CCD suggested that the bio-oil yield from ex situ upgrading was less than that from in situ upgrading process if the catalyst to biomass ratio was set above 0.5 under the same reaction temperature. The bio-oil composition analysis indicated that phenols, furfurals and guaiacols were the most abundant compounds detected. Although ex situ catalytic upgrading gave higher phenols concentration than in situ catalytic upgrading, the phenols selectivity from ex situ catalytic upgrading was lower. The prepared AC catalyst can be reused for at least three times in producing highly phenolic bio-oil.
Conflicts of interest
There are no conflicts to declare.
Acknowledgements
This study was partially supported by The Agriculture and Food Research Initiative of National Institute of Food and Agriculture, United States Department of Agriculture (award number: 2016-67021-24533; award number: 2016-33610-25904). We are grateful to Dr Aftab Ahamed for helping with the GC-MS analysis and Dr Valerie Lynch-Holm from Franceschi Microscopy & Imaging Center (FMIC), Washington State University for the help with SEM training.
References
- M. Kleinert and T. Barth, Chem. Eng. Technol., 2008, 31, 736–745 CrossRef CAS.
- A. Kumar, D. D. Jones and M. A. Hanna, Energies, 2009, 2, 556–581 CrossRef CAS.
- M. Attia, S. Farag, S. Habibzadeh, S. Hamzehlouia and J. Chaouki, Curr. Org. Chem., 2016, 20, 2458–2479 CrossRef CAS.
- K. Barta and P. C. Ford, Acc. Chem. Res., 2014, 47, 1503–1512 CrossRef CAS PubMed.
- Z.-b. Zhang, Q. Lu, X.-n. Ye, W.-t. Li, B. Hu and C.-q. Dong, Energy Convers. Manage., 2015, 106, 1309–1317 CrossRef CAS.
- Y. Zhao and N. Yan, J. Biobased Mater. Bioenergy, 2014, 8, 465–480 CrossRef CAS.
-
Y. Zhang, Production and Applications of Formaldehyde-Free Phenolic Resins Using 5-Hydroxymethylfurfural Derived from Glucose In-Situ, Electronic Thesis and Dissertation Repository, 2014, p. 2617, http://https://ir.lib.uwo.ca/etd/2617.
- A. Effendi, H. Gerhauser and A. V. Bridgwater, Renew. Sustain. Energy Rev., 2008, 12, 2092–2116 CrossRef CAS.
- J.-S. Kim, Bioresour. Technol., 2015, 178, 90–98 CrossRef CAS PubMed.
- A. Mamaeva, A. Tahmasebi and J. Yu, Korean J. Chem. Eng., 2017, 34, 672–680 CrossRef CAS.
- A. Mamaeva, A. Tahmasebi, L. Tian and J. Yu, Bioresour. Technol., 2016, 211, 382–389 CrossRef CAS PubMed.
- J. E. Omoriyekomwan, A. Tahmasebi and J. Yu, Bioresour. Technol., 2016, 207, 188–196 CrossRef CAS PubMed.
- Q. Lu, X.-n. Ye, Z.-b. Zhang, M.-S. Cui, H.-q. Guo, W. Qi, C.-q. Dong and Y.-p. Yang, Energy Fuels, 2016, 30, 10618–10626 CrossRef CAS.
- Q. Lu, Z.-b. Zhang, X.-c. Yang, C.-q. Dong and X.-f. Zhu, J. Anal. Appl. Pyrolysis, 2013, 104, 139–145 CrossRef CAS.
- Z.-B. Zhang, Q. Lu, X.-N. Ye, L.-P. Xiao, C.-Q. Dong and Y.-Q. Liu, BioResources, 2014, 9, 4050–4062 Search PubMed.
- Q. Bu, H. Lei, L. Wang, Y. Wei, L. Zhu, X. Zhang, Y. Liu, G. Yadavalli and J. Tang, Bioresour. Technol., 2014, 162, 142–147 CrossRef CAS PubMed.
- Q. Bu, H. Lei, L. Wang, G. Yadavalli, Y. Wei, X. Zhang, L. Zhu and Y. Liu, J. Anal. Appl. Pyrolysis, 2015, 112, 74–79 CrossRef CAS.
- Q. Bu, H. Lei, S. Ren, L. Wang, J. Holladay, Q. Zhang, J. Tang and R. Ruan, Bioresour. Technol., 2011, 102, 7004–7007 CrossRef CAS PubMed.
- Q. Bu, H. Lei, S. Ren, L. Wang, Q. Zhang, J. Tang and R. Ruan, Bioresour. Technol., 2012, 108, 274–279 CrossRef CAS PubMed.
- Q. Bu, H. Lei, L. Wang, Y. Wei, L. Zhu, Y. Liu, J. Liang and J. Tang, Bioresour. Technol., 2013, 142, 546–552 CrossRef CAS PubMed.
- C. Peng, G. Zhang, J. Yue and G. Xu, Fuel Process. Technol., 2014, 124, 212–221 CrossRef CAS.
- D. Prahas, Y. Kartika, N. Indraswati and S. Ismadji, Chem. Eng. J., 2008, 140, 32–42 CrossRef CAS.
- P. Z. Guo, Q. Q. Ji, L. L. Zhang, S. Y. Zhao and X. S. Zhao, Acta Phys.-Chim. Sin., 2011, 27, 2836–2840 CAS.
- L. Zhu, H. Lei, L. Wang, G. Yadavalli, X. Zhang, Y. Wei, Y. Liu, D. Yan, S. Chen and B. Ahring, J. Anal. Appl. Pyrolysis, 2015, 115, 149–156 CrossRef CAS.
- G. Yadavalli, H. Lei, Y. Wei, L. Zhu, X. Zhang, Y. Liu and D. Yan, Biomass Bioenergy, 2017, 98, 53–60 CrossRef CAS.
- S. Ren, H. Lei, L. Wang, Q. Bu, S. Chen and J. Wu, RSC Adv., 2014, 4, 10731–10737 RSC.
- L. Wang, H. Lei, J. Lee, S. Chen, J. Tang and B. Ahring, RSC Adv., 2013, 3, 14609–14615 RSC.
- P. Voogd, J. Scholten and H. Van Bekkum, Colloid. Surface., 1991, 55, 163–171 CrossRef CAS.
- J. A. Menéndez, A. Domínguez, Y. Fernández and J. J. Pis, Energy Fuels, 2007, 21, 373–378 CrossRef.
- H. Teng, T.-S. Yeh and L.-Y. Hsu, Carbon, 1998, 36, 1387–1395 CrossRef CAS.
- S. Zuo, J. Yang, J. Liu and X. Cai, Fuel Process. Technol., 2009, 90, 994–1001 CrossRef CAS.
- F. Arena, R. Dario and A. Parmaliana, Appl. Catal., A, 1998, 170, 127–137 CrossRef CAS.
- X. Lin, Z. Zhang, J. Sun, W. Guo and Q. Wang, J. Anal. Appl. Pyrolysis, 2015, 116, 223–230 CrossRef CAS.
- T. Cordero-Lanzac, R. Palos, J. M. Arandes, P. Castaño, J. Rodríguez-Mirasol, T. Cordero and J. Bilbao, Appl. Catal. B Environ., 2017, 203, 389–399 CrossRef CAS.
- G. Luo and F. L. P. Resende, Fuel, 2016, 166, 367–375 CrossRef CAS.
- L. Fan, P. Chen, N. Zhou, S. Liu, Y. Zhang, Y. Liu, Y. Wang, M. M. Omar, P. Peng, M. Addy, Y. Cheng and R. Ruan, Bioresour. Technol., 2018, 247, 851–858 CrossRef CAS.
- K. Wang, P. A. Johnston and R. C. Brown, Bioresour. Technol., 2014, 173, 124–131 CrossRef CAS PubMed.
- S.-S. Liaw, Z. Wang, P. Ndegwa, C. Frear, S. Ha, C.-Z. Li and M. Garcia-Perez, J. Anal. Appl. Pyrolysis, 2012, 93, 52–62 CrossRef CAS.
- L. Li, Z. Song, X. Zhao, C. Ma, X. Kong and F. Wang, Chem. Eng. J., 2016, 284, 1308–1316 CrossRef CAS.
Footnote |
| † Electronic supplementary information (ESI) available. See DOI: 10.1039/c7se00607a |
|
| This journal is © The Royal Society of Chemistry 2018 |
Click here to see how this site uses Cookies. View our privacy policy here.  *b,
Kezhen
Qian
b,
Yayun
Zhang
b and
Elmar
Villota
b
![[thin space (1/6-em)]](https://www.rsc.org/images/entities/char_2009.gif) :
:![[thin space (1/6-em)]](https://www.rsc.org/images/entities/char_2009.gif) 1. After phase separation, the bottom layer (solvent phase) was sampled for analysis. The initial GC oven temperature was set to 40 °C and held for 2 min, and then increased to a final temperature of 280 °C at 10 °C min−1 and held for 10 min. The inlet temperature was kept constant at 280 °C, and the sample injection was made in the splitless mode. High purity helium (99.99%) was used as the carrier gas at a flow rate of 0.9 ml min−1. The compounds were identified by comparing their mass spectra with National Institute of Standards and Technology (NIST) mass spectral library. The concentrations of selected compounds in bio-oil in terms of mg ml−1 were determined using external standards calibration method. Briefly, a stock solution was prepared by dissolving 1 g of each individual calibration compound in a 100 ml volumetric flask containing analytical grade dichloromethane. Aliquots of the 10
1. After phase separation, the bottom layer (solvent phase) was sampled for analysis. The initial GC oven temperature was set to 40 °C and held for 2 min, and then increased to a final temperature of 280 °C at 10 °C min−1 and held for 10 min. The inlet temperature was kept constant at 280 °C, and the sample injection was made in the splitless mode. High purity helium (99.99%) was used as the carrier gas at a flow rate of 0.9 ml min−1. The compounds were identified by comparing their mass spectra with National Institute of Standards and Technology (NIST) mass spectral library. The concentrations of selected compounds in bio-oil in terms of mg ml−1 were determined using external standards calibration method. Briefly, a stock solution was prepared by dissolving 1 g of each individual calibration compound in a 100 ml volumetric flask containing analytical grade dichloromethane. Aliquots of the 10![[thin space (1/6-em)]](https://www.rsc.org/images/entities/char_2009.gif) 000 μg ml−1 stock solution was then diluted to concentrations of 400, 600, 800, 1000, 1500, and 2000 μg ml−1. 1 μL of each stock solution was injected into the GC-MS and the peak area of each standard compound was then plotted against the mass of the compound in μg ml−1 solution and then linearly regressed to obtain the calibration curve of the compound. The R2 value was greater than 0.98 for all standards. The regression equation was then used to calculate the concentrations of selected compounds in bio-oil samples.
000 μg ml−1 stock solution was then diluted to concentrations of 400, 600, 800, 1000, 1500, and 2000 μg ml−1. 1 μL of each stock solution was injected into the GC-MS and the peak area of each standard compound was then plotted against the mass of the compound in μg ml−1 solution and then linearly regressed to obtain the calibration curve of the compound. The R2 value was greater than 0.98 for all standards. The regression equation was then used to calculate the concentrations of selected compounds in bio-oil samples.

![[double bond, length as m-dash]](https://www.rsc.org/images/entities/char_e001.gif) C structures. The peaks at 1050, 1122 and 1150 may correspond to characteristic structures of cellulose and hemicellulose, including primary alcohol (–CH2OH), secondary alcohol (–CHROH) and ether (–C–O–C).24 After activation, the peak at 1122 cm−1 nearly diminished since phosphoric acid can oxidize hydroxyl groups into phosphoric-containing acidic groups, such as –C–O–PO3 and –C–PO3 on carbon surface.34 The presence of phosphorous was confirmed by EDX analysis (Fig. S1†). From the results of physical and chemical properties analysis, it can be concluded that the prepared AC showed a highly porous structure with acidic functionality, and could provide excellent catalytic reactivity for biomass conversion.
C structures. The peaks at 1050, 1122 and 1150 may correspond to characteristic structures of cellulose and hemicellulose, including primary alcohol (–CH2OH), secondary alcohol (–CHROH) and ether (–C–O–C).24 After activation, the peak at 1122 cm−1 nearly diminished since phosphoric acid can oxidize hydroxyl groups into phosphoric-containing acidic groups, such as –C–O–PO3 and –C–PO3 on carbon surface.34 The presence of phosphorous was confirmed by EDX analysis (Fig. S1†). From the results of physical and chemical properties analysis, it can be concluded that the prepared AC showed a highly porous structure with acidic functionality, and could provide excellent catalytic reactivity for biomass conversion.


![[thin space (1/6-em)]](https://www.rsc.org/images/entities/char_2009.gif) :
:![[thin space (1/6-em)]](https://www.rsc.org/images/entities/char_2009.gif) 1) should be used in order to produce bio-oil rich-in phenols. Garcia-Perez et al.38 obtained the maximum mono-phenols concentration between 400 to 450 °C from auger pyrolysis of Douglas fir wood. Jiang et al.12 reported the highest phenol concentration (4.13 mg ml−1) at 500 °C from microwave pyrolysis of palm kernel shell using commercial AC as the microwave absorber. The secondary cracking reactions were intensified at elevated temperatures, resulting the conversion of large phenolic compounds into mono-phenols. Obviously, the addition of AC can decrease the temperature requirement for secondary cracking reactions compared to noncatalytic pyrolysis.
1) should be used in order to produce bio-oil rich-in phenols. Garcia-Perez et al.38 obtained the maximum mono-phenols concentration between 400 to 450 °C from auger pyrolysis of Douglas fir wood. Jiang et al.12 reported the highest phenol concentration (4.13 mg ml−1) at 500 °C from microwave pyrolysis of palm kernel shell using commercial AC as the microwave absorber. The secondary cracking reactions were intensified at elevated temperatures, resulting the conversion of large phenolic compounds into mono-phenols. Obviously, the addition of AC can decrease the temperature requirement for secondary cracking reactions compared to noncatalytic pyrolysis.


