Catalytic conversion of cyanobacteria-derived fatty acids to alkanes for biorenewable synthetic paraffinic kerosene†
Taylor C.
Schulz
a,
Mason
Oelschlager
b,
Simon T.
Thompson
a,
Wim F. J.
Vermaas
c,
David R.
Nielsen
b and
H. Henry
Lamb
 *a
*a
aDepartment of Chemical and Biomolecular Engineering, North Carolina State University, Raleigh, NC 27695, USA. E-mail: lamb@ncsu.edu; Tel: +1-919-515-6395
bChemical Engineering, School for Engineering of Matter, Transport, and Energy, Arizona State University, Tempe, AZ 85287, USA
cSchool of Life Sciences, Arizona State University, Tempe, AZ 85287, USA
First published on 9th February 2018
Abstract
A two-step catalytic process for converting cyanobacteria-derived fatty acids (CBFAs) to linear and branched alkanes for biorenewable synthetic paraffinic kerosene was demonstrated. Fatty acids synthesized and secreted into the growth medium by an engineered strain of the cyanobacterium Synechocystis sp. PCC 6803 were recovered from 20 liter photobioreactor cultures by adsorption on hydrophobic resin beads. By design, lauric acid (LA, C12:0, ∼80% w/w) was the main CBFA constituent; however, myristic acid (MA, C14:0, 6–10% w/w), palmitic acid (PA, C16:0, 2–6% w/w), and β-hydroxymyristic acid (BHMA, 2–3% w/w) also were produced. LA and MA model compounds were deoxygenated over a 5 wt% Pd/C catalyst to n-undecane and n-tridecane, respectively, with high yields and CO2 selectivities. Major products of BHMA deoxygenation over Pd/C were n-tridecane and 2-tridecanone. BHMA concentrations typical of the CBFA samples were found to inhibit LA deoxygenation. Because Pd sites responsible for fatty acid decarboxylation are poisoned at sulfur concentrations [S] typical of crude CBFA samples (100–150 ppm), post-recovery purification procedures were developed and evaluated based on their efficacy in reducing S-containing impurities. Deoxygenation of CBFAs was most effective when purification procedures limited [S] to <15 ppm, as evidenced by >80% n-alkane yield and ∼90% CO2 selectivity. The n-alkane products of CBFA deoxygenation were hydroisomerized in the liquid phase (with added n-dodecane) over a 0.70 wt% Pt/CaY catalyst. The resultant mixtures had isoalkane/normal alkane ratios of 0.25–0.50.
1. Introduction
Global economic growth over the past 2–3 decades has caused the growth rate of CO2 emissions to increase from 1% to 3.4% annually.1 Replacing fossil fuels with biorenewable and carbon-neutral fuels is essential to curbing this acceleration. Because of their oxygen content, first-generation biofuels (such as ethanol) have lower energy densities than fossil fuels.2 Moreover, these first-generation biofuels also compete with the food supply, and thus, are less desirable long-term alternatives.3 In 2011, the World Bank estimated that increased corn ethanol production was responsible for the nearly 30% increase in corn price between 2007 and 2009.4 Second-generation biofuels, such as those derived from lignocellulosic biomass, have been shown to increase land-use efficiency and avoid competition with food sources;3 however, these technologies do not have the commercial viability required for replacement of fossil fuels. The use of photosynthetic microorganisms (e.g., algae and cyanobacteria) has been proposed as an alternative to biomass production that will avoid competition with food sources and further increases land-use efficiency.5,6 The work presented herein focuses on the production of synthetic paraffinic kerosene (SPK) from fatty acids (FAs) synthesized by an engineered strain of cyanobacteria. Freshwater and marine strains of Synechocystis cyanobacteria produce lipids with chain lengths predominantly between 14 and 18 carbons, but at relatively low yields.7–9 In recent research directed at biofuel production, Synechocystis sp. PCC 6803 was engineered to instead overproduce free FAs in the C12 range.10–12 These cyanobacteria-derived fatty acids (CBFAs) are subsequently secreted into the growth medium, from which they can be directly recovered.As with triacylglycerides (TAGs), catalytic deoxygenation of FAs can be accomplished by hydrodeoxygenation (HDO) over conventional petroleum hydroprocessing catalysts (e.g., NiMo/Al2O3)13 and by decarbonylation (DCN)/decarboxylation (DCX) over supported noble metal catalysts (e.g., Pd/C).14–25 In HDO, oxygen is removed as H2O (requiring 1 mole H2 per mole of O), and the product alkane (CnH2n+2) contains all the (n) carbon atoms in the parent FA. DCN and DCX are the principal pathways for FA deoxygenation over supported Pd. DCN produces CO, H2O, and an alkene (Cn−1H2n−2) with one less carbon atom than the parent FA; subsequent hydrogenation of the alkene requires 1 mole H2 per mole alkane produced. DCX produces CO2 and an (Cn−1H2n) n-alkane. In biofuel applications, DCX may be preferable to either HDO or DCN due to its lower H2 requirement.14 Pd supported on activated carbon (Pd/C) is one of the most effective noble metal catalysts for producing n-alkanes from FAs by DCX. Deoxygenation of stearic acid (SA) over Pd/C under an inert (He) atmosphere proceeds with a CO2 selectivity of ∼90%. Although the initial rate of SA deoxygenation is higher under He, more unsaturated hydrocarbon products are generated, and complete SA conversion requires much longer processing times (4–5 h). By adding ∼10% H2 to the reactor purge stream to prevent catalyst deactivation, complete SA conversion to a >99% n-heptadecane (n-C17) product was achieved in ∼50 min.15
Catalytic hydroisomerization (HI) is required to produce SPK from the normal alkanes (n-alkanes) resulting from deoxygenation CBFAs. SPK can be defined as a mixture of normal, branched, and cyclic paraffins with carbon numbers between 9 and 15.26,27 Conventional jet fuels (e.g., Jet A, JP-5 and JP-8) have freezing points below −40 °C.28,29n-Alkanes in this carbon number range (with the exception of n-nonane) have much higher freezing points. Petroleum-derived jet fuels have lower freezing points because they contain isoalkanes (i-alkanes), cycloalkanes and aromatic compounds. For example, Jet-A aviation fuel consists of 20% n-alkanes, 30% i-alkanes, 30% cycloalkanes, and 20% aromatic compounds (on a weight basis). JP-8 consists of approximately 25% n-alkanes, 30% i-alkanes, 25% cycloalkanes, and 20% aromatics.30 Long-chain n-alkanes can be hydroisomerized to branched alkanes with very high selectivity at moderate conversions (∼40%) over Pt/CaY.31 Increased hydrocracking (loss of isomerization selectivity) over bifunctional metal-zeolite catalysts is typically observed at high n-alkane conversion.31,32 Fortunately, a high i-alkane content is not required to significantly lower the freezing point of SPK mixtures.
In this work, CBFAs synthesized by an engineered strain of Synechocystis sp. PCC 6803, comprising primarily lauric acid (LA), were recovered from photobioreactor cultures, purified, and subsequently deoxygenated to n-alkanes using a Pd/C catalyst. Sulfur (S)-containing impurities and β-hydroxymyristic acid (BHMA) were found to negatively impact n-alkane yield and CO2 selectivity. BHMA, a cell membrane constituent in Gram-negative bacteria including Synechocystis,33,34 was present at 2–3% w/w in crude CBFA samples. Sulfur concentrations in crude CBFA samples were typically 100–150 ppm, but levels of up to 450 ppm were encountered. Post-recovery purification methods aimed at removing S-containing impurities and BHMA, including solvent extraction, recrystallization, acid/base hydrolysis, activated carbon (AC) treatment, and preparative-scale C18 liquid chromatography (LC) were investigated, and the most efficacious are described in detail herein. Finally, the CBFA-derived n-alkanes were hydroisomerized over a 0.70 wt% Pt/CaY catalyst to produce mixtures of linear and branched alkanes for biorenewable SPK.
2. Experimental
2.1 Materials
The following chemicals were purchased from Acros Organics: n-dodecane (n-C12, 99%), n-C17 (99%), and myristic acid (MA, 99%). The following chemicals were obtained from Aldrich: n-hexane, n-decane (C10, 99%), n-tridecane (n-C13, 99%), and 1-heptadecene (1-C17-ene, 99%). Lauric acid (LA, min. 99%), heptadecanoic acid, and liquid chromatography-mass spectrometry (LC-MS) H2O were purchased from Sigma. LC-MS methanol (MeOH) and ammonium hydroxide (NH4OH) were purchased from Fisher Optima and Fluka, respectively. n-Undecane (n-C11, min. 99%) was purchased from TCI America. BHMA (98% min.) was purchased from Finetech Industry, Ltd. 2-Tridecanone (2-C13-ONE, 98%) and 2-tridecanol (2-C13-OH, >98%) were purchased from Alfa Aesar. He (ultra-high purity), H2 (ultra-high purity), O2 (extra dry), and a calibration gas mixture (1% CH4/5% H2/5% CO/5% CO2/balance He) were each purchased from Airgas National Welders. Dowex Optipore L-493 resin was purchased from Dow Chemical. A 5 wt% Pd/C catalyst was purchased from Evonik (E117). NaY zeolite (SiO2![[thin space (1/6-em)]](https://www.rsc.org/images/entities/char_2009.gif) :
:![[thin space (1/6-em)]](https://www.rsc.org/images/entities/char_2009.gif) Al2O3 ratio = 5.1) was purchased from Zeolyst. Tetraamineplatinum(II) hydroxide [Pt(NH3)4(OH)2] was purchased from Strem Chemicals.
Al2O3 ratio = 5.1) was purchased from Zeolyst. Tetraamineplatinum(II) hydroxide [Pt(NH3)4(OH)2] was purchased from Strem Chemicals.
2.2 Catalyst preparation
CaY zeolite was prepared by exchanging NaY overnight three times with a Ca(NO3)2 solution at 80 °C. Pt/CaY was prepared by ion exchange of [Pt(NH3)4(OH)2] with the CaY. A solution was prepared by dissolving 0.0919 g [Pt(NH3)4(OH)2] hydrate in 9.159 g 18.2 MΩ cm deionized (DI) H2O. A slurry was made by suspending 5.289 g CaY in 21.286 g DI H2O and it was heated to 80 °C. After the slurry reached 80 °C, the Pt solution was added dropwise, and the burette was rinsed with 10 mL H2O, which was added to the slurry. This mixture was held at 80 °C overnight before being cooled. The resulting powder was recovered via vacuum filtration. The filter cake was rinsed three times with DI water (25 mL each) and then dried at 110 °C overnight. Subsequently, the Pt/CaY powder (2.0 g) was calcined by heating at 0.5 °C min−1 to 350 °C in flowing extra dry O2 (600 sccm) and holding for 3 h. The loading of the resultant catalyst (0.704 wt% Pt) was determined via inductively coupled plasma optical emission spectrometry (ICP-OES) by the Environmental and Agricultural Testing Service (EATS) at North Carolina State University. The calcined Pt/CaY catalyst was reduced ex situ at 400 °C prior to use. Approximately 0.360 g Pt/CaY was loaded into a fritted quartz U-tube reactor and purged with 60 sccm He. The gas was switched to 60 sccm H2, and the catalyst was heated at 5 °C min−1 to 400 °C and held for 1 h. After cooling to 25 °C in flowing H2, the reactor was purged with 60 sccm He. Subsequently, the flow was stopped and the fittings holding the U-tube were loosened to allow air to contact the catalyst very slowly.2.3 CBFA production and recovery
An engineered strain of Synechocystis sp. PCC 6803 previously developed to produce and secrete FAs was cultured at 30 °C in 15 L carboys containing 12 L of BG-11 media with continuous air sparging and constant illumination by indoor light at 140 μmol photons m−2 s−1. To facilitate CBFA recovery, approximately 30–40 g of Dowex Optipore L-493 adsorbent resin was added to each carboy.35 After 2–3 weeks of continuous culture, resins were recovered by filtration and rinsed briefly with water to remove cells and debris. To recover adsorbed CBFAs, the resin was first eluted by equilibration with 20 mL g−1 of a 1 M solution of formic acid in MeOH. The resulting solution was dried in air overnight to remove the solvent, leaving behind a solid residue containing the CBFA. The sample was next extracted with a biphasic mixture consisting of 6 volumes of 1 M HCl and 2.5 volumes of n-hexane. Following overnight equilibration, the CBFA-containing solvent phase was removed before n-hexane was then stripped from the extract by gently flowing compressed air over the surface, leaving behind a solid product enriched in CBFA content. On average, this entire procedure yielded approximately 36 mg crude CBFA/L culture.2.4 CBFA purification
Secondary liquid–liquid extraction in 1 M HCl/n-hexane involved a repeated application of the protocol described above. Recrystallization comprised the following steps: dissolve about 1.75 g of crude CBFA product in MeOH (100 mL), slowly add 50 mL of DI water, cool to and store at 4 °C overnight, and recover the solid CBFA by filtration. AC treatment involved dissolving the raw CBFA in excess n-hexane (10 mL g−1) and then adding 0.1 g mL−1 AC (Strem Chemicals). The resultant slurry was mixed gently at 25 °C using an orbital shaker. After 3 h, solids were removed via vacuum filtration, and the supernatant was contacted again with fresh AC. After repeating this process for a total of up to 4 cycles, the treated CBFA sample was then recovered by evaporation of the hexane solvent. In alkaline hydrolysis, samples were first dissolved in excess (40 mL g−1) 1 M NaOH before heating the solution in an autoclave at 121 °C for 2 h/cycle for up to 4 cycles (samples were cooled to room temperature between cycles). Following the final cycle, the solution was adjusted to pH 2 by titration with 5 M HCl before adding half a volume of n-hexane to extract the CBFAs, which were then recovered by solvent evaporation, performed as above.Preparative-scale C18 (reverse-phase) LC was performed by first dissolving crude CBFA samples in an excess (20 mL g−1) of 45% v/v MeOH in water. The resulting solution was then loaded onto C18-functionalized silica adsorbent contained in a vertical glass column with a fritted glass outlet (to retain the adsorbent bed). Approximately 5 g adsorbent was used per 1 g CBFA processed and the solution passed slowly through the column by gravity. Following initial sample loading, the adsorbent bed was the subjected to elution using aqueous MeOH solutions of various concentrations as the mobile phase and two general approaches. Initially, the mobile solution consisted of either 75% or 100% MeOH, added to the column at a ratio of 50 mL g−1 CBFA sample initially loaded onto the column. To provide improved separation, a gradient elution method was later devised wherein a series of mobile phase solutions containing 0 to 100% MeOH in increments of 2.5 or 5% were instead used. In this case, at each step along the gradient, the mobile phase was added to the column at a ratio of 10 mL g−1 CBFA initially loaded onto the column. In this case, most of the CBFA sample was found to be eluted from the column when using a mobile phase containing between 65 and 100% MeOH. In both approaches, all fractions were individually collected as they exited the column and allowed to air dry to recover the treated CBFA sample.
2.5 CBFA characterization
CBFA samples were esterified with BF3–MeOH and then analyzed by gas chromatography (GC) with flame-ionization detection (FID).36 The Perkin Elmer Autosampler XL GC was equipped with an SGE BPX70 (30 m length × 0.25 mm inner diameter × 0.25 μm film thickness) capillary column.Electrospray ionization-mass spectrometry (ESI-MS) was also used to determine CBFA composition. Dried extract samples weighing 3–5 mg were collected and placed in previously weighed Eppendorf tubes. The weights of the dried samples were determined to within 0.1 mg. The samples were then dissolved in MeOH at a final concentration 5 mg mL−1. Serial 100× and 10× dilutions were made, with the final sample containing 5 μM heptadecanoic acid, 1 mM NH4OH, and 5 μg mL−1 of the FA extract. This sample was then infused at 3 μL min−1via the ESI source of the MicrOTOF-Q MS using a KD Scientific model KDS-100-CE syringe pump. Mass spectra obtained in the negative-ion mode were averaged over 3 min. FA concentrations were determined using heptadecanoate (m/z = 269.25) as an internal standard.
ICP-OES of CBFA samples was performed by the EATS at North Carolina State University, the Goldwater Environmental Lab at Arizona State University and/or by Galbraith Labs (Knoxville, TN) to quantify ppm levels of S, P, Na, Mg, and Ca.
2.6 FA deoxygenation
The 50 mL stirred autoclave reactor system with on-line quadrupole mass spectrometer (QMS) and procedures for semi-batch and fed-batch deoxygenation of FAs have been described in detail previously.14,15 Typical reactor charge for semi-batch operation: 0.335 g Pd/C catalyst, 22.5 g n-C12 solvent and 1.15 g of CBFA. Typical reaction conditions: 300 °C and 15 bar in flowing 5 mol% H2 (60 mL min−1, STP). Semi-batch reaction time was 4 h, unless otherwise noted. Fed-batch experiments were begun with the catalyst suspended in ∼12.5 g n-C12 using a CBFA feed rate of 13 μL min−1.Liquid products were analyzed using a Shimadzu GC-2010 Plus GC-FID with a Restek RTX-5 capillary column (30 m length × 0.32 mm inner diameter × 1 μm film thickness), a constant linear velocity of 30.3 cm s−1, and a split ratio of 50![[thin space (1/6-em)]](https://www.rsc.org/images/entities/char_2009.gif) :
:![[thin space (1/6-em)]](https://www.rsc.org/images/entities/char_2009.gif) 1. CBFA deoxygenation products were analyzed by ramping the oven at 10 °C min−1 from 120 to 300 °C and holding at 300 °C for 7 min. Products from BHMA (and related compounds) deoxygenation were analyzed with the following temperature program: ramp at 10 °C min−1 from 120 to 195 °C, cool at 20 °C min−1 to 157 °C, hold at 157 °C for 3 min, ramp to 300 °C at 20 °C min−1, and hold for 7 min at 300 °C. The cooling stage in this temperature ramp was utilized to enhance separation of 2-C13-OH and 2-C13-ONE. Product concentrations were determined using a three-point calibration method with a C10 internal standard. Response factors for n-alkenes other than 1-C17-ene were assumed to be equivalent to their corresponding n-alkanes, which shown to be true for FID response factors for shorter n-alkanes and n-alkenes.37n-Alkane yields were determined by dividing the total moles of n-alkanes produced from the reaction by the total reactant moles added to the reactor.
1. CBFA deoxygenation products were analyzed by ramping the oven at 10 °C min−1 from 120 to 300 °C and holding at 300 °C for 7 min. Products from BHMA (and related compounds) deoxygenation were analyzed with the following temperature program: ramp at 10 °C min−1 from 120 to 195 °C, cool at 20 °C min−1 to 157 °C, hold at 157 °C for 3 min, ramp to 300 °C at 20 °C min−1, and hold for 7 min at 300 °C. The cooling stage in this temperature ramp was utilized to enhance separation of 2-C13-OH and 2-C13-ONE. Product concentrations were determined using a three-point calibration method with a C10 internal standard. Response factors for n-alkenes other than 1-C17-ene were assumed to be equivalent to their corresponding n-alkanes, which shown to be true for FID response factors for shorter n-alkanes and n-alkenes.37n-Alkane yields were determined by dividing the total moles of n-alkanes produced from the reaction by the total reactant moles added to the reactor.
2.7 Alkane hydroisomerization
Liquid-phase alkane HI was conducted using a 100 mL Parr high-pressure batch reactor charged with 0.350 g Pt/CaY catalyst and ∼25 g n-alkane reactant. The reactor was purged five times with H2 at 250 psig and once at 500 psig, and then charged with 500 psig H2. After a 5–10 min waiting period for leak testing, the reactor was stirred continuously at 240 rpm (via glass stir bar in the reactor) and heated at 10 °C min−1 to 300 °C with a heating jacket. The reaction was quenched by removing the furnace from the reactor and cooling the reactor rapidly using a fan and subsequent soaks in water and ice baths.HI products were analyzed using a Shimadzu GC-2010 GC-FID with an EconoCap EC-1 capillary column (30 m length × 0.32 mm inner diameter × 1 μm film thickness). The oven temperature program comprised 3 segments: 5 min hold at 30 °C, ramp from 30 °C to 280 °C at 10 °C min−1, and a 5 min hold at 280 °C. The weight percentage of each alkane species was estimated from its area percentage. Alkanes in the C14–C32 range have equivalent GC-FID response factors (within error);38 therefore, we assumed that the area percentage of each species equaled its weight percentage in the mixture.
3. Results and discussion
3.1 CBFA post-recovery purification
Table 1 provides a summary of individual CBFA samples and their purification methods (where applicable). Crude CBFA samples (not subjected to post-recovery purification) were yellow indicating the presence of impurities. For example, FA03 (pictured in Fig. S1†) was recovered and pretreated twice by solvent extraction using hexane over 1 M HCl. Subsequent AC treatment (decolorization) of this sample was effective at removing the yellow impurities. GC-FID analysis (Table 2) evidenced that the crude (FA01), recrystallized (FA02A), and AC-treated (FA03A) CBFA samples contained ∼80% LA, 6–10% MA, 2–3% PA, <1% SA and <1% w/w capric acid (CA). Contributions from unsaturated C12 and C14 FAs were negligible (≪1% w/w); however, unsaturated species comprised a significant portion of the C16 and C18 FAs. There were typically 1–3% unknown FAs, and each sample contained only ∼75% total FAs. Hydroxy FAs were not quantified by GC-FID; however, these species may have contributed to the unknown fraction. ESI-MS analysis (Table 3) was utilized primarily to detect and quantify levels of BHMA and β-hydroxylauric acid (BHLA). The BHMA concentrations were 2–3% w/w in the crude and AC-treated CFBA samples, and the BHLA and BHMA concentrations were typically comparable (see, e.g., FA06). ESI-MS indicated that crude FA06 contained ∼80% total FAs with ∼76% LA, 7% MA, 3% PA, <1% SA and <1% w/w CA. In addition, the FA profile and total FA content for FA03A are in very good agreement with the GC-FID results.| Sample | Post-recovery purification | [S] (ppm) | [P] (ppm) |
|---|---|---|---|
| a AC: activated carbon treatment. b C18 LC: preparative-scale C18 liquid chromatography. c X% MeOH: methanol concentration in C18 column eluent. For single values, samples were eluted with only one eluent concentration. For multiple values, stepwise gradient elution was employed, and the reported values represent the elution fractions comprising the sample. | |||
| FA01 | None | 157 | 8 |
| FA02 | None | 159 | <21 |
| FA02A | Recrystallization | 109 | <20 |
| FA03 | 2× HCl/n-hexane extraction | — | — |
| FA03A | 2× HCl/n-hexane extraction; ACa | — | — |
| FA04 | C18 LCb (75% MeOH)c | 73 | 5 |
| FA05 | C18 LC (100% MeOH) | 198 | 16 |
| FA06 | None | 454 | — |
| FA06A | C18 LC (75, 80, 85% MeOH) | 75 | 8 |
| FA06B | C18 LC (75, 77.5, 80, 82.5% MeOH) | 12 | — |
| FA07 | None | 104 | — |
| FA07A | Alkaline hydrolysis | 39 | — |
| FA07B | 2× alkaline hydrolysis | <10 | — |
| FA08A | AC; C18 LC (75% MeOH) | 60 | — |
| FA08B | AC; C18 LC (100% MeOH) | 89 | — |
| FA09 | Alkaline hydrolysis; 4× AC | 102 | — |
| FA10 | 4× alkaline hydrolysis; 4× AC | 29 | — |
| Sample | Percent of total fatty acids (w/w) | |||||
|---|---|---|---|---|---|---|
| Fatty acida | FA01 | FA02A | FA03A | FA06A | FA06B | FA07B |
| a Cn:m refers to the carbon number of the FA (n) and the degree of unsaturation (m) (number of C–C double bonds in the alkyl chain). b Authentic standard not available to confirm identification. c Largest contribution peak eluting immediately after C12:0. | ||||||
| C10:0 | 0.60 | 0.00 | 0.42 | 0.05 | 0.00 | 0.27 |
| C10:1b | 0.00 | 0.00 | 0.00 | 0.11 | 0.00 | 0.30 |
| C12:0 | 79.09 | 80.33 | 81.58 | 77.02 | 78.82 | 82.03 |
| C14:0 | 6.60 | 10.10 | 7.61 | 10.94 | 0.19 | 8.47 |
| C14:1 trans | 0.00 | 0.00 | 0.00 | 0.02 | 0.00 | 0.00 |
| C14:1 cis | 0.13 | 0.00 | 0.00 | 0.10 | 0.06 | 0.00 |
| C16:0 | 2.78 | 2.60 | 3.18 | 3.94 | 0.00 | 3.43 |
| C16:1 trans | 0.00 | 0.00 | 0.00 | 0.05 | 0.00 | 0.00 |
| C16:1 cis | 1.30 | 0.51 | 0.78 | 1.95 | 0.00 | 0.77 |
| C16:3 cisb | 0.00 | 1.35 | 0.00 | 0.42 | 0.00 | 0.70 |
| C16:4 cis | 0.00 | 0.59 | 0.00 | 0.95 | 0.00 | 0.00 |
| C18:0 | 0.35 | 0.00 | 0.34 | 0.02 | 0.00 | 0.00 |
| C18:1 cis | 1.46 | 0.00 | 0.35 | 0.08 | 0.00 | 0.00 |
| C18:2 cis | 1.97 | 1.42 | 0.74 | 0.73 | 0.00 | 0.54 |
| C18:3 cis 6 | 1.66 | 1.66 | 0.65 | 0.17 | 0.00 | 0.24 |
| C18:3 cis 9 | 0.12 | 0.00 | 0.08 | 0.03 | 0.00 | 0.00 |
| C20:1 cis | 0.00 | 0.00 | 0.15 | 0.00 | 0.00 | 0.08 |
| Unknowns | 2.08 | 1.04 | 2.64 | 2.50 | 20.93c | 1.48 |
| Total FA content (mg g−1) | 755 | 749 | 767 | 800 | 888 | 895 |
| Sample | Percent of total fatty acids (w/w) | ||||||
|---|---|---|---|---|---|---|---|
| Fatty acida | FA03A | FA06 | FA06A | FA06B | FA07B | FA09 | FA10 |
| a Cn:m refers to the carbon number of the FA (n) and the degree of unsaturation (m) (number of C–C double bonds in the alkyl chain). | |||||||
| C10:0 | 0.43 | 0.40 | 0.00 | 0.00 | 0.41 | 0.40 | 0.42 |
| C12:0 | 79.09 | 76.54 | 74.05 | 97.04 | 75.71 | 82.84 | 78.33 |
| BHLA | — | 2.76 | — | 0.00 | 4.44 | 0.65 | 0.91 |
| C14:0 | 8.21 | 6.92 | 9.80 | 0.25 | 8.02 | 7.00 | 8.16 |
| BHMA | 1.80 | 2.74 | 0.95 | 0.14 | 2.48 | 0.11 | 0.26 |
| C16:0 | 4.61 | 2.94 | 6.08 | 0.75 | 3.30 | 1.78 | 3.38 |
| C16:1 | 1.02 | 1.02 | 4.19 | 0.61 | 0.88 | 0.11 | 0.99 |
| C18:0 | 1.56 | 0.14 | 0.72 | 0.43 | 0.95 | 0.07 | 0.36 |
| C18:1 | 1.13 | 1.01 | 2.51 | 0.23 | 0.78 | 0.41 | 1.10 |
| C18:2 | 1.38 | 2.64 | 1.30 | 0.07 | 0.76 | 2.38 | 2.60 |
| C18:3 | 0.76 | 1.65 | 0.39 | 0.06 | 0.42 | 2.02 | 1.95 |
| Total FA content (mg g−1) | 798 | 807 | 849 | 914 | 973 | 779 | 897 |
ICP-OES analysis of FA01 found 157 ppm S, 7.94 ppm P, 33.9 ppm Na, 8.52 ppm Mg, and 30.2 ppm Ca. Among these impurities, S and P are potential catalyst poisons, and alkali and alkaline earth metals may act as catalyst modifiers and/or promoters. Sulfur concentrations in crude CBFA samples were typically in the 100–150 ppm range, and phosphorus concentrations were 8–20 ppm (Table 1). FA06 was more heavily contaminated with S. As demonstrated below, S impurities severely degrade the deoxygenation performance of the Pd/C catalyst. Consequently, several post-recovery purification procedures, including preparative-scale C18 LC and alkaline hydrolysis, were developed and evaluated for their efficacies in reducing S concentrations.
Preliminary C18 LC experiments indicated that CBFA fractions eluted in the range of 75 to 85% MeOH–water were LA-rich and contained lower levels of S and P than those eluted with 100% MeOH (see FA04 and FA05, Table 1). Subsequently, CBFA samples were purified by C18 LC using stepwise gradient elution to achieve almost complete removal of β-hydroxy FAs and S-containing impurities. A heavily S-contaminated CBFA sample (FA06) was loaded on the C18 column and eluted using a series of MeOH–water solutions, increasing from 0 to 100% MeOH in steps of 5%; fractions eluting between 75 to 85% MeOH were collected and pooled (FA06A). GC-FID and ESI-MS analyses indicated that FA06A contained 80–85% total FAs with ∼76% LA, ∼10% MA, and ∼5% PA. S and P concentrations were 75 ppm and 8 ppm, respectively.
Another portion of FA06 was loaded and eluted from the C18 column using a similar MeOH–water gradient, however, in steps of 2.5%. Fig. 1 illustrates the eluted mass, LA composition, and S content of individual fractions collected in the 72.5 to 85% MeOH range. More polar hydroxy FAs typically eluted before LA. The mass of eluted CFBAs reached a maximum at 75% MeOH and then decreased nearly linearly as the MeOH concentration was increased to 85%. LA concentration reached a maximum of ∼95% w/w (total mass) at 77.5% MeOH. S concentration was ∼300 ppm in the 72.5% MeOH fraction, decreased abruptly to <25 ppm, and then increased to ∼75 ppm in the 85% MeOH fraction, suggesting that there were multiple different S-containing impurities in the sample. Fractions eluted using 75% to 82.5% MeOH that contained >80% w/w LA and <25 ppm S and were pooled to produce FA06B. ESI-MS indicated that FA06B contained 91% total FAs with ∼97% LA; however, LA recovery (77%) was relatively low. GC-FID evidenced a similarly high FA content. (If the anomalous peak eluting immediately after C12:0 were taken to be LA (due to possible overloading of the capillary column), the GC-FID LA content would be equivalent to that measured by ESI-MS.) Sample FA06B also had a remarkably low S content: 12 ppm.
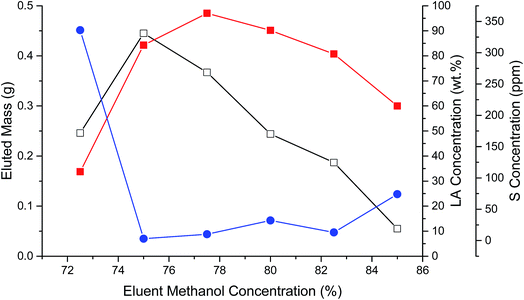 | ||
| Fig. 1 Eluted mass (open squares), LA concentration (closed squares), and S concentration (closed circles) during C18 chromatography of FA06B. | ||
Although preparative-scale C18 LC proved an effective strategy for removing β-hydroxy FAs and S-containing impurities from CBFA samples, it was time and resource intensive and gave relatively low yields. Consequently, simpler batch chemical processes were investigated, and alkaline hydrolysis was found to be effective at removing S-containing impurities. A single alkaline hydrolysis step performed on FA07 (a crude CBFA sample with a typical S content) resulted in a 64% reduction in S concentration with 98% LA recovery (FA07A). Consecutive alkaline hydrolysis steps resulted in a sample (FA07B) containing less than 10 ppm S (below the ICP-OES detection limit at ASU). GC-FID analysis indicated that FA07B contained ∼90% total FAs with a typical chain-length distribution; however, relatively high concentrations of BHLA and BHMA were detected by ESI-MS.
3.2 Semi-batch deoxygenation of model compounds
Catalytic deoxygenation of LA and MA in n-C12 at 300 °C and 15 bar over 5 wt% Pd/C has been reported previously. The on-line QMS results in Fig. 2 agree closely with previous observations.25 Deoxygenation of LA and MA produced high yields (>90%) of n-undecane (n-C11) and n-tridecane (n-C13), respectively, with ∼90% CO2 selectivity (Table 4). Net H2 consumption per mole of FA reactant was low, consistent with DCX as the dominant reaction pathway.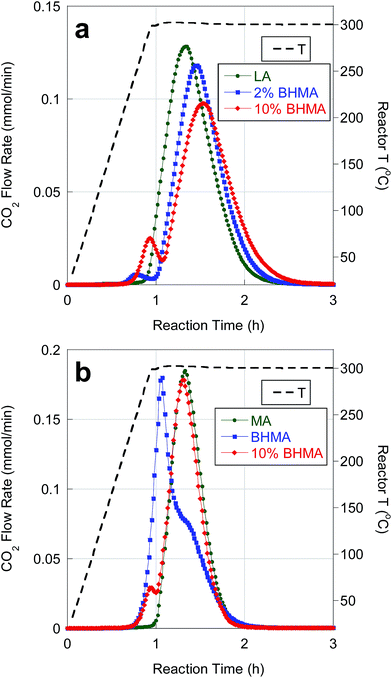 | ||
| Fig. 2 Temporal evolution of CO2 during catalytic deoxygenation of (a) LA and LA/BHMA mixtures and (b) MA, BHMA and a MA/BHMA mixture over 5 wt% Pd/C in flowing 5% H2 at 300 °C and 15 bar. | ||
| Reactantb | Mass (g) | CO + CO2 yield (%) | n-Alkane yield (%) | CO2 selectivity (%) | H2 generationf |
|---|---|---|---|---|---|
| a Typical reaction conditions: 0.335 g 5 wt% Pd/C, 22.5 g n-C12 solvent, 5% H2, Prxtr = 15 bar, Trxtr = 300 °C, 4 h reaction time. b 5.6 mmol reactant used, except 1.18 g 2-C13-ONE (5.9 mmol). c Average of two deoxygenation experiments. d Sum of n-C11 and n-C13 produced during deoxygenation. e 10% (w/w) of reactant BHMA, remainder LA or MA. f Net moles H2 generated per mole of reactant(s) charged. | |||||
| LAc | 1.13 | 96.5 | 91.7 | 88.5 | −0.13 |
| MA | 1.28 | 90.6 | 91.2 | 89.8 | −0.15 |
| BHMAc | 1.37 | 93.7 | 51.2d | 86.6 | 0.04 |
| BHMA/LAe | 1.14 | 83.9 | 86.4d | 91.0 | −0.09 |
| BHMA/MAe | 1.25 | 90.3 | 86.8d | 90.1 | −0.14 |
| 2-C13-OH | 1.14 | 7.1 | 14.8d | 18.3 | 0.65 |
| 2-C13-ONE | 1.18 | 6.3 | 11.5d | 16.3 | −0.22 |
BHMA was deoxygenated over 5 wt% Pd/C under equivalent reaction conditions. On-line QMS data evidence rapid evolution of CO2, CO and H2 at 300 °C (Fig. 3). Net generation of H2 is observed, contrary to the H2 consumption typically found during FA deoxygenation. Conversion of BHMA is complete after 3 h. As illustrated in Fig. 2b, initial deoxygenation of BHMA occurs very rapidly when compared to MA. A shoulder on the main CO2 evolution peak at ∼1.3 h reaction time suggests that MA may be an intermediate product. Post-reaction analysis of liquid products by GC-FID (Fig. S2, Table S1†) identified n-C13 and 2-C13-ONE as major deoxygenation products; n-C11 and 2-C13-OH were minor products. A long-retention-time (presumably, high molecular weight) unknown compound was also detected by GC-FID. We infer that the net generation of H2 results from dehydrogenation of 2-C13-OH to 2-C13-ONE. In separate experiments (Table S1†), 2-C13-ONE and 2-C13-OH were reacted under equivalent conditions. Neither 2-C13-ONE nor 2-C13-OH was deoxygenated to n-C13 in appreciable yield; therefore, the formation of these products (and the unknown species) explains the low n-alkane yield from BHMA deoxygenation (Table 4).
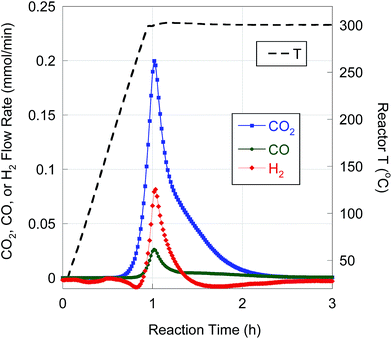 | ||
| Fig. 3 H2, CO, and CO2 evolution from BHMA semi-batch deoxygenation over 5 wt% Pd/C at 300 °C and 15 bar in flowing 5% H2. | ||
Proposed reaction pathways for BHMA, 2-C13-ONE, and 2-C13-OH over 5 wt% Pd/C are illustrated in Scheme 1. As shown, sequential HDO and DCX reactions yield n-C13; however, direct deoxygenation of BHMA to n-C13 (without MA as an intermediate) cannot be excluded. In parallel, direct DCX of BHMA produces 2-C13-OH that is rapidly dehydrogenated to 2-C13-ONE. Alternatively, BHMA may be dehydrogenated to β-ketomyristic acid before undergoing DCX to 2-C13-ONE.
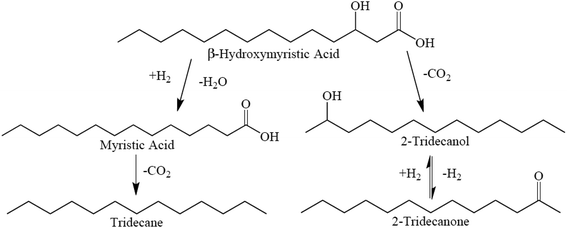 | ||
| Scheme 1 Suggested reaction network for BHMA deoxygenation over 5 wt% Pd/C at 300 °C and 15 bar in flowing 5% H2. | ||
Deoxygenation of BHMA-FA mixtures resulted in CO2 selectivities of ∼90%. As expected, n-alkane yields (∼86%) were lower than for FA deoxygenation (Table 4). Moreover, the presence of BHMA at 2 and 10 wt% (of total FAs) inhibited the kinetics of LA deoxygenation, as illustrated in Fig. 2a. Deoxygenation of BHMA results in a small CO2 evolution peak just prior to the main LA deoxygenation peak. BHMA addition causes a decrease in CO2 peak intensity (greater than the expected ∼10% decrease) and a delay in CO2 peak time. BHMA addition also leads to a corresponding delay and decrease in CO peak intensity. In contrast, BHMA addition (10 wt%) did not affect MA deoxygenation kinetics significantly, as evidenced in Fig. 2b. Slower kinetics for LA deoxygenation may be ascribed to competitive adsorption of BHMA.
3.3 Semi-batch deoxygenation of CBFAs
Table 5 provides semi-batch deoxygenation results for individual CBFA samples at approximately equivalent initial concentrations in n-C12. Temporal CO2 and CO evolution curves recorded during deoxygenation of FA05 are shown in Fig. 4. FA05 is typical of CBFA samples that exhibit slow deoxygenation kinetics and low CO2 selectivity associated with catalyst poisoning. After an initial spike in CO2 evolution, further deoxygenation occurs via DCN. The sharp drop in CO evolution observed upon cooling (after 4 h reaction time) indicates incomplete CBFA conversion consistent with the low n-alkane yield. Deoxygenation of FA04 occurred with much higher n-alkane yield and CO2 selectivity; however, evolution of CO2 and CO continued for the entire 4 h batch time indicating incomplete CBFA conversion. An initial spike in CO2 evolution and a broad secondary peak are observed consistent with sequential deoxygenation of β-hydroxy-FAs and FAs. The similar deoxygenation results for FA06A and FA04 reflect their equivalent sulfur concentrations (∼75 ppm). In contrast, deoxygenation of FA06B, which was eluted from the C18 column using a 75–82.5% MeOH gradient and contained only 12 ppm S, resulted in complete deoxygenation with high CO2 selectivity in ∼1.5 h. Moreover, the initial spike in CO2 evolution associated deoxygenation of β-hydroxy FAs is absent, and the n-alkane yield approaches that obtained with reagent-grade LA. The overall deoxygenation performance of FA07B, resulting from consecutive alkaline hydrolysis treatments, was comparable to that of FA06B; however, the CO2 evolution curve indicates that deoxygenation of FA07B occurred more slowly. The slower kinetics for FA07B can be attributed to inhibition by β-hydroxy FA impurities.| Sample | CBFA conc. (wt%) | CO + CO2 yieldc (%) | Alkane yieldc,d (%) | CO2 selectivity (%) | H2 generatione |
|---|---|---|---|---|---|
| a Reaction conditions: 0.335 g 5 wt% Pd/C, 22.5 g n-C12 solvent, 5% H2, P = 15 bar, T = 300 °C. b Deoxygenated for 8 h reaction time. All other sample deoxygenated for 4 h reaction time. c Calculated using an average FA distribution: 81% C12:0, 11% C14:0, 6% C16:0, and 2% C18:0. d Includes all C11 to C17n-alkane products, except n-C12 solvent. e Net moles H2 generated per mole of CO + CO2 produced. | |||||
| FA01b | 4.90 | 47.4 | 41.7 | 31.7 | −0.88 |
| FA02A | 4.75 | 53.6 | 52.1 | 47.2 | −0.46 |
| FA03 | 4.96 | 35.5 | 32.1 | 22.0 | −1.07 |
| FA03A | 4.53 | 53.6 | 52.8 | 71.2 | −0.32 |
| FA04 | 4.75 | 76.0 | 62.2 | 70.2 | −0.44 |
| FA05 | 4.74 | 53.6 | 34.4 | 16.1 | −0.64 |
| FA06A | 4.77 | 61.6 | 59.5 | 62.0 | −0.69 |
| FA06B | 4.63 | 81.7 | 88.3 | 88.0 | −0.23 |
| FA07B | 4.74 | 83.2 | 83.1 | 84.8 | −0.09 |
| FA08A | 4.79 | 66.2 | 70.0 | 78.7 | −0.19 |
| FA08B | 4.78 | 53.7 | 54.1 | 65.3 | −0.33 |
| FA09 | 4.75 | 51.8 | 55.4 | 57.7 | −0.47 |
| FA10 | 4.82 | 81.0 | 78.8 | 84.1 | −0.18 |
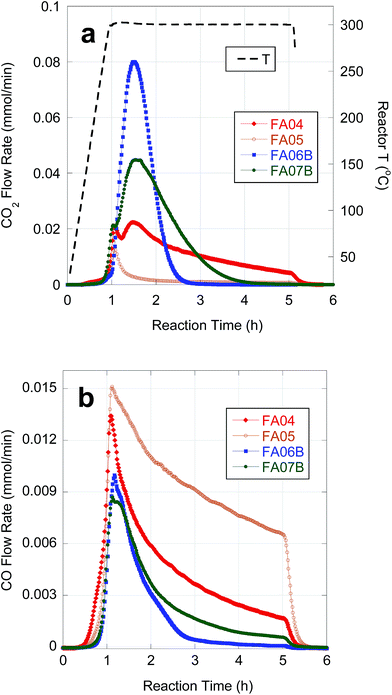 | ||
| Fig. 4 Temporal evolution of CO2 (a) and CO (b) during deoxygenation of FA04, FA05, FA06B and FA07B over 5 wt% Pd/C in flowing 5% H2 at 300 °C and 15 bar. | ||
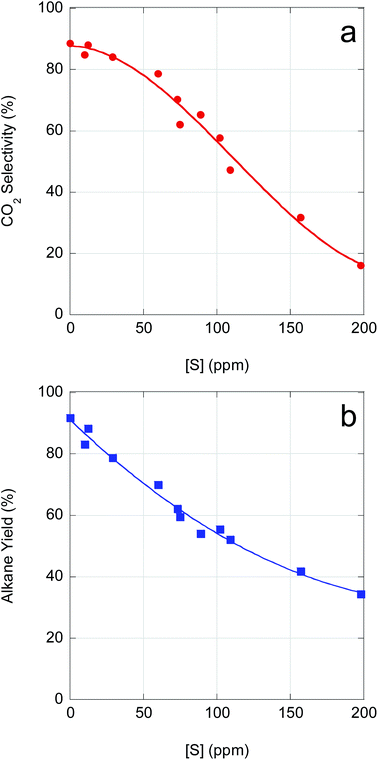
As demonstrated above, catalyst performance in CBFA deoxygenation is negatively impacted by feedstock impurities. Although β-hydroxy FAs inhibit FA deoxygenation, poisoning of the Pd/C catalyst by S-containing impurities is the dominant effect. As illustrated in Fig. 5, CO2 selectivity and n-alkane yield decline precipitously with increasing S concentration. An increase in S concentration from ∼0 ppm (reagent-grade LA) to ∼100 ppm reduces both CO2 selectivity and n-alkane yield by ∼33%. Moreover, for a S concentration of ∼150 ppm (typical of crude CBFA samples), CO2 selectivity drops to <40% and total alkane yield to <50%. Correlating the available ICP-OES data with the semi-batch CBFA deoxygenation results indicates that it is necessary to limit [S] to <15 ppm to obtain deoxygenation performance equivalent to LA over 5 wt% Pd/C.
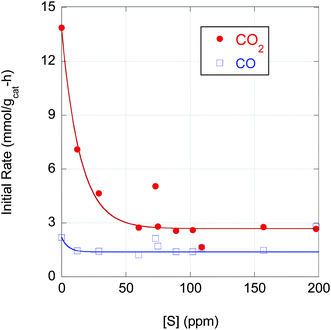
The strong correlation of n-alkane yield with CO2 selectivity suggests that S has a greater poisoning effect on Pd-catalyzed DCX than DCN. Indeed, as illustrated in Fig. 6, the initial DCX rate is more sensitive to S poisoning than the initial DCN rate. When [S] in the feedstock increases from ∼0 to 50 ppm, the initial CO2 evolution rate declines by almost a factor 5; the initial DCX rate is approximately constant for higher CBFA S concentrations (50 < [S] ≤ 200 ppm). In contrast, the initial CO evolution rate is relatively constant over the entire range of [S]. Previously, Immer and Lamb found that CO selectively (and reversibly) inhibits the DCX pathway in SA deoxygenation using 5 wt% Pd/C under similar conditions.14 The profound effect of S on the rates of Pd-catalyzed reactions can be traced to site blockage and electronic effects. For example, Miller et al. determined that dosing a Pd membrane with H2S created a surface Pd4S layer with each S atom blocking 4 surface Pd atoms.40 Density functional theory calculations showed that H2 dissociative chemisorption on Pd4S surface was always an endothermic process, rather than the exothermic dissociative H2 adsorption exhibited over clean Pd(111).
3.4 Conversion of CBFAs to SPK
Subsequent experiments focused on purification and deoxygenation of CBFAs on a larger scale (∼10 g) for SPK. These CBFA samples were purified using various combinations of the above methods to reduce S-containing impurities. FA08A and FA08B were purified by sequential AC treatment and preparative-scale C18 LC using 75% and 100% MeOH eluents, respectively. The residual S concentrations in FA08A and FA08B are lower than in FA04 and FA05, respectively, that were purified using C18 LC alone under equivalent conditions. As expected based on its lower [S], FA08A gave better semi-batch deoxygenation performance than FA08B (Table 5). FA09 was purified by alkaline hydrolysis followed by a series of 4 AC treatments. ESI-MS and ICP-OES indicated that FA09 contained ∼78% total FAs, ∼83% LA and 102 ppm S. FA10 was purified by sequential alkaline hydrolysis and AC treatment, each repeated 4 times. ESI-MS and ICP-OES indicated that FA10 contained ∼90% total FAs, ∼78% LA and 29 ppm S. Because of its lower [S], deoxygenation of FA10 resulted in markedly higher CO2 selectivity and n-alkane yield when compared to FA09 (Table 5).Semi-batch deoxygenation of ∼11 g of FA08A at 46.6 wt% in n-C12 was conducted using 1 g of 5 wt% Pd/C catalyst under typical reaction conditions. The temporal CO2 and CO evolution curves are shown in Fig. 7. At the higher initial concentration, deoxygenation occurred primarily via DCN despite the ∼3 times greater catalyst mass. Previous research demonstrated that higher initial FA concentrations in semi-batch FA deoxygenation result in lower DCX rates due to self-poisoning by CO.39 This first deoxygenation experiment (1st run) converted approximately half of the CBFAs (based on CO + CO2 yield). Conversion of unreacted CBFAs was achieved by repeating the experiment using 1 g of fresh catalyst (2nd run). This resulted in a fivefold increase in CO2 selectivity and produced a liquid n-alkane product that subsequently was subjected to HI.
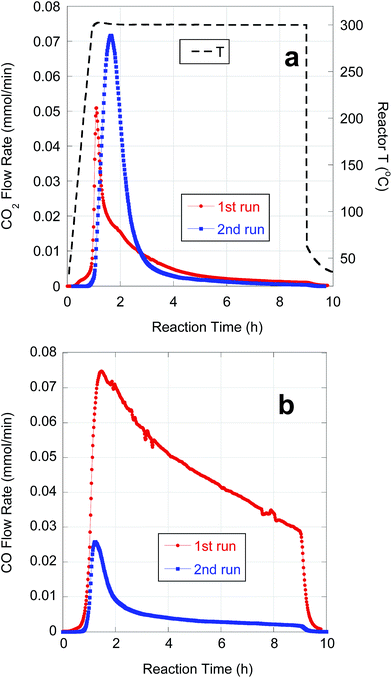 | ||
| Fig. 7 Temporal evolution of (a) CO2 and (b) CO from semi-batch deoxygenation of FA08A (11.0 g) over 5 wt% Pd/C (1 g) at 300 °C and 15 bar under flowing 5% H2. | ||
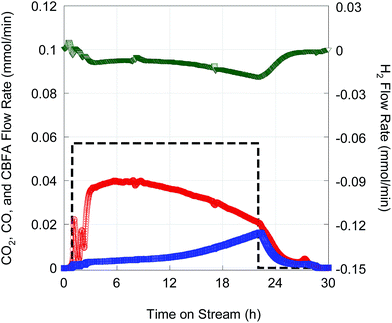
Deoxygenation of ∼14 g FA10 was conducted in fed-batch mode14 using 1 g of 5 wt% Pd/C catalyst at higher total pressure (23.4 bar) in flowing 2 vol% H2. The higher operating pressure was necessary to suppress evaporation of the n-C12 solvent and n-alkane products. Fig. 8 shows on-line QMS data recorded during this experiment. After an initial start-up transient, a quasi-steady state characterized by high CO2 selectivity was achieved after 6 h time on stream (TOS). Although there was a gradual decrease in CO2 selectivity with TOS, DCX remained the dominant reaction pathway until feeding was stopped after ∼22 h TOS. Overall CO2 selectivity and hydrocarbon yield were 81.6% and 73.5%, respectively. The hydrocarbon product comprised 99.2% n-alkanes.
Preliminary HI experiments on n-C11 and n-C11/n-C12 mixtures were conducted to determine the optimum reaction conditions and batch time to maximize isomer yield using a 0.70 wt% Pt/CaY catalyst. As shown in Table 6, HI of n-C11 over Pt/CaY at 300 °C for 180 min resulted in moderate conversion with high selectivity to C11 isomers (i-C11). HI of a 50% w/w n-C11/n-C12 mixture under equivalent conditions achieved a similar n-alkane conversion and HI selectivity demonstrating that n-C12 addition did not significantly affect the reaction kinetics. HI of n-alkanes resulting from semi-batch deoxygenation of FA08A in n-C12 resulted in ∼20% conversion with very high selectivity to isomerized products. The HI product (Fig. S3†) was a clear colorless liquid at room temperature. The low yield of C11 isomers resulted from the low initial n-C11 concentration and lower than expected conversion. HI of FA10 deoxygenation products in n-C12 resulted in higher conversion and i-C11 product yield (Table 6). The i/n-alkane ratios of the FA08A and FA10 HI products were 0.23 and 0.51, respectively. For comparison, Jet-A and JP-8 have i/n-alkane ratios of 1.72 and 1.33, respectively. Although the CBFA-derived product mixtures are not directly comparable to petroleum-derived aviation fuels by this metric, these experiments provide proof of concept that CBFA-derived n-alkanes can be hydroisomerized over Pt/CaY to produce biorenewable SPK.
| Sample | n-C11 | n-C11/n-C12 | FA08A n-alkanesb | FA10 n-alkanesc |
|---|---|---|---|---|
| a Batch reaction using 0.350 g 0.7 wt% Pt/CaY at 300 °C and 500 psig H2 (initial pressure at 25 °C). b FA08A semi-batch deoxygenation product (25.8 g). c FA10 fed-batch deoxygenation product (14 g) + n-C12 (11 g). d Mass recovery in liquid products >98%. | ||||
| P f (psig) | 490 | 450 | 490 | 450 |
| Reaction time (min) | 180 | 176 | 109 | 180 |
| Conversion (%) | 58.9 | 60.2 | 19.6 | 35.8 |
| HI selectivity (%) | 92.7 | 90.1 | 94.9 | 91.9 |
| Liquid product composition (wt%)d | ||||
| C4–C10 | 4.3 | 6.0 | 1.1 | 2.9 |
| i-C11 | 54.6![[thin space (1/6-em)]](https://www.rsc.org/images/entities/char_2009.gif) |
26.7 | 2.7 | 7.7 |
| n-C11 | 41.1 | 20.3 | 12.7 | 18.2 |
| i-C12 | — | 27.6 | 15.1 | 24.1 |
| n-C12 | — | 19.4 | 65.6 | 44.5 |
| i-C13 | — | — | 0.2 | 0.4 |
| n-C13 | — | — | 1.1 | 0.7 |
| i-C15 | — | — | 0.2 | 0.5 |
| n-C15 | — | — | 0.4 | 0.4 |
| i-C17 | — | — | 0.4 | 0.3 |
| n-C17 | — | — | 0.5 | 0.3 |
4. Conclusions
Conversion of CBFAs to primarily C11 linear and branched alkanes via deoxygenation and hydroisomerization using Pd/C and Pt/CaY catalysts, respectively, was demonstrated. BHMA was shown to inhibit LA deoxygenation. BHMA deoxygenation over Pd/C occurred primarily via DCX producing n-C13 and 2-C13-ONE as major products. Much stronger inhibition of CBFA deoxygenation was attributed to sulfur poisoning of Pd sites responsible for DCX. Typical S concentrations (100–150 ppm) in crude CBFAs made deoxygenation over Pd/C catalysts very challenging. Preparative-scale C18 LC and alkaline hydrolysis with AC pretreatment were effective at removing S-containing impurities from the CBFA feedstock. Reducing S concentration to <15 ppm allowed CBFA deoxygenation over Pd/C with >80% n-alkane yield and ∼90% CO2 selectivity. The resultant n-alkanes were hydroisomerized over a 0.70 wt% Pt/CaY to a mixture of linear and branched alkanes compatible with SPK.Conflicts of interest
There are no conflicts of interest to declare.Acknowledgements
This research was funded by ARPA-E (U.S. Dept. of Energy) under grant number DE-AR0000011. FA analysis was provided by Dr Lisa Dean of the NCSU Food Science Department. ICP-OES analysis of Pt/CaY was conducted by Kim Hutchison in the NCSU Soil Science Department. ESI-MS analysis was conducted by Dr Daniel Brune in the ASU School of Life Sciences. Dr Keyi Sun assisted with catalyst preparation and characterization.References
- C. Le Quere, M. R. Raupach, J. G. Canadell, G. Marland, L. Bopp, P. Ciais, T. J. Conway, S. C. Doney, R. A. Feely, P. Foster, P. Friedlingstein, K. Gurney, R. A. Houghton, J. I. House, C. Huntingford, P. E. Levy, M. R. Lomas, J. Majkut, N. Metzl, J. P. Ometto, G. P. Peters, I. C. Prentice, J. T. Randerson, S. W. Running, J. L. Sarmiento, U. Schuster, S. Sitch, T. Takahashi, N. Viovy, G. R. van der Werf and F. I. Woodward, Nat. Geosci., 2009, 2, 831–836 CrossRef CAS.
- B. Smith, H. C. Greenwell and A. Whiting, Energy Environ. Sci., 2009, 2, 262–271 CAS.
- P. S. Nigam and A. Singh, Prog. Energy Combust. Sci., 2011, 37, 52–68 CrossRef CAS.
- G. Hochman; D. Rajagopal; G. Timilsina and D. Zilberman, The Role of Inventory Adjustments in Quantifying Factors Causing Food Price Inflation, Policy Research Working Paper 5744, The World Bank, 2011 Search PubMed.
- L. Brennan and P. Owende, Renewable Sustainable Energy Rev., 2010, 14, 557–577 CrossRef CAS.
- H. J. Robota, J. C. Alger and L. Shafer, Energy Fuels, 2013, 27, 985–996 CrossRef CAS.
- A. K. Sallal, N. A. Nimer and S. S. Radwan, J. Gen. Microbiol., 1990, 136, 2043–2048 CrossRef CAS.
- H. Wada and N. Murata, Plant Physiol., 1990, 92, 1062–1069 CrossRef CAS PubMed.
- M. V. Merritt, S. P. Rosenstein, C. Loh, R. H. S. Chou and M. M. Allen, Arch. Microbiol., 1991, 155, 107–113 CrossRef CAS.
- W. Vermaas, S. Cheney, R. Krajmalnik-Brown, H. Lamb, D. Nielsen, B. Rittmann, R. Roberson, W. Roberts and D. Thompson, J. Phycol., 2011, 47, S6 Search PubMed.
- J. W. K. Oliver and S. Atsumi, Photosynth. Res., 2014, 120, 249–261 CrossRef CAS PubMed.
- X. Liu, J. Sheng and R. Curtiss III, Proc. Natl. Acad. Sci. U. S. A., 2011, 108, 6899–6904 CrossRef CAS PubMed.
- J. A. Petri and T. L. Marker, Production of Diesel Fuel from Biorenewable Feedstocks, U.S. Pat. 7,511,181, March 31 2009.
- J. G. Immer and H. H. Lamb, Energy Fuels, 2010, 24, 5291–5299 CrossRef CAS.
- J. G. Immer, M. J. Kelly and H. H. Lamb, Appl. Catal., A, 2010, 375, 134–139 CrossRef CAS.
- P. Mäki-Arvela, I. Kubičková, M. Snåre, K. Eränen and D. Y. Murzin, Energy Fuels, 2007, 21, 30–41 CrossRef.
- J. G. Immer, Liquid-Phase Deoxygenation of Free Fatty Acids to Hydrocarbons Using Supported Palladium Catalysts, Ph.D. thesis, North Carolina State University, 2010.
- W. C. Wang, W. L. Roberts and L. F. Stikeleather, J. Energy Resour. Technol., 2012, 134, 032203 CrossRef.
- M. Snåre, I. Kubičková, P. Mäki-Arvela, D. Chichova, K. Eränen and D. Y. Murzin, Fuel, 2008, 87, 933–945 CrossRef.
- T. Morgan, D. Grubb, E. Santillan-Jimenez and M. Crocker, Top. Catal., 2010, 53, 820–829 CrossRef CAS.
- L. Boda, O. Gyorgy, H. Solt, L. Ferenc, J. Valyon and A. Thernesz, Appl. Catal., A, 2010, 374, 158–169 CrossRef CAS.
- J. Fu, X. Y. Lu and P. E. Savage, ChemSusChem, 2011, 4, 481–486 CrossRef CAS PubMed.
- M. Snåre, I. Kubičková, P. Mäki-Arvela, K. Eränen and D. Y. Murzin, Ind. Eng. Chem. Res., 2006, 45, 5708–5715 CrossRef.
- A. S. Berenblyum, R. S. Shamsiev, T. A. Podoplelova and V. Y. Danyushevsky, Russ. J. Phys. Chem. A, 2012, 86, 1199–1203 CrossRef CAS.
- J. P. Ford, J. G. Immer and H. H. Lamb, Top. Catal., 2012, 55, 175–184 CrossRef CAS.
- T. F. Rahmes; J. D. Kinder; T. M. Henry; G. Crenfeldt; G. F. LeDuc; G. P. Zombanakis; Y. Abe; D. M. Lambert; C. Lewis; J. A. Juenger; M. G. Andac; K. R. Reilly; J. R. Holmgren; M. J. McCall and A. G. Bozzano, Sustainable Bio-derived Synthetic Paraffinic Kerosene (Bio-SPK) Jet Fuel Flight Tests and Engine Program Results, in. Proceedings of the 9th AIAA Aviation Technology, Integration, and Operations Conference, American Institute of Aeronautics and Astronautics, Reston, VA, Hilton Head, SC, 2009, pp. 21–23 Search PubMed.
- Thermochemical Conversion of Biomass to Liquid Fuels and Chemicals, ed. M. Crocker, Royal Society of Chemistry, Cambridge, U. K., 2010, p. 532 Search PubMed.
- Commission on Life Sciences and Division on Earth and Life Studies, Permissible Exposure Levels for Selected Military Fuel Vapors, National Academies Press, Washington, DC, 1996, pp. 15–16, http://www.nap.edu/read/9133/chapter/4#14, accessed July 18, 2016 Search PubMed.
- Aviation Fuels Technical Review, Technical Report for Chevron Products Company, San Ramon, CA, 2007 Search PubMed.
- F. L. Dryer, S. Jahangirian, S. Dooley, S. H. Won, J. Heyne, V. R. Iyer, T. A. Litzinger and R. J. Santoro, Energy Fuels, 2014, 28, 3474–3485 CrossRef CAS.
- J. H. Weitkamp, Ind. Eng. Chem. Prod. Res. Dev., 1982, 21, 550–558 CrossRef CAS.
- H. F. Schulz and J. H. Weitkamp, Ind. Eng. Chem. Prod. Res. Dev., 1972, 11, 46–53 CAS.
- B. Szponar, L. Krasnik, T. Hryniewiecki, A. Gamian and L. Larsson, Clin. Chem., 2003, 49, 1149–1153 CAS.
- M. Asayama, Appl. Microbiol. Biotechnol., 2012, 95, 683–695 CrossRef CAS PubMed.
- W. Yuan, M. Wiehn, Y. C. Wang, H. W. Kim, B. E. Rittmann and D. R. Nielsen, Sep. Purif. Technol., 2013, 106, 1–7 CrossRef CAS.
- C. D. Bannon, J. D. Craske, N. T. Hai, N. L. Harper and K. L. Orourke, J. Chromatogr., 1982, 247, 63–69 CrossRef CAS.
- W. A. Dietz, J. Chromatogr. Sci., 1967, 5, 68–71 CrossRef CAS.
- H. Y. Tong and F. W. Karasek, Anal. Chem., 1984, 56, 2124–2128 CrossRef CAS.
- J. P. Ford, N. Thapaliya, M. J. Kelly, W. L. Roberts and H. H. Lamb, Energy Fuels, 2013, 27, 7489–7496 CrossRef CAS.
- J. B. Miller, D. R. Alfonso, B. H. Howard, C. P. O'Brien and B. D. Morreale, J. Phys. Chem. C, 2009, 113, 18800–18806 CAS.
Footnote |
| † Electronic supplementary information (ESI) available: S1: catalyst characterization. Table S1: product moles of BHMA, 2-C13-OH, and 2-C13-ONE deoxygenation over 5 wt% Pd/C at 300 °C and 15 bar under 5 vol% H2. Fig. S1: photo of crude CBFA sample (FA03). Fig. S2: chromatograms of standards and BHMA deoxygenation product with species identification: (a) 2-C13-ONE, (b) 2-C13-OH and (c) BHMA reactor contents. Fig. S3: photo of vial containing SPK product from FA08A. See DOI: 10.1039/c7se00558j |
| This journal is © The Royal Society of Chemistry 2018 |

