Pillaring and NiOx co-catalyst loading as alternatives for the photoactivity enhancement of K2Ti4O9 towards water splitting†
Mauricio A.
Melo
Jr
a,
Saulo A.
Carminati
a,
Jefferson
Bettini
b and
Ana F.
Nogueira
 *a
*a
aInstitute of Chemistry, University of Campinas, UNICAMP, P. O. Box 6154, 13084-971 Campinas, São Paulo, Brazil. E-mail: anaflavia@iqm.unicamp.br
bNational Nanotechnology Laboratory, National Center for Energy and Materials Research, CNPEM, 13083-970, Campinas, São Paulo, Brazil
First published on 10th January 2018
Abstract
Structural improvements of efficient and abundant photocatalysts and the employment of less expensive co-catalysts are appealing routes to promote the development of economically viable solar fuel production. We herein report a significant enhancement of the H2 production from photocatalytic water splitting over K2Ti4O9 after pillaring with TiO2 pillars and loading of NiOx as a co-catalyst. The pillaring favored the charge carrier separation within the photocatalyst framework under illumination, whereas the NiOx co-catalyst, composed of nickel metal nanoparticles and nanostructured NiO, intensified the electron–hole separation at the surface. These are unprecedented results indicated by surface photovoltage spectroscopy, which was applied for the first time in this kind of photocatalyst composite. All modifications enhanced the H2 evolution from 14.9 μmol, for the pristine K2Ti4O9, to 982.0 μmol, for the final product, after 7 h of irradiation tests using methanol as a hole scavenger. This boost was also favored by the mesoporosity and high surface area created by the pillaring process. Moreover, NiOx as the co-catalyst proved to be as effective as platinum and more effective than Ag and Au in this particular system.
Introduction
Finding efficient and inexpensive photocatalysts that can drive the photocatalytic production of hydrogen from water splitting is still a challenge to the scientific community. The growing interest in this subject comes from the fact that H2 obtained from sunlight and water is a potential substitute for the vast use of non-renewable and greenhouse-gas-emitting fossil fuels.1–5 However, the viability of such a trade is hindered by the limited efficiency of the known photocatalysts and the high costs of their constituents.In the pursuit of high efficiencies, the literature describes well-known water splitting photocatalysts, such as TiO2, SrTiO3, K2Ti4O9, K4Nb6O17, and ZnO, modified by the noble metals rhodium, platinum, silver, and gold, among others, to increase the light absorption and electrical conductivity, and/or intensify the separation of the photogenerated charge carriers.6–12 These procedures, usually substitutional doping or nanoparticle loadings, lead to remarkable improvements in the photoactivity of the pristine semiconductors.6,13,14 However, noble metals are very expensive and most of the time these modifications are accompanied by costly procedures, further increasing the overall cost of the final product. Therefore, alternative non-expensive classes of co-catalysts with efficiencies comparable to those of noble metals are required to make the photocatalytic H2 production economically attractive.
Nickel-based co-catalysts have been studied by different research groups, showing satisfactory results in the increment of the activity of the respective photocatalysts.15–22 A thorough study regarding the function of the NiOx (0 < x < 1) co-catalyst on SrTiO3 was reported by Osterloh and co-workers in 2012.23 The authors pointed out a striking feature of this component, which is rather a dual co-catalyst with nickel metal nanoparticles and nickel oxide nanoparticles having complementary roles to promote the proper electron–hole separation and consequent enhancement in the yield of the photocatalytic water splitting.
In light of this evidence, we consider that the employment of NiOx is a good approach to the replacement of expensive noble metal co-catalysts in photocatalytic systems because nickel is cheaper and more abundant.
The photoactivity of a semiconductor also depends on its intrinsic structural properties, such as surface area, porosity, crystallinity, and structural defects. In general, periodic porous structures with high surface area tend to act as effective matrices for catalysis because the open-access framework exposes the active sites more efficiently and enables the diffusion of the reactants.24–28
Although some layered solids like potassium tetratitanate (K2Ti4O9) and potassium niobate (K4Nb6O17) are stable and photoactive towards water splitting, their efficiencies are hindered by fast electron–hole recombination and low charge carrier diffusion lengths.10,29 Nonetheless, most layered solids are structurally versatile due to their expansible interlayer region, which permits intercalation of guest species, leading to structural and compositional modifications that might completely alter their properties and applicability.30–33
Intercalation is the first stage of the pillaring process, which is an effective and well-known strategy to obtain high-surface-area porous materials from layered structures.31,34 This method has already been proven to be efficient for the enhancement of the photocatalytic activities of layered niobates, titanates,24,34–37 and even graphene oxide and reduced graphene oxide, pillared with carbon nanotubes.38
In 2002, Choy and colleagues created means for the consistent pillaring of layered titanates in spite of the high charge that maintains the interlayer attraction.34 They obtained a periodical mesoporous structure by intercalating tetrabutylammonium hydroxide (TBAOH) within the layers of the acidic form of the titanate, followed by exfoliation under ultrasonication. The layers were then restacked after substituting TBAOH with TiO2 nanosol coordinated by acetylacetone.
Integrating structural modifications of an active well-known photocatalyst with the incorporation of effective and cheap co-catalysts is an appealing route towards the development of economically viable H2 production systems. This is a goal that will only be achieved if the solar-to-hydrogen efficiency of the processes increases in the same degree as the costs drop.1,4
This work takes a step forward and presents for the first time the study of hydrogen evolution over the semiconductor K2Ti4O9 pillared with TiO2 (through an effective and non-expensive procedure) loaded with NiOx co-catalysts (which are cheap and abundant), through photocatalytic water splitting.
We also carried out a detailed investigation of the surface photovoltage created under illumination in this class of composites by surface photovoltage spectroscopy. The results unveil the implications that the modifications in K2Ti4O9 bring to the charge carrier separation and recombination and how these modifications affect the hydrogen evolution yields.
Results and discussion
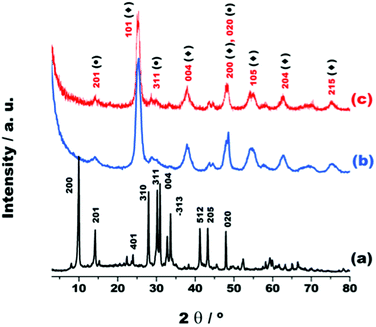
A new photocatalyst was obtained through the pillaring of K2Ti4O9 with TiO2 nanopillars and the loading of Ni0 and NiO nanoparticles on the surface (NiOx/TiO2/Ti4O9). As one of the goals of this work is the investigation of the effects caused by these modifications over H2 production, results of the intermediate material loaded solely with NiO (NiO/TiO2/Ti4O9) are presented, as well. Other photocatalysts were prepared by substituting NiOx with Ag, Au and Pt nanoparticles to compare the activity of this nickel-based co-catalyst with those of noble metals.The X-ray diffraction (XRD) patterns of the materials, K2Ti4O9, the pillared version (TiO2/Ti4O9) and NiOx/TiO2/Ti4O9, displayed in Fig. 1, reflect the modification of the structure of K2Ti4O9, into TiO2/Ti4O9 after the pillaring with TiO2.24
The XRD pattern indicates that the layered K2Ti4O9 is a well-ordered monoclinic structure, pertaining to the space group C2/m (JCPDS 32-0861), with the distance between the adjacent Ti4O92− layers corresponding to 0.87 nm, based on the (200) reflection at 2θ = 10.1°.29
The (200) reflection is attributed to the basal distance of pure K2Ti4O9 and the absence of this reflection at 2θ values close to 10.0° in the pattern of TiO2/Ti4O9 is a relevant indication of the structural alteration after the pillaring. This is a consequence of the insertion of TiO2 nanopillars within the layers of K2Ti4O9. The pillaring process causes a certain disturbance in the structure due to the impaired coherence between the lamellae caused by their random restacking during the reassembling for the formation of the porous structure.31,32,34
The patterns of TiO2/Ti4O9 and NOx/TiO2/Ti4O9 show the planes (201), (311) and (020) pertaining to the in-sheet structure of the Ti4O92− nanolayers, indicating that the original structure of the sheets was conserved. The XRD patterns also confirm the incorporation of TiO2 nanoparticles by exhibiting broad diffraction peaks at 25.3, 38.1, 48.0, 54.6, 62.8 and 75.5° assigned to (101), (004), (200), (105), (204) and (215) reflections of the TiO2 anatase structure of the space group I41/amd (JCPDS 83-2243).24,34,37
The pattern of the mesoporous solid NiOx/TiO2/Ti4O9 (Fig. 1c) does not display any extra peaks related to either NiO or Ni because of the low amount of these co-catalysts (2 wt%) and high dispersion on the surface. Moreover, this pattern leads to favourable evidence that no structural modification took place in the porous material during the in situ synthesis of NiO under the thermal treatment at 400 °C.18 The same is true for the patterns of the mesoporous structures loaded with 2 wt% of Ag, Au and Pt, shown in Fig. S1.†
The N2 adsorption–desorption isotherms and pore size distribution curves of the materials K2Ti4O9, TiO2/Ti4O9 and NiOx/TiO2/Ti4O9 (Fig. 2) depict the large enhancement of surface area of the photocatalyst after pillaring, with concomitant formation of porous structures with pores in the mesoporous range.
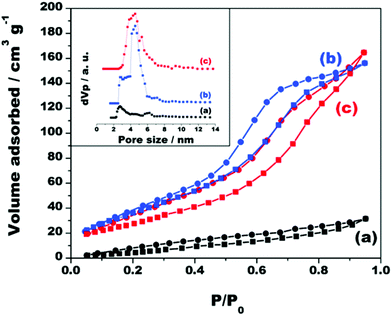 | ||
| Fig. 2 Adsorption–desorption isotherms and corresponding pore size distribution curves of (a) K2Ti4O9, (b) TiO2/Ti4O9 and (c) NiOx/TiO2/Ti4O9. | ||
Both the surface area and total pore volume of K2Ti4O9 considerably increased from 25 to 145 m2 g−1 and from 0.049 to 0.25 cm3 g−1, respectively, after pillaring with TiO2. The high surface area of the pillared solid is predominantly due to the presence of well-distributed TiO2 nanoparticles in the interlayer region and not to the formation of TiO2 nanoparticles on the outer surface of the material.34 This statement is supported by the BET specific surface area of TiO2 anatase, formed through the same procedure without the addition of Ti4O92− nanosheets, which was 41 m2 g−1.
The isotherm of the pristine K2Ti4O9 is a type III isotherm, attributed to non-porous solids. This isotherm shows a hysteresis in the desorption branch that may be related to the random aggregation of adjacent layers forming a “house-of-cards” configuration.32,34
The porosity completely changed after the pillaring, as the isotherm of TiO2/Ti4O9 is of type IV attributed to a mesoporous structure with a H1 hysteresis loop, characteristic of well-formed and periodically arranged mesopores.27 This proves that the complexed TiO2 nanosols could access the interlayer regions of the tetratitanate layers and form nanopillars homogeneously dispersed within the entire structure.
Similar characteristics are observed in the isotherm of NiOx/TiO2/Ti4O9 although the hysteresis slightly deviates from the H1 type due to the disturbance of the pore structure by the formation of NiO and Ni nanoparticles inside and in the entrance of the pores. This also led to a small reduction of the specific surface area to 134 m2 g−1. Interestingly, the variation in the specific surface area values was less pronounced for the materials loaded with Ag, Au and Pt (isotherms exhibited in Fig. S2†), which have specific surface areas of 153, 140 and 148 m2 g−1, respectively, probably due to the extra porosity that the incorporation of these nanoparticles generates on the surface, as indicated by the increase in the N2 adsorption at very high P/P0 values.24,37
Nonetheless, despite the slight disturbance in the pore structure, none of the isotherms indicate loss of the mesoporosity feature after the loading of the co-catalysts, which still show high surface area values. In addition, the total pore volume remains practically the same (0.25 cm3 g−1) in all cases.
Fig. 2 also displays an inset with the non-local density functional theory (NLDFT) pore size distribution curves of the materials K2Ti4O9, TiO2/Ti4O9 and NiOx/TiO2/Ti4O9. The curves show that no relevant porosity was identified for the layered precursor K2Ti4O9, especially in the mesoporous range, whereas TiO2/Ti4O9 and NiOx/TiO2/Ti4O9 have pore diameters between 2 and 6 nm, confirming that the built pores are in the mesoscale. The pore distribution is broad because of the combination of the pores created by the pillaring and the “house-of-card” disordered restacking of the exfoliated nanosheets.24,34,37 The same characteristics are observed in the pore size distribution curves for the materials loaded with Ag, Au and Pt, exhibited in Fig. S2d.†
The pores in the mesoscale in a high-surface-area structure are beneficial to promote the efficient diffusion of reactants within the structure, easing the access to the photoactive sites.25,27,28
Transmission electron microscopy (TEM) images (Fig. 3a and b) show that the structure of the layered precursor K2Ti4O9 is composed of stacked rectangular sheets. The width of these layers varies from 50 to 150 nm and the length ranges from 300 nm to 1 μm.29 Adjacent layers are parallel to each other with a distance of 0.9 nm, as evidenced by Fig. 3b, in good agreement with the XRD results.
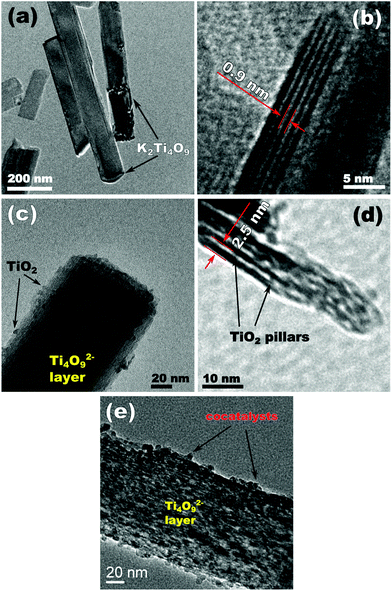 | ||
| Fig. 3 Transmission electron microscopy (TEM) images of (a, b) K2Ti4O9, (c, d) TiO2/Ti4O9 and (e) NiOx/TiO2/Ti4O9. | ||
The pillaring incorporated a new component into the structure, as a closer view of TiO2/Ti4O9 reveals the presence of some TiO2 nanoparticles distributed onto the Ti4O92− layers (Fig. 3c). High-resolution TEM (HR-TEM) images of the samples K2Ti4O9 and TiO2/Ti4O9 (Fig. S3†) reveal the differences in the surfaces of both materials. The distance between the planes of the formed nanoparticles is 0.35 nm, in good correspondence with the (010) planes of TiO2 anatase.
Fig. 3d shows that the nanosheets in TiO2/Ti4O9 are connected by TiO2 pillars located in the interlamellar region and the distance between the layers increased to 2.5 nm due to the insertion of these nanoparticles. This image proves the effective pillaring of K2Ti4O9 through the adopted procedure.34
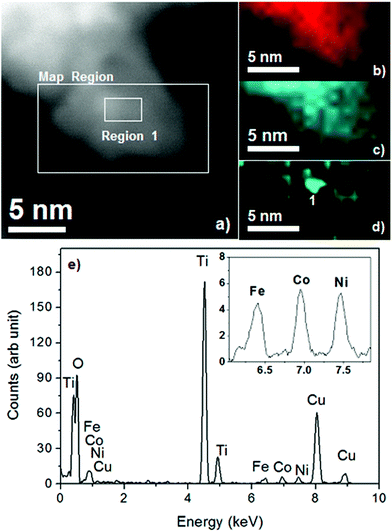
The TEM image of NiOx/TiO2/Ti4O9 (Fig. 3e) exhibits the same characteristic as that of TiO2/Ti4O9 with higher concentration of nanoparticles surrounding the Ti4O92− layers due to the addition of NiO and metallic nickel nanoparticles. The proper identification of the surrounding nanoparticles was achieved by EDS mapping, which provided a distinction between the particles of TiO2 and those composed of nickel (Fig. 4).
In general, the EDS mapping of NiOx/TiO2/Ti4O9 proves that the surface is composed of the elements titanium and oxygen, with nanoparticles of NiOx with dimensions from 1.5 to 2.5 nm homogeneously distributed in random parts of the surface. The EDS spectrum (Fig. 4e) confirms the detection of the elements Ti, O and Ni, together with peaks of Cu, Fe and Co, which are the elements present in the grid holder composition (TEM image and EDS spectrum of the grid are presented in Fig. S4†). This proposition is further proven by the mapping of another region of the NiOx/TiO2/Ti4O9 surface, exhibited in Fig. S5.† This image contains three EDS spectra corresponding to different sections of the mapped region (nickel-rich and nickel-poor sections), confirming the presence of titanium and oxygen all over the surface and random distribution of Ni-containing nanoparticles.
The surface composition and electronic states of nickel, titanium and oxygen on the surface of the solids NiO/TiO2/Ti4O9 and NiOx/TiO2/Ti4O9 were investigated by X-ray photoelectron spectroscopy (XPS). The XPS spectra at the Ti 2p, O 1s and Ni 2p regions for these materials are displayed in Fig. 5.
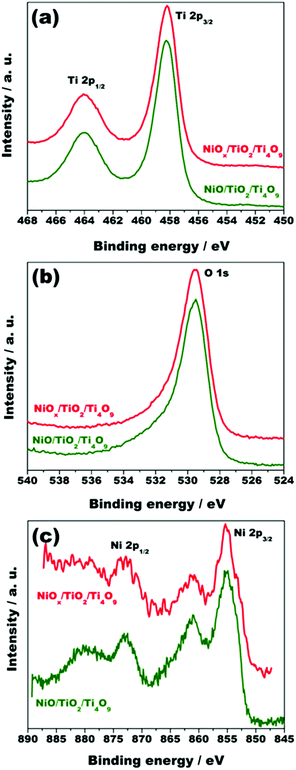 | ||
| Fig. 5 X-ray photoelectron spectra at the (a) Ti 2p, (b) O 1s and (c) Ni 2p regions for the materials NiO/TiO2/Ti4O9 and NiOx/TiO2/Ti4O9. | ||
The spectra at the Ti 2p region display two signals at 458.3 and 464.0 eV related to the Ti 2p3/2 and Ti 2p1/2 binding energies, respectively, with the spin–orbit splitting of 5.7, which indicates that titanium is in the Ti4+ oxidation state.24 In addition, the O 1s component attributed to the Ti–O bond type is observed at 529.5 eV in both cases.16,24
The Ni 2p spectra of NiO/TiO2/Ti4O9 and NiOx/TiO2/Ti4O9 (Fig. 5c) show two peaks attributed to the Ni 2p1/2 (873.1 eV) and Ni 2p3/2 (855.2 eV) spin–orbit levels, characteristic of Ni2+. Two shake-up satellite signals at 880.1 and 861.1 eV, which result from the charge transfer from O 2p to Ni 3d band in NiO, are also observable, confirming that nickel is in the +2 oxidation state. Moreover, the energy separation between Ni 2p3/2 and Ni 2p1/2 signals is 17.6 eV, which agrees with the value for NiO crystals.15,16,39 A peak related to the Ni 2p3/2 level of metallic nickel was expected to appear at a binding energy of 852.6 eV in the Ni 2p spectrum of NiOx/TiO2/Ti4O9. However, only a small shoulder at this region, which is not present in the spectrum of NiO/TiO2/Ti4O9, could be observed due to the unavoidable oxidation of the Ni0 nanoparticles to Ni2+ upon exposure to air.40,41
The incorporation of both TiO2 nanopillars and NiOx co-catalyst not only resulted in structural changes, but also optical alterations, as depicted by the ultraviolet-visible diffuse reflectance spectra (UV/Vis DRS) of the materials (Fig. 6).
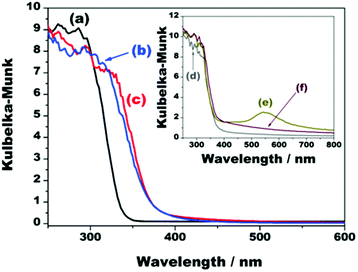 | ||
| Fig. 6 Ultraviolet-visible diffuse reflectance spectra of (a) K2Ti4O9, (b) TiO2/Ti4O9, (c) NiOx/TiO2/Ti4O9, (d) Ag/TiO2/Ti4O9, (e) Au/TiO2/Ti4O9, and (f) Pt/TiO2/Ti4O9. | ||
Pristine K2Ti4O9 has intense absorbance in the ultraviolet region, with onset at 337 nm, credited to the intrinsic band gap energy of 3.40 eV, as previously reported.29,34 The pillaring of this layered precursor led to a red shift in the onset to 375 nm and a colour change from white to pale yellow. This shift is a consequence of the combination of the layered protonic titanate with anatase TiO2 nanosol. This is confirmed by the UV/Vis spectrum of the pure TiO2 anatase synthesized in this work, which presents an onset exactly at 375 nm (Fig. S6†).35
Despite the darkening of the composite after the incorporation of metallic nickel and NiO nanoparticles onto the surface of TiO2/Ti4O9, the UV/Vis DRS spectrum of NiOx/TiO2/Ti4O9 (Fig. 6c) does not show any relevant increase in the light absorbance, which is mostly due to the high band gap of NiO (3.5 eV) and the low Ni-containing particle content in the sample (2 wt%).23,42
An extra absorption of light in the visible region occurs for the materials loaded with the noble metals Ag, Au, and Pt because of the resonance of the incident photons with the localized surface plasmons of these nanoparticles (Fig. 6d–f). This effect is most visible in the case of Au/TiO2/Ti4O9 because the surface plasmon resonance absorption band of gold nanoparticles is centred at 550 nm. The spectrum of Pt/TiO2/Ti4O9, presents additional light absorption from 375 to 800 nm,6,13,43,44 whereas the surface plasmon resonance band of silver nanoparticles is not observed because it lies in the region of 390 nm and overlaps with the absorption band of TiO2/Ti4O9.45
Surface photovoltage spectroscopy (SPS) is a reliable and precise technique to assess the photochemical charge carrier dynamics within the components of the nanocomposites and to obtain additional information about the photochemistry of the semiconductors. The information provided by SPS, such as the photovoltage produced by thin films of semiconductors and their effective band gap values, are of paramount importance to the understanding of the variation of H2 production through water splitting by the different photocatalysts.46–48 In this method, a contactless semi-transparent Kelvin probe is employed to measure the light-induced changes of the contact potential difference (CPD) of a sample as a function of the irradiation energy.48
Compared to photoelectrochemistry, SPS is much more sensitive for the determination of photochemical parameters of a semiconductor, as even small potential difference values on the millivolt scale, produced by the transfer of small charge carrier densities, can be detected. Moreover, it is contactless and free of any interaction with an electrolyte that might affect the determination of the intrinsic photochemical parameters. These features allow the direct determination of the majority carrier type, mid-gap states, effective band gap and light-induced contact photovoltage difference (CPD) of any photocatalyst.47,49–51
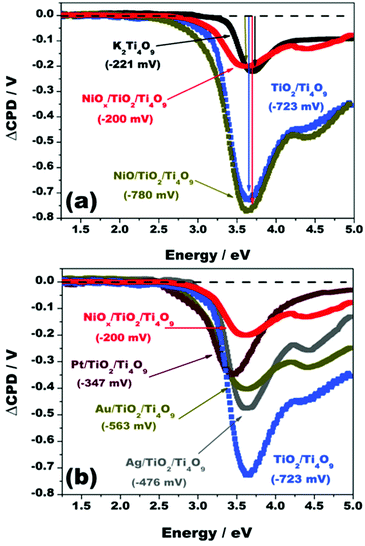
The SPS spectra of films of the materials K2Ti4O9, TiO2/Ti4O9, NiO/TiO2/Ti4O9, and NiOx/TiO2/Ti4O9 on fluorine-doped tin oxide glass (FTO) are displayed in Fig. 7a.
Under illumination, the film of the pristine K2Ti4O9 produced a maximum contact potential difference variation (ΔCPD) of −221 mV at a photon energy of 3.70 eV, above the optical bandgap of this semiconductor, with an onset at 3.37 eV, confirming that the photogenerated charge carriers were produced by the excitation of electrons from the valence band (VB) to the conduction band (CB) of K2Ti4O9. The effective band gap of 3.37 eV given by the SPS spectrum of potassium tetratitanate agrees with the band gap indicated by UV/Vis diffuse reflectance spectroscopy (3.40 eV). The negative variation of the CPD signal indicates that the electrons of the film flow towards the conducting substrate and away from the Kelvin probe, whereas the holes accumulate in the film. This is a characteristic of n-type semiconductors, in which electrons are the majority charge carriers.52
After pillaring, the intensity of the ΔCPD signal substantially increased from −221 mV to −709 mV at an energy value of 3.70 eV, representing the enhancement of the electron density that is transferred to FTO because of the proper coupling between TiO2 nanoparticles and Ti4O92− nanosheets. TiO2 anatase is also an n-type semiconductor with a band gap energy of 3.2 eV,53,54 and its incorporation created a three-dimensional interface for charge separation and transport. The onset of the spectrum of TiO2/Ti4O9 decreased to 2.88 eV (effective band gap), much lower than that of K2Ti4O9 (3.37 eV), reflecting the formation of intermediate states by the pillaring of the layered structure.
The loading of NiO nanoparticles onto TiO2/Ti4O9, enhanced the photovoltage from −709 to −768 mV at a photon energy of 3.70 eV, with a slight decrease in the onset value. These results imply that nickel oxide (a p-type semiconductor) acts as a hole-trapping site in the structure, which enhances the positive polarization of the sample, intensifying the charge carrier separation under illumination. The proper alignment of the energy levels of the VB of nickel oxide with those of TiO2 and the layered precursor in the protonic form (H2Ti4O9), displayed in Fig. 8, represents the action of NiO as a hole trap centre in this system and the favourable flow of excited electrons into the FTO substrate, as indicated by the SPS measurements.23,42
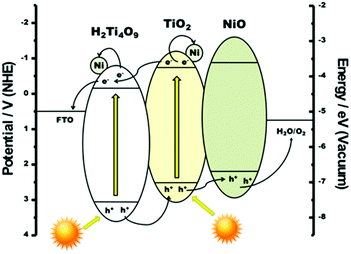 | ||
| Fig. 8 Energy diagram depicting the charge carrier flux in the composite NiOx/TiO2/Ti4O9 under illumination. | ||
The incorporation of Ni nanoparticles onto the surface of NiO/TiO2/Ti4O9, resulting in NiOx/TiO2/Ti4O9, considerably decreased the photovoltage to −195 mV at 3.70 eV (Fig. 7a), suggesting a retention of electrons in the film. This effect opposes that observed for the sole incorporation of NiO. The combined results lead to the conclusion that Ni0 co-catalysts act as electron traps on the TiO2/Ti4O9 system, also represented in Fig. 8, whereas NiO acts as a hole trap, resulting in a joint action for the efficient separation of the charge carriers in the surface of the mesoporous absorber. Having separate reduction and oxidation sites on the surface of the photocatalyst prevents the recombination of electrons and holes and hence leads to the enhancement of the hydrogen production yields, as shown by the photocatalytic tests performed on our materials.
The results described above corroborate those reported for strontium titanate (SrTiO3) modified with the Ni0/NiO combined co-catalyst, in which both species perform complementary roles in the improvement of the overall water splitting.23 The combined loading of both co-catalysts favours the effective charge carrier separation. This conclusion is consistent with the general concept of photochemical diodes where metal particles on photocatalysts act as electron acceptors. It is also supported by the proper alignment of the valence band energy of NiO, which is thermodynamically suitable to accept holes from both K2Ti4O9 and TiO2 semiconductors.22,42 This is the first time an investigation describes this co-catalyst combination with a TiO2-pillared tetratitanate, showing the effects of the charge carrier separation on the activity of the resulting nanocomposite towards the photocatalytic H2 production.
As a comparison, Fig. 7b exhibits the SPS spectra for the materials loaded with silver, gold and platinum, all showing certain decrease in photovoltage compared to TiO2/Ti4O9. These noble metal photocatalysts act as electron trap sites, preventing their flow to the FTO substrate, like metallic nickel nanoparticles. The degree of this decrease in the order Pt > Au > Ag is intimately related to the work functions of the metals, which are 5.65, 5.10 and 4.26 eV, respectively.55
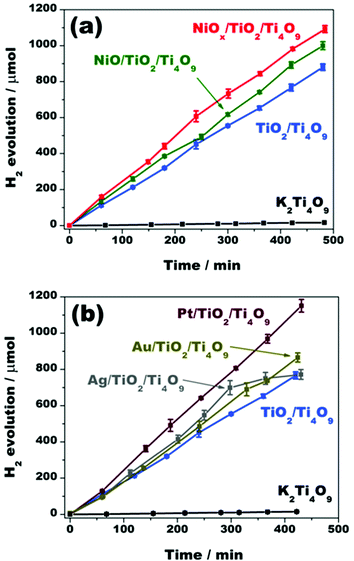
The effect of the improved charge separation by loading NiOx on TiO2/Ti4O9 could be verified by the photocatalytic hydrogen evolution tests, over time, through water splitting employing the photocatalysts K2Ti4O9, TiO2/Ti4O9, NiO/TiO2/Ti4O9 and NiOx/TiO2/Ti4O9 using methanol as a sacrificial agent. The average hydrogen evolution rates are depicted in Fig. 9 together with results of similar experiments with the mesoporous photocatalysts loaded with silver, gold and platinum nanoparticles.
An abrupt increase in the H2 production was observed after the introduction of TiO2 nanopillars within the layered tetratitanate interlamellar region. Apparently, the improved diffusion length of the electrons and holes within the structure has enhanced the rates of the redox reactions.34–36 In terms of values, pristine K2Ti4O9 produced 14.9 μmol of H2 after 7 h of test, whereas TiO2/Ti4O9 generated 766.8 μmol in the same period of time, which represents an increase of 51 times in hydrogen evolution.
The enhanced photoreactivity of the mesoporous material was also favoured by the pronounced increase of surface area, as photocatalytic reactions tend to be accelerated when more active sites are available for interaction with the reactants.24,37,56 The existence of pores in the mesoscale is an extra factor that promotes the diffusion of the reactants within the structure, aiding their accessibility to the photoactive sites.24,27,35,36
The loading of NiOx aided the enhancement of the H2 evolution. SPS results are in accordance with the difference of H2 production before and after the co-catalyst incorporation. Even with the sole deposition of nickel oxide nanoparticles, the H2 production was improved from 766.8 μmol, for TiO2/Ti4O9, to 892.4 μmol, for NiO/TiO2/Ti4O9, after 7 h of irradiation, due to the hole-trapping effect brought by the NiO co-catalyst.
A boost in the H2 evolution yield to 982.0 μmol in 7 h was acquired after the incorporation of nickel metallic nanoparticles onto NiO/TiO2/Ti4O9. This H2 production is 66 times higher than that obtained for pristine K2Ti4O9.17,20,22,57 As already stated by Townsend et al.,23 Ni0 nanoparticles act as a complement to the NiO co-catalyst function in the system by further favouring the charge carrier separation on the surface by trapping the electrons, and then preventing the charge recombination. Thus, the surface of the mesoporous material NiOx/TiO2/Ti4O9 contains separate sites for reduction of protons (Ni0) and oxidation of methanol (NiO), which are accessible through the pores in the mesoscale and the high surface area.
The effective charge carrier separation promoted by the Ni0/NiO co-catalyst system makes the photocatalytic activity of this material comparable to those containing the noble metal nanoparticles silver, gold and platinum. In fact, the materials Ag/TiO2/Ti4O9, Au/TiO2/Ti4O9 and Pt/TiO2/Ti4O9 generated 771.9, 862.4 and 1151 μmol of hydrogen after 7 h of test, whereas NiOx/TiO2/Ti4O9 produced 982.0 μmol.19,21,23
The use of noble metal co-catalysts has proven to be highly efficient for the enhancement of yields of photocatalytic processes due to various features, as discussed in previous reports.14,58,59 However, the specificity of the Ni0/NiO system for the charge carrier separation made it more efficient than the mesoporous materials loaded with Ag and Au. Besides, a decrease in the H2 evolution rate was detected for Ag/TiO2/Ti4O9 after 5 h of test, probably due to the poisoning of the co-catalyst.
Photocatalytic hydrogen production tests were also carried out over pure and NiOx-loaded (2 wt%) commercial TiO2 P25, presenting yields of 51.3 and 260.9 μmol of H2 after 7 h, respectively (Fig. S7†). These results confirm the advantage of using this mesoporous pillared structure as the main photocatalyst, compared to a recognized photoactive semiconductor.
The noble-metal-free characteristic of this photocatalyst is important because the high cost of the overall process is a constant hindrance to the large-scale application of photocatalysis in the production of fuels. Even though the porous material loaded with Pt presented higher yield compared to NiOx/TiO2/Ti4O9, the difference in the H2 production (169.0 μmol after 7 h) does not compensate for the high cost attached to the use of such noble metals. The substitution with the much cheaper NiOx co-catalyst is very advantageous to reduce the price of the whole process, maintaining the high efficiency.
Experimental section
Chemicals
The synthesis and pillaring of K2Ti4O9 were carried out by using titanium(IV) oxide, anatase ≥99.99% (Aldrich); potassium carbonate, ≥99% (Aldrich); tetrabutylammonium hydroxide, 40 wt% (1.5 mol L−1) solution in water (Acros Organics); titanium(IV) isopropoxide, 97% (Aldrich); and acetylacetone P. A. (Merck). Nickel(II) nitrate hexahydrate, >99% (Acros Organics) was employed for the loading of NiO and Ni0 on the surface of the porous material. The photodepositions of Ag, Au and Pt nanoparticles were performed by using silver nitrate, 99.9% (Alfa Aesar); hydrogen tetrachloroaurate(III) hydrate, 99.99% (Alfa Aesar); and chloroplatinic acid hydrate, ≥99.9% (Aldrich) as precursors, respectively. Titanium(IV) dioxide P25, ≥99.5% (Sigma-Aldrich), used for photoactivity comparison; ethanol, ≥99.8% (Synth); nitric acid, 68.0–70.0% (Synth); 2-propanol, ≥99.5% (Sigma-Aldrich) and methanol, ≥99.8% (Sigma-Aldrich) were high-grade reagents and were used as purchased. Deionized water used in the experiments was purified to 18.2 MΩ cm resistivity using an ultra-pure Milli-Q Millipore system.Synthesis and pillaring of K2Ti4O9
Potassium tetratitanate (K2Ti4O9) was prepared by suspending K2CO3 and TiO2 anatase (molar ratio of 1![[thin space (1/6-em)]](https://www.rsc.org/images/entities/char_2009.gif) :
:![[thin space (1/6-em)]](https://www.rsc.org/images/entities/char_2009.gif) 3.5) in acetone (20 wt% of solid). The suspension was sonicated for 10 min, wet-ground in a mortar and, after evaporating the solvent at 60 °C, heated at 800 °C for 20 h under a ramp of 10 °C min−1. The grinding and heating procedures were repeated. The resulting white solid was washed three times with fractions of 30 mL of deionized water, and dried at 100 °C, under vacuum, for 8 h.
3.5) in acetone (20 wt% of solid). The suspension was sonicated for 10 min, wet-ground in a mortar and, after evaporating the solvent at 60 °C, heated at 800 °C for 20 h under a ramp of 10 °C min−1. The grinding and heating procedures were repeated. The resulting white solid was washed three times with fractions of 30 mL of deionized water, and dried at 100 °C, under vacuum, for 8 h.
The obtained K2Ti4O9 sample was converted into its layered protonic form (H2Ti4O9) by stirring it in 100 mL of a 1.0 mol L−1 HCl aqueous solution at room temperature for 3 days (the acidic solution was replaced by a fresh one every day). The product was then centrifuged, washed with deionized water and dried at 100 °C under vacuum for 8 h.
In a next step, 5.0 g (14.8 mmol) of H2Ti4O9 was exfoliated by dispersing it in 250 mL of an aqueous solution containing 11.5 g (44.4 mmol) of tetrabutylammonium hydroxide (TBAOH), through ultrasonication at room temperature, for 2 h. The molar ratio TBAOH![[thin space (1/6-em)]](https://www.rsc.org/images/entities/char_2009.gif) :
:![[thin space (1/6-em)]](https://www.rsc.org/images/entities/char_2009.gif) H2Ti4O9 employed was 3
H2Ti4O9 employed was 3![[thin space (1/6-em)]](https://www.rsc.org/images/entities/char_2009.gif) :
:![[thin space (1/6-em)]](https://www.rsc.org/images/entities/char_2009.gif) 1. The pH of this exfoliated suspension was carefully adjusted to 9 with 0.5 mol L−1 HNO3 prior to the addition of the TiO2 nanosol.
1. The pH of this exfoliated suspension was carefully adjusted to 9 with 0.5 mol L−1 HNO3 prior to the addition of the TiO2 nanosol.
In a separate flask, 8.42 g (29.6 mmol) of titanium isopropoxide was slowly added to a mixture of 34.6 mL (337 mmol) of acetylacetone and 85.4 mL (1.12 mol) of 2-propanol. This solution was stirred for 30 min at room temperature. The monodisperse TiO2 nanosol was then prepared by adding dropwise this titanium isopropoxide solution to 60 mL of a 0.1 mol L−1 HNO3 aqueous solution, under vigorous stirring. This mixture was maintained under vigorous stirring for 24 h at room temperature.
The TiO2 nanosol was added dropwise to the exfoliated Ti4O92− suspension and stirred at 60 °C for 24 h. In such a material, the molar ratio between TiO2 and Ti4O92− (TiO2![[thin space (1/6-em)]](https://www.rsc.org/images/entities/char_2009.gif) :
:![[thin space (1/6-em)]](https://www.rsc.org/images/entities/char_2009.gif) Ti4O92−) is 2
Ti4O92−) is 2![[thin space (1/6-em)]](https://www.rsc.org/images/entities/char_2009.gif) :
:![[thin space (1/6-em)]](https://www.rsc.org/images/entities/char_2009.gif) 1, according to the quantity of titanium isopropoxide used in the synthesis. The product was centrifuged, washed several times with a 1
1, according to the quantity of titanium isopropoxide used in the synthesis. The product was centrifuged, washed several times with a 1![[thin space (1/6-em)]](https://www.rsc.org/images/entities/char_2009.gif) :
:![[thin space (1/6-em)]](https://www.rsc.org/images/entities/char_2009.gif) 1 v/v water
1 v/v water![[thin space (1/6-em)]](https://www.rsc.org/images/entities/char_2009.gif) :
:![[thin space (1/6-em)]](https://www.rsc.org/images/entities/char_2009.gif) ethanol solution, to remove the excess of TiO2 nanosol, and dried at 60 °C under vacuum for 8 h. The pillaring of the material was concluded by heating it at 300 °C for 2 h under a heating ramp of 1 °C min−1. The as-prepared porous material was named TiO2/Ti4O9. As the organic cation TBA is removed after heating, the negative charge is balanced by H+ ions from the HNO3 aqueous solution.
ethanol solution, to remove the excess of TiO2 nanosol, and dried at 60 °C under vacuum for 8 h. The pillaring of the material was concluded by heating it at 300 °C for 2 h under a heating ramp of 1 °C min−1. The as-prepared porous material was named TiO2/Ti4O9. As the organic cation TBA is removed after heating, the negative charge is balanced by H+ ions from the HNO3 aqueous solution.
For comparison purposes, nanoparticles of TiO2 anatase were prepared through a similar route, excluding the addition of the exfoliated nanosheets in the synthesis.
NiOx loading
For the incorporation of the NiOx co-catalyst, 1.0 g of TiO2/Ti4O9 was added to 20 mL of an aqueous solution containing 0.0390 g (134 mmol) of Ni(NO3)2·6H2O (1 wt% loading of NiO), and the components were thoroughly mixed in a sonication bath for 10 min. The solvent was removed after centrifuging and the solid was annealed at 400 °C for 60 min, under an O2 flow. This material, named NiO/TiO2/Ti4O9, was washed with three 30 mL fractions of deionized water and dried at 70 °C for 8 h. The photodeposition of Ni0 nanoparticles was carried out by suspending 0.5 g of NiO/TiO2/Ti4O9 in 20 mL of an aqueous solution containing 0.0248 g (0.0851 mmol) of Ni(NO3)2·6H2O (equivalent to 1 wt% Ni0 loading) and 10 mL of pure methanol, in a round bottom quartz flask. This flask was connected to an air-tight irradiation setup linked to a Varian 3800 gas chromatograph (with a 60/80 Å molecular sieve column and thermal conductivity detector) and the mixture was irradiated using a 300 W Xe lamp (175 mW cm−2) under an argon atmosphere and stirred for 12 h. The resulting grey solid, named NiOx/TiO2/Ti4O9, was centrifuged, washed with three 3 mL fractions of deionized water, and dried in an oven at 70 °C for 8 h.Noble metal loadings
Briefly, 0.3 g of TiO2/Ti4O9 was suspended in 20 mL of deionized water, in a round bottom quartz flask, followed by the addition of 0.0094 g (55.6 mmol) of AgNO3, which corresponds to 2 wt% Ag0 loading. The mixture was sonicated for 10 min and subsequently connected to an air-tight irradiation setup linked to a Varian 3800 gas chromatograph. The system was constantly stirred and irradiated by a 300 W Xe lamp (175 mW cm−2) for 6 h. The resulting solid was then centrifuged, washed with three 30 mL fractions of deionized water and dried at 70 °C for 8 h. This Ag-loaded mesoporous material was named Ag/TiO2/Ti4O9.Similar procedures were followed for the loading of Au and Pt nanoparticles onto TiO2/Ti4O9 by substituting AgNO3 with 0.0109 g (30.5 mmol) of HAuCl4·H2O and 0.0126 g (30.8 mmol) of H2PtCl6·H2O, also corresponding to loadings of 2 wt% of Au and Pt on TiO2/Ti4O9, respectively. These materials were named Au/TiO2/Ti4O9 and Pt/TiO2/Ti4O9.
Surface photovoltage spectroscopy (SPS) measurements
SPS measurements were conducted under vacuum (8.6 × 10⁻⁵ mbar) on films on fluorine-doped tin oxide (FTO) substrates. A gold Kelvin probe (Delta PHI Besocke) mounted inside a vacuum chamber served as the reference electrode. The samples were illuminated with monochromatic light from a 150 W Xe lamp filtered through an Oriel Cornerstone 130 monochromator (0.1–0.3 mW cm−2). Films of the samples with average thickness of approximately 6 μm, as shown by the profilometer scan in Fig. S8,† were prepared by drop-coating 4 mg mL−1 aqueous dispersions of the photocatalysts on FTO slides. After drying in air, the films were annealed at 150 °C for 90 min.Photocatalytic hydrogen production
Dispersions of 50 mg of each photocatalyst in 50 mL of 20 vol% aqueous methanol solutions were prepared in a round bottom quartz flask to measure the rate of hydrogen evolution. The flask was evacuated down to 50 torr and purged with argon several times until the chromatogram of the headspace indicated an air-free environment. The system was irradiated with a 300 W xenon arc lamp (power density of incident light = 224 mW cm−2), after filtering out the infrared portion with a water filter. The air-tight irradiation system was connected to a vacuum pump and to a Varian 3800 gas chromatograph (with a 60/80 Å molecular sieve column and thermal conductivity detector – TCD) to quantify the amount of evolved H2, using area counts of the recorded peaks. The measurements were repeated at least two more times for each material.Characterization
X-ray diffraction (XRD) patterns were collected on a Shimadzu model XRD-7000 diffractometer using Cu Kα radiation (0.154 nm) at 40 kV and 30 mA with a rate of 0.01° s−1 for 2θ values from 1.5 to 80°. N2 adsorption–desorption isotherms of samples previously outgassed at 150 °C for 12 h were collected on a Quantachrome Nova 4200 instrument at −195.8 °C. The specific surface areas and pore volumes were calculated through the Brunauer–Emmett–Teller (BET) equation, whereas the pore size distributions were assessed by employing the Kernel non-local density functional theory (NLDFT) on the desorption branch of the isotherms. Transmission electron microscopy (TEM) and high-resolution TEM (HRTEM) images were obtained using a HRTEM-JEM 3010 URP microscope at an accelerating voltage of 300 kV at the Electron Microscopy Laboratory (LME) located at CNPEM. The samples were prepared by dispersing the materials in water, followed by drop-casting onto a carbon-coated copper grid (400 mesh). A JEOL JEM 2100F microscope equipped with an EDS detector and a GIF Tridiem 863 filter was employed for the Energy Dispersive Spectroscopy (EDS) mappings. X-ray photoelectron spectroscopy (XPS) measurements were carried out on a Thermo VG Scientific Sigma Probe instrument with the monochromatic Al Kα X-ray source (1486.6 eV) focused on the samples. The high-resolution spectrum was collected with pass energy of 20 eV and energy step size of 0.1 eV with a flood gun on to eliminate surface charge. The ultraviolet-visible spectra were obtained through the diffuse reflectance spectroscopy (DRS) method using a Thermo Scientific Evolution 220 spectrometer. The thicknesses of the films analysed through SPS were measured with a Veeco Dektak profilometer.Conclusions
Our results exemplify how the thoughtful alteration of some properties of well-known semiconductors like K2Ti4O9 can turn them into more powerful systems for the photocatalytic production of hydrogen from water splitting.Novel photocatalysts were synthesized by the modification of the photoactive layered semiconductor K2Ti4O9 through the pillaring with TiO2 nanoparticles and surface decoration with NiO and Ni0 (NiOx) co-catalysts. The pillaring conferred a 51-fold increase in the H2 production due to an improved charge separation within the structure with a concomitant increase in the surface area and formation of pores at the mesoscale range. These characteristics reflected in a large enhancement in the photovoltage from −221 mV to −709 mV at a photon energy of 3.70 eV.
The loading of nickel metal nanoparticles and NiO intensified the charge carrier separation at the surface and further boosted the H2 evolution because they function as complementary components. Ni0 acts as an electron trap and a reduction site while NiO accumulates holes and it acts as an oxidation site, as indicated by surface photovoltage spectroscopy. This feature makes the efficacy of this co-catalyst system comparable to those of noble metal co-catalysts, as confirmed by the photocatalytic tests, which makes the system more commercially attractive.
Conflicts of interest
The authors declare no competing financial interest.Acknowledgements
The authors acknowledge São Paulo Research Foundation (FAPESP – Grants 2013/05654-9 and 2014/22388-3) for financial support and fellowship, the National Centre for Energy and Materials Research (CNPEM) for the TEM images (LME), and Dr Frank E. Osterloh for access to the surface photovoltage spectrometer and H2 testing equipment.References
- J. W. Ager, M. R. Shaner, K. A. Walczak, I. D. Sharp and S. Ardo, Energy Environ. Sci., 2015, 8, 2811–2824 CAS.
- A. Kudo and Y. Miseki, Chem. Soc. Rev., 2009, 38, 253–278 RSC.
- F. E. Osterloh, Chem. Soc. Rev., 2013, 42, 2294–2320 RSC.
- D. M. Fabian, S. Hu, N. Singh, F. A. Houle, T. Hisatomi, K. Domen, F. E. Osterloh and S. Ardo, Energy Environ. Sci., 2015, 8, 2825–2850 CAS.
- T. Shirakawa, M. Higashi, O. Tomita and R. Abe, Sustainable Energy Fuels, 2017, 1, 1065–1073 CAS.
- J. Yu, L. Qi and M. Jaroniec, J. Phys. Chem. C, 2010, 114, 13118–13125 CAS.
- T. Puangpetch, S. Chavadej and T. Sreethawong, Energy Convers. Manage., 2011, 52, 2256–2261 CrossRef CAS.
- A. Iwase, H. Kato and A. Kudo, Catal. Lett., 2006, 108, 7–10 CrossRef CAS.
- Y.-G. Lin, Y.-K. Hsu, Y.-C. Chen, S.-B. Wang, J. T. Miller, L.-C. Chen and K.-H. Chen, Energy Environ. Sci., 2012, 5, 8917–8922 CAS.
- S. Uchida, Y. Yamamoto, Y. Fujishiro, A. Watanabe, O. Ito and T. Sato, J. Chem. Soc., Faraday Trans., 1997, 93, 3229–3234 RSC.
- R. Konta, T. Ishii, H. Kato and A. Kudo, J. Phys. Chem. B, 2004, 108, 8992–8995 CrossRef CAS.
- O. Rosseler, M. V. Shankar, M. K.-L. Du, L. Schmidlin, N. Keller and V. Keller, J. Catal., 2010, 269, 179–190 CrossRef CAS.
- Y. Zhong, K. Ueno, Y. Mori, T. Oshikiri and H. Misawa, J. Phys. Chem. C, 2015, 119, 8889–8897 CAS.
- Y. Wang, Y. Wang and R. Xu, J. Phys. Chem. C, 2013, 117, 783–790 CAS.
- M. Wang, J. Han, Y. Hu, R. Guo and Y. Yin, ACS Appl. Mater. Interfaces, 2016, 8, 29511–29521 CAS.
- W. Wang, W. Zhang, C. Hao, F. Wu, Y. Liang, H. Shi, J. Wang, T. Zhang and Y. Hua, Sol. Energy Mater. Sol. Cells, 2016, 152, 1–9 CrossRef CAS.
- X. Chen, W. Chen, H. Gao, Y. Yang and W. Shangguan, Appl. Catal., B, 2014, 152–153, 68–72 CrossRef CAS.
- C.-J. Chen, C.-H. Liao, K.-C. Hsu, Y.-T. Wu and J. C. S. Wu, Catal. Commun., 2011, 12, 1307–1310 CrossRef CAS.
- Q. Liu, L. Zhang and P. A. Crozier, Appl. Catal., B, 2015, 172, 58–64 CrossRef.
- Z. Zou, J. Ye and H. Arakawa, J. Phys. Chem. B, 2002, 106, 13098–13101 CrossRef CAS.
- M. Zhong, T. Hisatomi, Y. Kuang, J. Zhao, M. Liu, A. Iwase, Q. Jia, H. Nishiyama, T. Minegishi, M. Nakabayashi, N. Shibata, R. Niishiro, C. Katayama, H. Shibano, M. Katayama, A. Kudo, T. Yamada and K. Domen, J. Am. Chem. Soc., 2015, 137, 5053–5060 CrossRef CAS PubMed.
- K. R. Yoon, J. W. Ko, D.-Y. Youn, C. B. Park and I.-D. Kim, Green Chem., 2016, 18, 944–950 RSC.
- T. K. Townsend, N. D. Browning and F. E. Osterloh, Energy Environ. Sci., 2012, 5, 9543–9590 CAS.
- M. Alves Melo Júnior, A. Morais and A. F. Nogueira, Microporous Mesoporous Mater., 2016, 234, 1–11 CrossRef.
- A. Corma, Chem. Rev., 1997, 97, 2373–2419 CrossRef CAS PubMed.
- X. Chen and S. S. Mao, Chem. Rev., 2007, 107, 2891–2959 CrossRef CAS PubMed.
- F. J. V. E. Oliveira, M. A. Melo Jr and C. Airoldi, Mater. Res. Bull., 2013, 48, 1045–1056 CrossRef CAS.
- L. Mercier and T. J. Pinnavaia, Adv. Mater., 1997, 9, 500–503 CrossRef CAS.
- M. R. Allen, A. Thibert, E. M. Sabio, N. D. Browning, D. S. Larsen and F. E. Osterloh, Chem. Mater., 2010, 22, 1220–1228 CrossRef CAS.
- M. A. Melo Jr and C. Airoldi, Dalton Trans., 2010, 39, 10217–10227 RSC.
- M. Machida, X. W. Ma, H. Taniguchi, J.-I. Yabunaka and T. Kijima, J. Mol. Catal. A: Chem., 2000, 155, 131–142 CrossRef CAS.
- W. Hou, Q. Yan, B. Peng and X. Fu, J. Mater. Chem., 1999, 5, 109–114 RSC.
- M. A. Melo Jr, F. J. V. E. Oliveira and C. Airoldi, Appl. Clay Sci., 2008, 42, 130–136 CrossRef.
- J.-H. Choy, H.-C. Lee, H. Jung, H. Kim and H. Boo, Chem. Mater., 2002, 14, 2486–2491 CrossRef CAS.
- B. Li, B.-Z. Lin, O. Zhang, L.-M. Fu, H. Liu, Y.-L. Chen and B.-F. Gao, J. Colloid Interface Sci., 2012, 386, 1–8 CrossRef CAS PubMed.
- B.-H. Xu, B.-Z. Lin, Q.-Q. Wang, X.-T. Pian, O. Zhang and L.-M. Fu, Microporous Mesoporous Mater., 2012, 147, 79–85 CrossRef.
- Y. Zhang, H. Liu, G. Zhang, L. He, P. Liu and B. Lin, Mater. Res. Bull., 2014, 60, 510–515 CrossRef CAS.
- L. L. Zhang, Z. Xiong and X. S. Zhao, ACS Nano, 2010, 4, 7030–7036 CrossRef CAS PubMed.
- D. Escalera-López, Y. Niu, J. Yin, K. Cooke, N. V. Rees and R. E. Palmer, ACS Catal., 2016, 6, 6008–6017 CrossRef PubMed.
- K. Kamonsuangkasem, S. Therdthianwong, A. Therdthianwong and N. Thammajak, Appl. Catal., B, 2017, 218, 650–663 CrossRef CAS.
- S. Song, S. Yao, J. Cao, L. Di, G. Wu, N. Guan and L. Li, Appl. Catal., B, 2017, 217, 115–124 CrossRef CAS.
- B. A. Nail, J. M. Fields, J. Zhao, J. Wang, M. J. Greaney, R. L. Brutchey and F. E. Osterloh, ACS Nano, 2015, 9, 5135–5142 CrossRef CAS PubMed.
- C. G. Silva, R. Juárez, T. Marino, R. Molinari and H. García, J. Am. Chem. Soc., 2011, 133, 595–602 CrossRef PubMed.
- K. Ueno, T. Oshikiri and H. Misawa, ChemPhysChem, 2016, 17, 199–215 CrossRef CAS PubMed.
- M. A. Melo Jr, L. S. S. Santos, M. C. Gonçalves and A. F. Nogueira, Quim. Nova, 2012, 35, 1872–1878 CrossRef.
- J. Wang, J. Zhao and F. E. Osterloh, Energy Environ. Sci., 2015, 8, 2970–2976 CAS.
- J. Zhao and F. E. Osterloh, J. Phys. Chem. Lett., 2014, 5, 782–786 CrossRef CAS PubMed.
- L. Kronik and Y. Shapira, Surf. Sci. Rep., 1999, 37, 1–206 CrossRef CAS.
- F. E. Osterloh, M. A. Holmes, J. Zhao, L. Chang, S. Kawula, J. D. Roehling and A. J. Moulé, J. Phys. Chem. C, 2014, 118, 14723–14731 CAS.
- J. Zhao, B. A. Nail, M. A. Holmes and F. E. Osterloh, J. Phys. Chem. Lett., 2016, 7, 3335–3340 CrossRef CAS PubMed.
- T. L. Shelton, N. Harvey, J. Wang and F. E. Osterloh, Appl. Catal., A, 2016, 521, 168–173 CrossRef CAS.
- J. Wang and F. E. Osterloh, J. Mater. Chem. A, 2014, 2, 9405–9411 CAS.
- A. Fujishima and K. Honda, Nature, 1972, 238, 37–38 CrossRef CAS PubMed.
- C. Burda, Y. Lou, X. Chen, A. C. S. Samia, J. Stout and J. L. Gole, Nano Lett., 2003, 3, 1049–1051 CrossRef CAS.
- H. B. Michaelson, J. Appl. Phys., 1977, 48, 4729–4733 CrossRef CAS.
- F. E. Osterloh, ACS Energy Lett., 2017, 2, 445–453 CrossRef CAS.
- L. Guo, H. Hagiwara, S. Ida, T. Daio and T. Ishihara, ACS Appl. Mater. Interfaces, 2013, 5, 11080–11086 CAS.
- S. Linic, P. Christopher and D. B. Ingram, Nat. Mater., 2011, 10, 911–921 CrossRef CAS PubMed.
- I. Thomann, B. A. Pinaud, Z. Chen, B. M. Clemens, T. F. Jaramillo and M. L. Brongersma, Nano Lett., 2011, 11, 3440–3446 CrossRef CAS PubMed.
Footnote |
| † Electronic supplementary information (ESI) available: Some additional characterization results, including XRD patterns, N2 adsorption–desorption isotherms, TEM images and EDS mappings. See DOI: 10.1039/c7se00589j |
| This journal is © The Royal Society of Chemistry 2018 |

