Green and facile fabrication of hierarchical N-doped porous carbon from water hyacinths for high performance lithium/sodium ion batteries†
Guang
Zeng
 *ab,
Baolong
Zhou
ab,
Luocai
Yi
ab,
Hao
Li
ab,
Xiang
Hu
ab and
Yan
Li
ab
aCAS Key Laboratory of Design and Assembly of Functional Nanostructures, Fujian Institute of Research on the Structure of Matter, Chinese Academy of Sciences, Fuzhou 350002, P. R. China. E-mail: zengguang@fjirsm.ac.cn
bFujian Provincial Key Laboratory of Nanomaterials, Fujian Institute of Research on the Structure of Matter, Chinese Academy of Sciences, Fuzhou 350002, P. R. China
First published on 29th January 2018
Abstract
Exploitation of carbon materials by efficient and environment-friendly methods is of great scientific and technical significance in meeting the demands of energy storage devices. Here, we demonstrate a low-cost, simple and readily scalable approach for the synthesis of hierarchically N-doped porous carbon (NPC) from an eco-unfriendly and fast-growing hydrophyte, i.e., the stem medulla of water hyacinths. During carbonization treatment, the alkaline or alkali earth elements that naturally exist within the stem medulla can induce the formation of pores accompanying a self-activation process analogous to KOH-activation of carbon materials. The optimized NPC shows a specific area as high as 1005 m2 g−1 with a hierarchical porous structure, and manifests excellent electrochemical performance as anode materials for both Li-ion batteries (LIBs) and Na-ion batteries (SIBs), in terms of specific capacity, cycling stability, and rate capability, benefitting from the synergistic effects of the hierarchical porous structure and N-doping.
1. Introduction
Greenhouse gas emission-induced climate change has been a serious environmental problem.1 In response to this problem, people are seeking green, reproducible energy such as solar and wind energy, as well as energy storage technologies. As energy storage devices, lithium/sodium ion batteries (LIBs/NIBs) are two promising options due to their long cycle life, high energy density and coulombic efficiency.2–6 Carbon-based materials are still the mainstream active components for the anode materials in these two batteries due to their high surface area, high electrical conductivity, and excellent chemical stability. Graphite is the most widely used anode material for commercial LIBs. In the past decades, the discovery of fullerenes, carbon nanotubes, and graphene has attracted significant interest, and these carbon materials exhibit promising applications in the field of energy.7,8 However, the synthetic processes of these materials still face the challenges of environmental harm and high cost for scalable production.9,10 Therefore, exploitation of novel carbon materials in a more efficient and environment-friendly manner with low-cost precursors is of great scientific and technical significance in meeting the demands in wide applications.Carbon materials derived from biomass have been extensively investigated due to their abundance, easy processability, tunable pore properties and low cost. Accordingly, biomass derived anode materials for LIBs/NIBs have been explored with sources such as wool,11 okara,12 peanut shells,13,14 pomelo peels,15 coffee shells,16 and plant biomass.17–23 It was reported that activated carbon derived from coffee shells via a KOH activation had a capacity of 300 mA h g−1 over 15 cycles for LIBs.16 Similarly, a porous hard carbon was synthesized by simple pyrolysis of H3PO4-treated pomelo peels, exhibiting good cycling stability and rate capability.15 The feasibility for large-scale production of such carbon materials, associated with their energy storage performance, should be taken into consideration when using biomass sources for the preparation of carbon materials. First, the biomass source should be low-cost; second, biomass with a short growth cycle and high reproductive ability is highly desirable, such as algal bloom;24 third, biomass itself possessing unique porosity could be an ideal precursor of carbon materials, because micropores can offer abundant active sites for adsorption and electrode/electrolyte interfacial reactions, while mesopores provide short transport pathways for rapid migration of ions leading to high-rate performance.25 Activation is the most common method to introduce porosity and enhance the surface area of carbon materials, such as physical activation and chemical activation.26 However, the activation process involves time-consuming multiple steps with increasing cost, and the requirement of large amounts of corrosive activating agents (like KOH, ZnCl2 and H3PO4) is harmful for environmental safety. In this regard, employing appropriate biomass precursors could be one attractive strategy to prepare ideal carbon anode materials for LIBs/NIBs.
Water hyacinths (WHs) are worldwide aquatic plants found in Asia, North America, Africa and Australia, featuring a high reproductive ability that may cause serious ecological problems. In addition, WHs possess thin cell walls, large intercellular spaces and contain an amount of naturally embedded alkaline or alkali earth elements at the molecular level.27 The alkaline or alkali earth elements (like Na+, K+, Ca2+, Mg2+) that already exist within the WHs can induce self-activation during pyrolysis, which is more environmentally friendly and cost effective.26,28 Moreover, WHs contain about 30% protein that can provide a direct and easy way for self-doping of nitrogen in porous carbon,29 being beneficial for facilitating the charge transfer and electrode–electrolyte interactions at the interface of carbon electrodes through enhancing the conductivity and surface wettability.30
Herein, we demonstrate a low-cost, facile and readily scalable approach for the synthesis of N self-doped hierarchically porous carbon (NPC) from the stem medulla of water hyacinths (WH-M) without introducing extra activation agents. We have evaluated such NPC as anode materials for LIBs and NIBs, and they did show excellent electrochemical performance. The present work may provide a route to potentially overcome the environmental threats of WHs while providing promising anode materials for LIBs and NIBs.
2. Experimental
2.1 Materials preparation
The WHs were collected from a local lake (Fuzhou, China). The stems of water hyacinths were separated into the epidermis and medulla. The latter were washed with deionized (DI) water, and dried in an oven at 80 °C overnight. The carbonization was performed at different temperatures (700, 900, and 1100 °C with a heating rate of 10 °C min−1) in a tubular furnace for 2 h under a N2 flow. When cooled down to room temperature, the samples were ground and rinsed extensively with 2 M HCl at 60 °C for 15 h to remove the remaining impurities. The purified samples were collected by filtration after rinsing with DI water several times, and then dried in an oven at 80 °C. The yield of the porous carbon from the stem of water hyacinths is around 30%. The obtained water hyacinth derived-porous carbons are denoted as NPC-T, where T denotes the pyrolysis temperature (700, 900, and 1100 °C).2.2 Characterization
The as-prepared carbon materials were characterized using X-ray diffraction (XRD, MiniFlex600, Rigaku), Raman spectrometry (LabRAM HR, 532 nm laser), X-ray photoelectron spectroscopy (XPS, Thermo Scientific ESCALAB 250Xi), scanning electron microscopy (SEM, NOVA NANOSEM450) and transmission electron microscopy (TEM, JEM-2010). The thermogravimetry analysis (TGA) of the carbon materials was recorded with a Netzsch STA 449 thermogravimetric analyzer at a heating rate of 10 °C min−1 in an argon atmosphere. The amount of metal ions was determined by inductively coupled plasma atomic emission spectroscopy (ICP-AES, HORIBA Jobin Yvon Ultima 2).2.3 Electrochemical measurements
Electrochemical performance was investigated using CR2032 coin cells. The carbon materials derived from the stems of water hyacinths were used as the anode materials with Li/Na metal as the counter as well as reference electrodes, for the LIB and NIB respectively. The working electrodes were prepared by mixing 80 wt% NPC with 10 wt% Super-P carbon black and 10 wt% polyvinylidene fluoride (PVDF) as the binder to form a slurry. The resulting slurry was coated onto Cu foil and then dried at 80 °C for 12 h under vacuum. For sodium-ion batteries, glass microfiber (Whatman GF/D) was used as the separator and the electrolyte solution used in this work was 1 M NaClO4 in an ethylene carbonate (EC)/propylene carbonate (PC)/fluoroethylene carbonate (FEC) (1![[thin space (1/6-em)]](https://www.rsc.org/images/entities/char_2009.gif) :
:![[thin space (1/6-em)]](https://www.rsc.org/images/entities/char_2009.gif) 1
1![[thin space (1/6-em)]](https://www.rsc.org/images/entities/char_2009.gif) :
:![[thin space (1/6-em)]](https://www.rsc.org/images/entities/char_2009.gif) 0.05 v/v/v) mixture. For lithium-ion batteries, a Celgard 2400 membrane was used as the separator and 1 M LiPF6 in a mixture of EC and dimethyl carbonate (DMC) (1
0.05 v/v/v) mixture. For lithium-ion batteries, a Celgard 2400 membrane was used as the separator and 1 M LiPF6 in a mixture of EC and dimethyl carbonate (DMC) (1![[thin space (1/6-em)]](https://www.rsc.org/images/entities/char_2009.gif) :
:![[thin space (1/6-em)]](https://www.rsc.org/images/entities/char_2009.gif) 1 = v/v) as the electrolyte. The mass loading of the electrodes is about 1.0 mg cm−2. All the coin cells were assembled in an argon-filled glove box with O2 and H2O contents below 0.5 and 0.5 ppm, respectively. The galvanostatic charge–discharge tests were performed on a Land-CT2001A battery testing system in a voltage window of 0.005–3.0 V. Cyclic voltammetry measurements (0.005–3.0 V) were carried out at a scan rate of 0.1 mV s−1 using a CHI604E electrochemical workstation.
1 = v/v) as the electrolyte. The mass loading of the electrodes is about 1.0 mg cm−2. All the coin cells were assembled in an argon-filled glove box with O2 and H2O contents below 0.5 and 0.5 ppm, respectively. The galvanostatic charge–discharge tests were performed on a Land-CT2001A battery testing system in a voltage window of 0.005–3.0 V. Cyclic voltammetry measurements (0.005–3.0 V) were carried out at a scan rate of 0.1 mV s−1 using a CHI604E electrochemical workstation.
3. Results and discussion
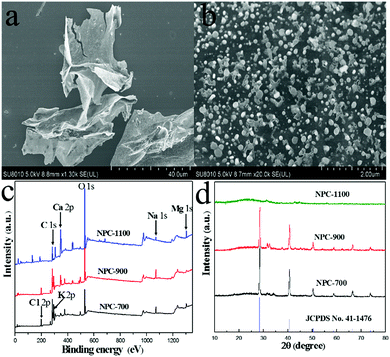
Fig. 1a shows the digital photo of the stem medulla of water hyacinths, one can clearly observe a continuous 3D macroporous network containing numerous micrometer-scale tubes with a honeycomb-like configuration and parallel arrangement. Such honeycomb-like hierarchical porous architecture should be beneficial to prepare hierarchically porous carbon materials. The other organs, such as root, leaf and the stem epidermis deserve further study. The synthesis of NPC is illustrated in Fig. 1b. The set of carbon samples is denoted as NPC-T, where T refers to the pyrolysis temperature (700, 900, and 1100 °C). Thermogravimetric (TG) analysis was carried out to investigate the carbonization process of the WH-M under an argon atmosphere (Fig. S1†). The weight loss below 210 °C is due to the elimination of remaining water in the cells of WH-M and externally bonded water. A distinct weight loss stage from around 210 to 630 °C is shown in the TG curve. The weight loss is mainly attributed to the evaporation of H2O, CO and CO2, resulting from the escape of O and H atoms in WH-M.31 Though part of the elemental carbon in water hyacinths was carbonized into carbon dioxide (CO2) during the pyrolysis process, the natural decomposition or burning of water hyacinths would transform all the elemental carbon into CO2 and/or methane (CH4), both of which are greenhouse gases. In this sense, exploitation of carbon materials from water hyacinths shows positive effects in reducing, instead of increasing, the emission of CO2 and/or CH4. The yield of the obtained material is as much as 30%. We have summarized the yields of the carbon materials in this work and some other typically biomass derived carbon materials in Table S1† and the yield of 30% in this work is considered to be at the top of the list.Scanning electron microscopy (SEM) was employed to investigate the morphology of NPC-700 before rinsing with hydrochloric acid. A plate-like structure with round salt pockets is clearly observed (Fig. 2a and b). During heating the water evaporates, and the naturally embedded biological salts aggregate to form these salt pockets both within and on the surface of the WH-M.17 X-ray photoelectron spectroscopy (XPS) was conducted to analyse the elemental compositions of NPC before rinsing with hydrochloric acid, which mainly include C, O, Cl, Na, Mg, K and Ca (Fig. 2c). To determine the amount of metal ions, selected nine common metals in the pyrolysed carbon materials were measured by ICP-AES (Table S2†). Before rinsing with hydrochloric acid, the overall metal contents in the samples NPC-700 and NPC-900 are both nearly 20% and K is dominant. For NPC-1100, however, the overall metal content dramatically decreases to 7.68% mainly resulting from the decrease of K. After rinsing with hydrochloric acid, the metal ions were almost all removed for the three samples NPC-700, NPC-900 and NPC-1100. X-ray diffraction (XRD) was carried out to analyse the phase information of NPC before rinsing with hydrochloric acid (Fig. 2d). The XRD patterns of NPC-700 and NPC-900 show large KCl peaks (JCPDS no. 41-1476) while no visible peaks of crystalline inorganics are observed for NPC-1100; this result is in accordance with the ICP results. Because the melting point of KCl is 770 °C, the salts could escape from the carbon structure when the pyrolysis temperature was above 770 °C, and the salts were nearly volatile for NPC-1100. Due to the natural presence of minerals in WH-M (primarily KCl), which play the same role as additives in chemical-activation processes,17,28,32 porosity can be produced without any additional energy-consuming activation step. Thus, direct pyrolysis of K-rich WHs can therefore be explored as a preponderant sustainable and green pathway for production of hierarchical porous carbon.
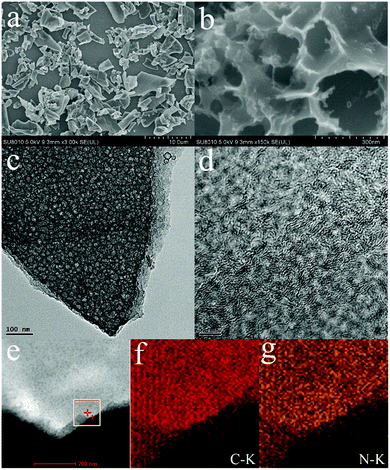
The hierarchically porous structure of NPC is clearly confirmed from the SEM and transmission electron microscopy (TEM) images. Fig. 3a depicts the SEM image of NPC-700 from a macroscopic perspective, showing a laminar structure. A 3D sponge-like hierarchical macro–meso–microporous structure can be obviously observed from the images taken under higher magnification. Fig. 3b shows a continuous macroporous network inherited from the natural structure of WH-M and the diameter of the macropores is about 100–300 nm. As observed in Fig. 3c and d, large quantities of meso- and micropores are uniformly distributed inside the 3D sponge-like carbon sheet. TEM images in Fig. S2,† representing NPC-900 and NPC-1100, display a similar 3D sponge-like hierarchical porous structure. The general shape of the meso- and micropores of the carbon sheet is circular, which supports the idea that salt pocket formation and subsequent melting induces the generation of a void space. The elemental mapping images (Fig. 3e–g) demonstrate the uniform distribution of carbon and nitrogen in NPC-700.
X-ray diffraction (XRD) patterns of the three NPC-T samples are presented in Fig. 4a, which exhibit two broad peaks centered at 23.6° and 43.4°, corresponding to the (002) and (100) lattice planes of typical turbostratic carbon. This indicates that the graphene layers randomly translate to each other.33 Raman spectra of the samples show two prominent peaks centered at around 1347 and 1590 cm−1 that were the characteristic D and G bands of carbon materials, respectively (Fig. 4b). The D band is indicative of the defects and disorder in the structure of the graphene, while the G band is related to the E2g vibration of sp2 C atoms in graphene. The intensity ratio of the D and G bands (ID/IG) can be used to quantify the extent of disorder within the samples.20 From the spectra, the ID/IG ratio was estimated to be 1.05, 1.00, and 0.91 for NPC-700, NPC-900, and NPC-1100, respectively, indicating a higher degree of structural alignment at a higher carbonization temperature.34
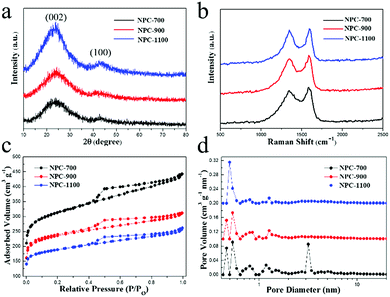 | ||
| Fig. 4 (a) XRD patterns, (b) Raman spectra, (c) nitrogen adsorption–desorption isotherms and (d) pore size distribution of NPC-700, NPC-900 and NPC-1100. | ||
Fig. 4c shows the nitrogen adsorption–desorption isotherms of NPC, and Fig. 4d shows their resultant pore size distributions (PSDs). The amount of N2 adsorbed by NPC decreases with increasing the temperature from 700 to 1100 °C, suggesting the decreased specific surface area (SSA) and pore volume. The SSAs of NPC-700, NPC-900 and NPC-1100, quantified by the Brunauer–Emmett–Teller (BET) method, are about 1005.4 m2 g−1, 774.3 m2 g−1 and 616.8 m2 g−1 (Table 1). With the increase of pyrolysis temperature, both the SSA and pore volume decreased, which was probably due to the enhanced orientation in the graphitization process and the weakened self-activation.35 The surface area value of NPC-700, realized without any pre/post treatment, is quite high as compared to other cases of carbon obtained by using activating agents such as KOH and ZnCl2. All the WH-M samples show the combination of type I and IV isotherms (Fig. 4c), indicating the typical characteristics of micropores and mesopores.36 Consistent results were obtained in the PSD studies which were calculated by the density functional theory (DFT) method (Fig. 4d). All the carbons showed the prevalence of micropores ranging from 0.4 to 2.0 nm in size. Different from the samples NPC-900 and NPC-1100, a sharp peak centred at 3.2 nm was developed for the sample NPC-700, resulting in a higher ratio of mesopore volume to total pore volume for NPC-700 (Table 1). This is crucial for fast electrolyte transfer because mesopores would provide a more favorable path for penetration and transportation of ions.25
| Samples | S BET (m2 g−1) | V t (cm3 g−1) | Micropores% | Mesopores% | At% (C) | At% (N) | At% (O) |
|---|---|---|---|---|---|---|---|
| NPC-700 | 1005.4 | 0.68 | 44.1 | 55.9 | 90.11 | 2.26 | 7.63 |
| NPC-900 | 774.3 | 0.48 | 50.0 | 50.0 | 92.25 | 1.25 | 6.50 |
| NPC-1100 | 616.8 | 0.41 | 48.8 | 51.2 | 95.03 | 0.27 | 4.70 |
To analyze the elemental composition, XPS was performed on the as-prepared carbon materials. From the survey spectra of NPC in Fig. S3,† one can see that all samples derived after rinsing with hydrochloric acid exhibited only three peaks centered at 284.7 eV, 400.0 eV and 532.5 eV, corresponding to C 1s, N 1s and O 1s, respectively. Based on the integrated peak areas, the percentage of chemical composition is summarized in Table 1. The level of nitrogen doping was estimated to be 2.26 at% for NPC-700, 1.25 at% for NPC-900, and 0.27 at% for NPC-1100, suggesting a diminishing nitrogen loading at increasing pyrolysis temperature. The electrochemical performance of NPC can be improved by the N doping as it enhances the electronic conductivity as well as formation of defects which act as active Li/Na storage sites.37
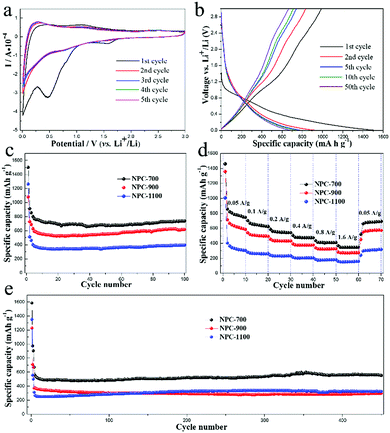
The performances of the three samples as the anodes of LIBs were investigated in half cells with metallic lithium as the counter and reference electrodes. As shown in Fig. 5a, NPC-700 shows typical cyclic voltammogram (CV) curves for carbon anode materials.19,20,38 In the first cycle, a small reduction peak appeared at 1.57 V, which was ascribed to the irreversible reaction of the electrolyte with surface functional groups. Another sharp irreversible peak at 0.47 V in the first cathodic process can be assigned to the formation of a solid electrolyte interface (SEI) layer.39 The small anodic hump at lower voltages can be related to the Li extraction from NPC-700.40 The CV curves nearly overlap after the first cycle, indicating good reversibility with excellent capacity retention and electrochemical stability during the Li intercalation/deintercalation process. Fig. 5b shows the 1st, 2nd, 5th, 10th, and 50th charge/discharge profiles of the NPC-700 electrode for LIBs at a current density of 50 mA g−1 between 0.005 and 3.0 V. For the first cycle, the discharge and charge capacities of the NPC-700 electrode are 1500 and 989 mA h g−1, respectively, corresponding to an initial coulombic efficiency (CE) of 65.9%. The large capacity loss in the first cycle is mainly ascribed to the formation of SEI on the electrode surface as well as to the irreversible loss of some Li storage sites within the carbon. Nevertheless, the capacity loss only occurs in the first two cycles, the capacity stabilizes to about 667 mA h g−1 in the 50th cycle.
The cycling performances of the three electrodes were tested by cycling the cells at 50 mA g−1 for 100 cycles and 400 mA g−1 for 450 cycles, as depicted in Fig. 5c and e. When cycled at 50 mA g−1, NPC-700 delivered a discharge capacity of 914 mA h g−1 in the second cycle, but NPC-900 and NPC-1100 only delivered a sodiation capacity of 730 and 511 mA h g−1. After 100 cycles, the NPC-700 sample retained a capacity of 740 mA h g−1. Compared to NPC-700, the NPC-900 and NPC-1100 electrodes exhibited lower capacities; about 617 mA h g−1 and 395 mA h g−1 remained after 100 cycles, respectively. The specific capacities of each sample exhibit a gradual increase over cycles, suggesting that the initially unexposed meso- and micropores become more accessible after repeated cycling.17 Impressively, all of the NPC-700, NPC-900 and NPC-1100 demonstrate ultra-long cycling stability when cycled at a current density of 400 mA g−1 (Fig. 5e). As can be seen, the NPC-700 electrode still exhibits a higher capacity of 552 mA h g−1 (296 mA h g−1 for NPC-900; 323 mA h g−1 for NPC-1100) after 450 cycles. Fig. 5d shows the rate capability of the three samples with 10 cycles at each rate. When the current density is increased successively from 0.05 A g−1 to 0.1, 0.2, 0.4, 0.8 and 1.6 A g−1, the NPC-700 electrode delivers high stabilized specific capacities of 747, 625, 543, 475, 410 and 348 mA h g−1, respectively. When the current density goes back to 0.05 A g−1, the discharge capacity of NPC-700 is recovered to 693 mA h g−1, indicating good stability after the high rate discharging and charging test. Compared with NPC-700, both the NPC-900 and the NPC-1100 electrodes deliver obvious lower discharge capacities at various current densities from 0.05 A g−1 to 1.6 A g−1. Based on the above analysis, the overall performance of NPC-700 is more favorable than the other two samples in terms of both cycling and high rate capacity retention. The lower capacities of NPC-900 and NPC-1100 are mainly due to the low microporosity and mesoporosity in these two samples, which can offer abundant active sites for adsorption and electrode/electrolyte interfacial reactions.25 In addition, higher N doping in NPC-700 would introduce more defects in the carbon materials which act as active Li storage sites.37 For comparison, the electrochemical performances of NPC-700 and some other typically biomass derived carbon anodes for LIBs are shown in Table S3.†
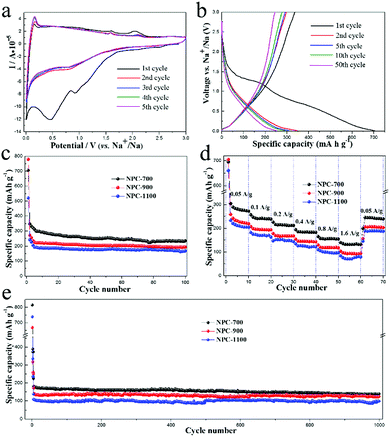
The set of NPC samples were also evaluated as anodes for NIBs. The CV curves of NPC-700 measured between 0.005 and 3.0 V with a sweep rate of 0.1 mV s−1 are shown in Fig. 6a. The peaks during the first cathodic scan correspond to the Na insertion into the carbon materials and the formation of the SEI layer, respectively. In the subsequent cycles, cathodic peaks were observed at 0.77 V and near 0 V; the small peak at 0.77 V may be ascribed to faradaic capacitive reactions on the carbon surface,20 while the evident peak close to 0 V is attributed to sodium insertion. In the anodic scan, a clear peak at about 0.15 V and two small peaks at 1.58 V and 2.10 V are observed, which are attributed to the sodium extraction from the carbon. The CV curves almost overlapped after the initial cycle, indicating the reversible interaction of sodium ion within the NPC-700. Fig. 6b shows the 1st, 2nd, 5th, 10th and 50th charge/discharge profiles of the NPC-700 electrode for NIBs at a constant current density of 50 mA g−1. In the first cycle, the electrode delivered the specific discharge and charge capacities of 880 and 421 mA h g−1, respectively, corresponding to an initial coulombic efficiency of 47.8%. The large capacity loss in the first cycle is mainly ascribed to the formation of SEI on the electrode surface as well as to the irreversible loss of some Na storage sites within the carbon. In the subsequent cycles, the coulombic efficiency rose dramatically to 99%.
In terms of cycling and rate performance, it shows a trend similar to the case of LIBs. The cycling performances of NPC-700, NPC-900 and NPC-1100 electrodes at 50 mA g−1 for 100 cycles are shown in Fig. 6c. The NPC-700 electrode exhibits a higher capacity of 293 mA h g−1 (192 mA h g−1 for NPC-900; 167 mA h g−1 for NPC-1100) after 100 cycles. When cycled at a current density of 400 mA g−1, all of NPC-700, NPC-900 and NPC-1100 demonstrate ultra-long cycling stability (Fig. 6e). After 1000 cycles, NPC-700, the NPC-900 and the NPC-1100 can still deliver capacities of 140 mA h g−1, 124 mA h g−1, and 99 mA h g−1, respectively. The rate capability of these electrodes is tested at varying current densities ranging from 0.05 A g−1 to 1.6 A g−1 (Fig. 6d). As can be seen, NPC-700 delivers a much higher capacity than the other two electrodes at the same current density. The stabilized specific capacities for NPC-700 are 248, 217, 193, 166, 141 and 120 mA h g−1, respectively. When the current density goes back to 0.05 A g−1, the discharge capacity of NPC-700 is recovered to 218 mA h g−1, indicating good stability after the high rate discharging and charging test.
In spite of the lower capacities, both NPC-900 and NPC-1100 exhibit similar rate performance to NPC-700. Owing to the larger ionic radius of Na (0.102 nm) than that of Li (0.076 nm), it is difficult for Na+ to insert into the interlayers of graphite. It was reported that Na+ is able to reversibly insert into the graphene layers only when the interlayer distance is larger than 0.37 nm.41,42Fig. 7 exhibits the HRTEM images and selected-area electron diffraction (SAED) patterns for NPC-700, NPC-900 and NPC-1100. For NPC-700, fuzzy diffraction rings can be observed and 2–3 layer-stacked graphene layers can be identified from the HRTEM image (Fig. 7a). The related SAED pattern (inset of Fig. 7a) can be well-indexed to carbon, indicating the initiation of graphitization.43 Accompanying the increase in temperature from 700 °C to 1100 °C, the diffraction rings became brighter and sharper, implying an enhanced graphitization which can be further confirmed by HRTEM (Fig. 7b–c). Meanwhile, the average d-spacing of the graphene layers gradually decreased from 0.42 nm to 0.40 nm and 0.37 nm when the pyrolysis temperature increased from 700 °C to 900 °C and 1100 °C. Apart from the influencing factors of porosity and the content of N-doping in LIBs, the wider d-spacing of graphene layers of the NPC-700 should also be responsible for the higher capacity of NPC-700 in NIBs. For comparison, the electrochemical performances of NPC-700 and some other typically biomass derived carbon anodes for NIBs are shown in Table S4.† It can be concluded that the sample NPC-700 manifests excellent electrochemical performance as an anode material for both LIBs and SIBs, in terms of specific capacity, cycling stability, and rate capability.
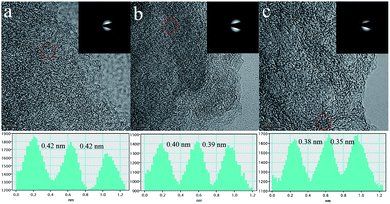 | ||
| Fig. 7 HRTEM images (insets are the SAED patterns) and line profiles of the d-spacing of graphene sheets of (a) NPC-700, (b) NPC-900, and (c) NPC-1100. | ||
4. Conclusions
In summary, N-doped hierarchically porous carbon materials have been successfully synthesized from the stem medulla of water hyacinths by a facile pyrolysis process without any chemical or physical activation. The effect of carbonization temperature was systematically investigated. The carbons derived from WH-M at 700 °C demonstrated the best cycling performance and rate capability when used as the anode of LIBs and SIBs. This superior electrochemical performance of biomass derived carbons can be attributed to the presence of the hierarchical porous structure and N-doping of carbon. The excellent performance, combined with the green, facile, and economical method for synthesis, should make carbonized WHs a highly attractive practical LIB and NIB anode material.Conflicts of interest
There are no conflicts to declare.Acknowledgements
We would like to thank 1000 Plan Professorship for Young Talents, Hundred Talents Program of Fujian Province, and the Fujian Science and Technology Key Project (Item Number. 2016H0043) for financial support.Notes and references
- J. Deng, M. M. Li and Y. Wang, Green Chem., 2016, 18, 4824–4854 RSC.
- Y. X. Tang, Y. Y. Zhang, W. L. Li, B. Ma and X. D. Chen, Chem. Soc. Rev., 2015, 44, 5926–5940 RSC.
- W. Wei, Z. H. Wang, Z. Liu, Y. Liu, L. He, D. Z. Chen, A. Umar, L. Guo and J. H. Li, J. Power Sources, 2013, 238, 376–387 CrossRef CAS.
- H. Wang, Q. Q. Liang, W. J. Wang, Y. R. An, J. H. Li and L. Guo, Cryst. Growth Des., 2011, 11, 2942–2947 CAS.
- C. Bommier and X. L. Ji, Isr. J. Chem., 2015, 55, 486–507 CrossRef CAS.
- K. J. Zhu, X. F. Wang, J. Liu, S. Li, H. Wang, L. Y. Yang, S. L. Liu and T. Xie, ACS Sustainable Chem. Eng., 2017, 7b01595 Search PubMed.
- K. Kim, D. G. Lim, C. W. Han, S. Osswald, V. Ortalan, J. P. Youngblood and V. G. Pol, ACS Sustainable Chem. Eng., 2017, 7b01497 Search PubMed.
- Z. B. Yang, J. Ren, Z. T. Zhang, X. L. Chen, G. Z. Guan, L. B. Qin, Y. Zhang and H. S. Peng, Chem. Rev., 2015, 115, 5159–5223 CrossRef CAS PubMed.
- W. S. Hummers and R. E. Offeman, J. Am. Chem. Soc., 1958, 80, 1339 CrossRef CAS.
- P. Kim, L. Shi, A. Majumdar and P. L. McEuen, Phys. Rev. Lett., 2001, 87, 215502 CrossRef CAS PubMed.
- X. M. Zhu, Q. Li, S. Qiu, X. L. Liu, L. F. Xiao, X. P. Ai, H. X. Yang and Y. L. Cao, JOM, 2016, 68, 2579–2584 CrossRef CAS.
- T. Z. Yang, T. Qian, M. F. Wang, X. W. Shen, N. Xu, Z. Z. Sun and C. L. Yan, Adv. Mater., 2016, 28, 539–545 CrossRef CAS PubMed.
- J. Ding, H. L. Wang, Z. Li, K. Cui, D. Karpuzov, X. H. Tan, A. Kohandehghan and D. Mitlin, Energy Environ. Sci., 2015, 8, 941–955 CAS.
- G. T. K. Fey, D. C. Lee, Y. Y. Lin and T. P. Kumar, Synth. Met., 2003, 139, 71–80 CrossRef CAS.
- K. L. Hong, L. Qie, R. Zeng, Z. Q. Yi, W. Zhang, D. Wang, W. Yin, C. Wu, Q. J. Fan, W. X. Zhang and Y. H. Huang, J. Mater. Chem. A., 2014, 2, 12733–12738 CAS.
- Y. J. Hwang, S. K. Jeong, K. S. Nahm, J. S. Shin and A. M. Stephan, J. Phys. Chem. Solids, 2007, 68, 182–188 CrossRef CAS.
- B. Campbell, R. Ionescu, Z. Favors, C. S. Ozkan and M. Ozkan, Sci. Rep., 2015, 5, 14575 CrossRef CAS PubMed.
- J. Liu, P. Kopold, P. A. van Aken, J. Maier and Y. Yu, Angew. Chem., Int. Ed., 2015, 54, 9632–9636 CrossRef CAS PubMed.
- S. B. Wang, C. L. Xiao, Y. L. Xing, H. Z. Xu and S. C. Zhang, J. Mater. Chem. A, 2015, 3, 6742–6746 CAS.
- J. Jiang, J. H. Zhu, W. Ai, Z. X. Fan, X. N. Shen, C. J. Zou, J. P. Liu, H. Zhang and T. Yu, Energy Environ. Sci., 2014, 7, 2670–2679 CAS.
- J. Ding, H. L. Wang, Z. Li, A. Kohandehghan, K. Cui, Z. W. Xu, B. Zahiri, X. H. Tan, E. M. Lotfabad, B. C. Olsen and D. Mitlin, ACS Nano, 2013, 7, 11004–11015 CrossRef CAS PubMed.
- L. P. Wang, Z. Schnepp and M. M. Titirici, J. Mater. Chem. A, 2013, 1, 5269–5273 CAS.
- L. M. Wu, D. Buchholz, C. Vaalma, G. A. Giffin and S. Passerini, ChemElectroChem, 2016, 3, 292–298 CrossRef CAS.
- X. H. Meng, P. E. Savage and D. Deng, Environ. Sci. Technol., 2015, 49, 12543–12550 CrossRef CAS PubMed.
- M. K. Rybarczyk, H. J. Peng, C. Tang, M. Lieder, Q. Zhang and M. M. Titirici, Green Chem., 2016, 18, 5169–5179 RSC.
- J. Wang, P. Nie, B. Ding, S. Y. Dong, X. D. Hao, H. Dou and X. G. Zhang, J. Mater. Chem. A, 2017, 5, 2411–2428 CAS.
- P. Gupta, S. Roy and A. B. Mahindrakar, Resources and Environment, 2012, 2, 202–215 CrossRef.
- M. Biswal, A. Banerjee, M. Deo and S. Ogale, Energy Environ. Sci., 2013, 6, 1249–1259 CAS.
- C. C. Gunnarsson and C. M. Petersen, Waste Manage., 2007, 27, 117–129 CrossRef PubMed.
- J. P. Paraknowitsch and A. Thomas, Energy Environ. Sci., 2013, 6, 2839–2855 CAS.
- G. Y. Xu, J. P. Han, B. Ding, P. Nie, J. Pan, H. Dou, H. S. Li and X. G. Zhang, Green Chem., 2015, 17, 1668–1674 RSC.
- E. Raymundo-Pinero, M. Cadek and F. Beguin, Adv. Funct. Mater., 2009, 19, 1032–1039 CrossRef CAS.
- K. T. Lee, J. C. Lytle, N. S. Ergang, S. M. Oh and A. Stein, Adv. Funct. Mater., 2005, 15, 547–556 CrossRef CAS.
- C. Kim, K. S. Yang, M. Kojima, K. Yoshida, Y. J. Kim, Y. A. Kim and M. Endo, Adv. Funct. Mater., 2006, 16, 2393–2397 CrossRef CAS.
- H. Zhu, X. L. Wang, X. X. Liu and X. R. Yang, Adv. Mater., 2012, 24, 6524–6529 CrossRef CAS PubMed.
- E. M. Lotfabad, J. Ding, K. Cui, A. Kohandehghan, W. P. Kalisvaart, M. Hazelton and D. Mitlin, ACS Nano, 2014, 8, 7115–7129 CrossRef CAS PubMed.
- J. K. Ou, Y. Z. Zhang, L. Chen, Q. Zhao, Y. Meng, Y. Guo and D. Xiao, J. Mater. Chem. A, 2015, 3, 6534–6541 CAS.
- Y. Z. Zhang, Y. Meng, L. Chen, Y. Guo and D. Xiao, J. Mater. Chem. A, 2016, 4, 17491–17502 CAS.
- K. Tang, L. J. Fu, R. J. White, L. H. Yu, M. M. Titirici, M. Antonietti and J. Maier, Adv. Energy Mater., 2012, 2, 873–877 CrossRef CAS.
- T. Ohzuku, Y. Iwakoshi and K. Sawai, J. Electrochem. Soc., 1993, 140, 2490–2498 CrossRef CAS.
- Y. L. Cao, L. F. Xiao, M. L. Sushko, W. Wang, B. Schwenzer, J. Xiao, Z. M. Nie, L. V. Saraf, Z. G. Yang and J. Liu, Nano Lett., 2012, 12, 3783–3787 CrossRef CAS PubMed.
- M. S. Balogun, Y. Luo, W. T. Qiu, P. Liu and Y. X. Tong, Carbon, 2016, 98, 162–178 CrossRef.
- Y. M. Chen, Z. G. Lu, L. M. Zhou, Y. W. Mai and H. T. Huang, Energy Environ. Sci., 2012, 5(7), 7898–7902 CAS.
Footnote |
| † Electronic supplementary information (ESI) available. See DOI: 10.1039/c7se00517b |
| This journal is © The Royal Society of Chemistry 2018 |


