
 Open Access Article
 This Open Access Article is licensed under a Creative Commons Attribution-Non Commercial 3.0 Unported Licence
EDTA etching: a simple way for regulating the traps, size and aqueous-dispersibility of Cr3+-doped zinc gallate†‡
He-Fang
Wang
 *ab,
Xi
Chen
a,
Fan
Feng
a,
Xia
Ji
a and
Ye
Zhang
a
*ab,
Xi
Chen
a,
Fan
Feng
a,
Xia
Ji
a and
Ye
Zhang
a
aResearch Center for Analytical Sciences, College of Chemistry, Nankai University, Tianjin Key Laboratory of Biosensing and Molecular Recognition, State Key Laboratory of Medicinal Chemical Biology, Tianjin 300071, China. E-mail: wanghefang@nankai.edu.cn
bCollaborative Innovation Center of Chemical Science and Engineering (Tianjin), Tianjin 300071, China
First published on 12th November 2018
Abstract
Traps, size and aqueous-dispersibility are the most important parameters that affect the features and applications of persistent luminescent nanoparticles (PLNPs). However, simultaneous controlling of these parameters is rather difficult and has not been reported yet. We present the first exploration on adjusting the traps, size and aqueous-dispersibility of PLNPs via simple ethylenediaminetetraacetate (EDTA) etching. Cr0.0043+:ZnGa2O4 (ZGO) was used as the PLNP model. EDTA etching of the sintered ZGO results in effective reduction of the size and great improvement in the aqueous-dispersibility. In addition, EDTA etching alters the density of mediate traps and generates new deep traps, thus achieving the massive production of (ultra)small ZGO–EDTA with fine aqueous-dispersibility, suitable mediate/deep traps and superlong bright afterglows (51 days). As EDTA can interact with most metals, this simple EDTA etching strategy is prospectively amenable to other PLNPs, and the resulting PLNPs–EDTA have wide applications in both biological field and information storage.
Introduction
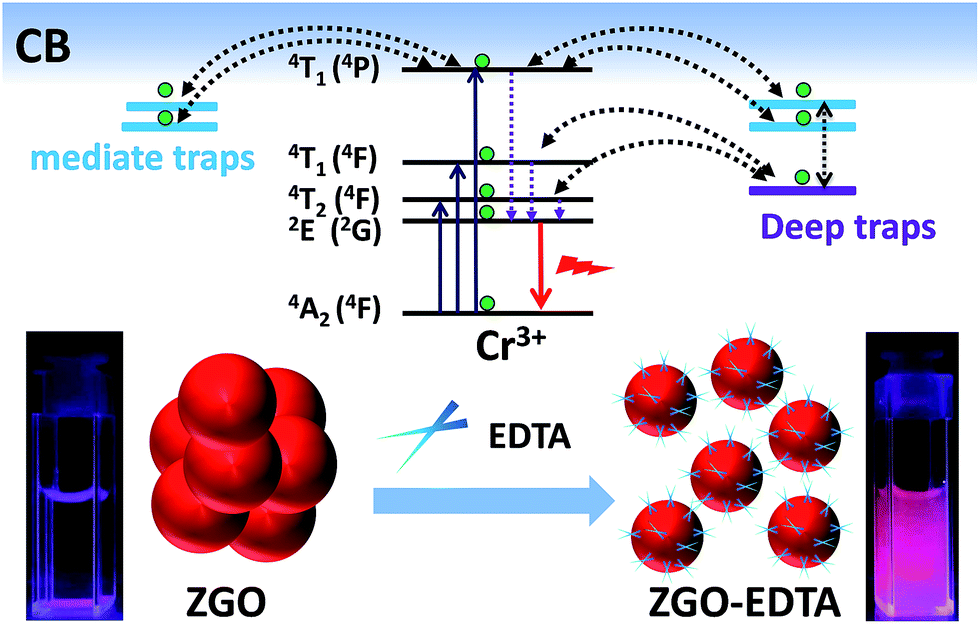
Persistent luminescent nanoparticles (PLNPs)1–5 have aroused considerable attention in pre-excitation optosensing,6–10 bioimaging,11–28 drug delivery,29–31 imaging-guided therapy,6,32–36 and information storage.22,37–39 Traps, size and aqueous-dispersibility are the most important parameters that affect the features and applications of PLNPs. For instance, the density of mediate traps (0.5–0.8 eV) is considered to be interrelated with the room temperature (RT) afterglow intensity and durations. Deep traps of 0.8–1.6 eV are required for retaining the recorded information for long time,37,38 while the size and aqueous-dispersibility of PLNPs are the key factors in biological applications.40 Some studies have reported the low-temperature-synthesis methods, including the hydrothermal (200–220 °C7,41,42), biphasic (160 °C)43 and microwave-assisted non-aqueous sol–gel (270 °C),44 to obtain the small-sized PLNPs, but without controlling the traps. Others reported doping with different codopants for engineering the trap depth,37,38 but with no ideas on adjusting the size and dispersibility. To the best of our knowledge, simultaneous controlling of the traps, size and dispersibility of PLNPs is a formidable task, and has not been reported yet.Herein, we present the first exploration on adjusting the traps, size and aqueous-dispersibility of PLNPs via a simple post-treatment of ethylenediaminetetraacetate (EDTA) etching. The widely reported Cr0.0043+:ZnGa2O4 (ZGO) was used as the PLNP model. The ZGO synthesized by the biphasic method43 was sintered at 1000 °C and then treated with EDTA solutions at different temperatures, pH values and amounts (Scheme 1, the details are elaborated in ESI‡). EDTA etching prioritizes in dissolving the interparticle necks between the sintered ZGO nanoparticles, and thus breaks the large particles down into the small particles. Moreover, the EDTA etching drives some metals in ZGO into the supernatants, resulting in further reduction of the size, and the departure of Ga and Zn takes away the linked oxygens and thus generates some oxygen vacancies (corresponding to deep traps) neighboring the remaining Ga and Zn on the resulting nanoparticles of ZGO–EDTA.
 | ||
| Scheme 1 The strategy of EDTA etching for regulating the traps, size and aqueous-dispersibility of ZGO. | ||
To demonstrate the hypothesis, we collected and analyzed the liquid supernatants after the EDTA-treatment by inductively coupled plasma-atomic emission spectroscopy (ICP-AES) to examine the etching amount of the metals. Moreover, the harvested solid particles were dried and evaluated in the aspects of the yield, size, aqueous-dispersibility, photoluminescence (PL), thermo-luminescence (TL) and afterglows. We show that EDTA etching can regulate the traps, size, and aqueous-dispersibility of the resultant ZGO–EDTA nanoparticles. We discuss the reason behind EDTA etching and applications of the ZGO–EDTA nanoparticles in in vivo bioimaging and information storage. To the best of our knowledge, EDTA etching is the first strategy that can simply generate the deep traps while reducing the size and improving the aqueous-dispersibility.
Results and discussion
EDTA etching
The treatments by EDTA solutions at different temperatures (RT and 220 °C), pH (4, 7, 10, 13) and amounts (1, 3, 5, 7 equivalent weight of ZGO) were examined. We first measured the contents of metals in the supernatants treated with EDTA under various conditions and with water, HNO3-pH4, and NaOH-pH13 (the treatments are at 220 °C unless stated otherwise, Table S1‡ and Table 1, the corresponding percentages against the nominal amounts are also listed). The supernatants treated with water and HNO3-pH4 have negligible contents of Ga, Zn and Cr, and the treatment with EDTA at RT (5EDTA-pH13-RT) results in a small quantity of Ga, Zn and Cr in the supernatant. On the contrary, the supernatants treated with 5EDTA-pH (4, 7, 10 and 13) and NaOH-pH13 own substantial concentrations and corresponding percentages of Ga and Zn. The highest and lowest erosion percentage of Ga and Zn are observed at 5EDTA-pH4 and 5EDTA-pH10, respectively. Compared with the data of HNO3-pH4 and NaOH-pH13, the etching percentage of EDTA at identical pH (4 or 13) is significantly high toward Ga and Zn. For Cr, the various amounts of EDTA solutions at pH 13 show the lowest etching percentage. Currently, the reason behind these erosion data is not well understood. One fact we can think of is that Ga, Zn and Cr are amphoteric; thus, ZGO can be partly etched by EDTA solutions at various pH. Among those treatments (Tables S1‡ and 1), EDTA solutions at pH 13 show substantial etching ability toward Ga and Zn (the matrix of ZGO), but very low erosion ability toward Cr, having the potential of reducing the size while maintaining the luminescent center. Thus, we systematically examined the etching cases of various amounts of EDTA at pH 13 in subsequent studies. We note that the etching percentage of Zn is lower than that of Ga (Table 1), resulting in the increase in Zn/(Ga + Cr) ratio of the resultant ZGO–nEDTA (n = 1, 3, 5, 7) nanoparticles, which leaves more chances for Cr3+ to neighbor the antisite defect and finally generate the more intense N2 emission (695 nm) than R emission (688 nm) in PL spectra45 (Fig. S1‡).| Entry | Ga | Zn | Cr | |||
|---|---|---|---|---|---|---|
| Conc.a (mg L−1) | Pb (%) | Conc.a (mg L−1) | Pb (%) | Conc.a (mg L−1) | Pb (%) | |
a The concentration of each metal is detected by ICP-AES.
b The erosion percentage is calculated by 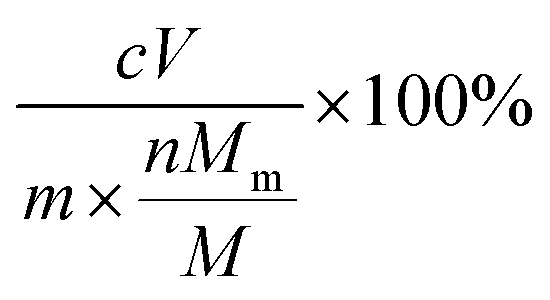 , where c is the concentration of individual metal in the supernatant; V is the volume of the supernatant; m is the mass of raw ZGO; Mm is the molar mass of the individual metal; n is the number of the individual metal in nominal formula of ZGO; and M is the molar mass of ZGO calculated from the nominal formula. , where c is the concentration of individual metal in the supernatant; V is the volume of the supernatant; m is the mass of raw ZGO; Mm is the molar mass of the individual metal; n is the number of the individual metal in nominal formula of ZGO; and M is the molar mass of ZGO calculated from the nominal formula.
|
||||||
| 1EDTA | 1813 ± 38 | 35.0 ± 0.7 | 542 ± 41 | 22.3 ± 1.7 | 0.022 ± 0.004 | 0.22 ± 0.04 |
| 3EDTA | 2125 ± 67 | 41.0 ± 1.3 | 712 ± 21 | 29.3 ± 0.9 | 0.015 ± 0.005 | 0.15 ± 0.05 |
| 5EDTA | 2233 ± 143 | 43.1 ± 2.8 | 714 ± 42 | 29.4 ± 1.7 | 0.030 ± 0.016 | 0.30 ± 0.16 |
| 7EDTA | 1713 ± 38 | 33.0 ± 0.7 | 441 ± 1 | 18.1 ± 0.03 | 0.020 ± 0.001 | 0.21 ± 0.01 |
| H2O | 0.19 ± 0.04 | <0.01 | <0.005 | <0.01 | <0.004 | <0.05 |
We then tested the harvested amounts of ZGO–nEDTA after etching. To imitate the selective sedimentation, all solids after corrosion were re-dispersed in ultrapure-water and settled for 10 min, and the solid in suspensions (marked as ZGO–nEDTA-S) and sediments (marked as ZGO–nEDTA-B) were collected (ZGO-S and ZGO-B are the products from tradition grinding, without hydrothermal treatment). Table S2‡ lists the amounts and the corresponding yields. The traditional grinding gives 4.7% of ZGO-S and 90% of ZGO-B. In contrast, the EDTA etching produces more solid in suspensions (ZGO–nEDTA-S) and less solid in sediments (ZGO–nEDTA-B). The decreased total amounts of ZGO–nEDTA (the sum of S and B) are ascribed to the corrosion by EDTA, as listed in Table 1. The yields of ZGO–nEDTA-S gradually increased with the increase in amount of EDTA, giving the highest yield of 40% when 5EDTA was used. Further increase in EDTA results in slightly lower yield of ZGO–7EDTA-S (35.1%) than ZGO–5EDTA-S (40%), but higher yield of ZGO–7EDTA-B (34.3%) over ZGO–5EDTA-B (23.3%). It is worth noting that the solid in suspensions should have smaller size and/or more water-dispersible ligands than that in sediments. The following section gives the explanation.
Size, zeta-potential and aqueous-dispersibility of ZGO–nEDTA
Fig. 1 describes the size (the hydrodynamic diameter from dynamic light scattering (DLS)) and zeta potential of ZGO, ZGO-S, ZGO-B and ZGO–nEDTA (both S and B, n = 1, 3, 5, 7). Compared with the raw ZGO, all ZGO–nEDTA (both S and B) have smaller size and more negative zeta potential. Moreover, all ZGO–nEDTA-S are sub-10 nm in size, and are smaller than ZGO-S, while all ZGO–nEDTA-B are 22–30 nm in size, and are smaller than ZGO-B (Table S3 in ESI‡). The sizes of ZGO–nEDTA-S and ZGO–nEDTA-B gradually reduced with the increase in the n value (n = 1, 3 and 5, Table S3‡). Owing to the smaller size and more negative zeta potential, all ZGO–nEDTA (n = 1, 3, 5, 7) exhibit much better aqueous-dispersibility than ZGO, ZGO-S and ZGO-B (Fig. S2‡), and ZGO–nEDTA-S have better aqueous-dispersibility than the corresponding ZGO–nEDTA-B. The HRTEM images of ZGO and typical ZGO–5EDTA (Fig. S3‡) further support the changes in the size and dispersibility resulted from EDTA etching. The ZGO from high-temperature calcination exists as ‘hard’ agglomerates,46 as revealed by the large particles composed of many adherent small particles with crystal lattices of different orientations. In contrast, the ZGO–5EDTA (both S and B) exists as the individual smaller nanoparticle of unidirectional lattice. The better dispersibility and more negative zeta potential are related to the more amount of EDTA attached on the nanoparticles. As revealed by FTIR spectra (Fig. S4‡), ZGO–nEDTA-S particles have more EDTA than the corresponding ZGO–nEDTA-B particles, and ZGO has negligible EDTA. All these data demonstrate the merit of EDTA etching over traditional grinding in massively producing the (ultra)small and aqueous-dispersed ZGO–nEDTA nanoparticles. | ||
| Fig. 1 Hydrodynamic diameter (from DLS) and zeta-potential of (a, b) the raw ZGO, ZGO-S and ZGO–nEDTA-S harvested from suspensions, and (c, d) the raw ZGO, ZGO-B and ZGO-nEDTA-B harvested from sediments (n = 1, 3, 5, 7). | ||
TL, traps and afterglows of ZGO–nEDTA
For evaluation of the traps, we conducted TL measurements (Fig. 2, S5 and S6a–c‡). The amount of ZGO-S and ZGO–1EDTA-S was too small (Table S2‡) for TL measurement. Thus, the TL profiles of ZGO-S and ZGO–1EDTA-S are not included in Fig. 2b. The TL profiles of ZGO and ZGO-B are similar, with the extremely broad tailing peaks maximizing at ca. 50 °C (corresponding to mediate traps of 0.64 eV and 0.73 eV, Fig. S5‡), but the TL peak of ZGO-B is lower than that of ZGO. The TL of ZGO–water-B (from hydrothermal treatment by water) also has the similar profile of ZGO, but with the slightly narrower peak and higher intensity at around 50 °C (Fig. S6a‡vs.Fig. 2a). In contrast, the ZGO–nEDTA (both B and S) displays two distinct peaks (one peak at 50 °C as ZGO, ZGO-B and ZGO–water-B, another at around 175–227 °C) and one shoulder between those peaks (Fig. 2). The EDTA treatment at RT also results in the significant increase in TL peak at 175–227 °C of ZGO–5EDTA-RT-B (Fig. S6a‡). These data demonstrate that the EDTA treatments are the cause of the evolution of TL peaks at the high temperature range of 175–227 °C, which are corresponding to the deep traps of 0.83–1.00 eV (Fig. S5, S6b and c‡). Moreover, the TL intensities varied with the amount of EDTA, of which the ZGO–5EDTA-B has the highest TL peaks.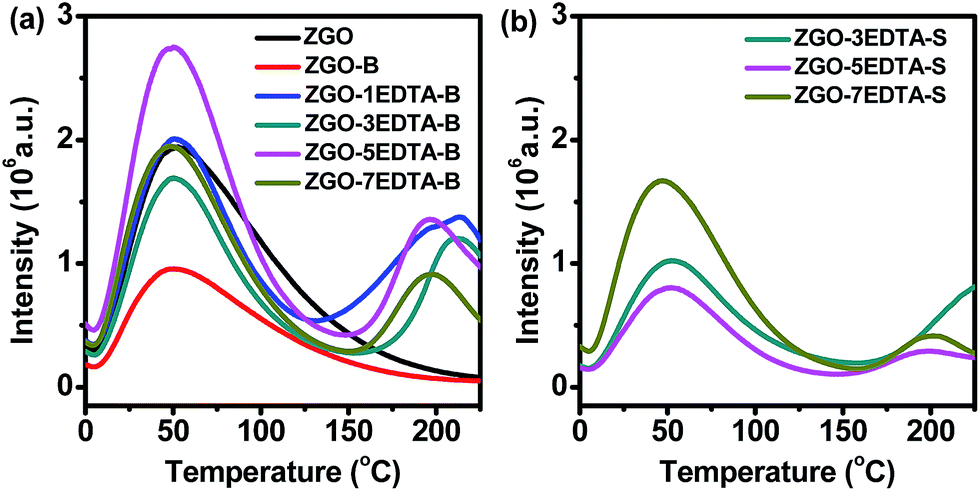 | ||
| Fig. 2 TL of solid (a) ZGO, ZGO-B, ZGO–nEDTA-B and (b) ZGO–nEDTA-S. 60 mg of solid ZGO, ZGO-B and ZGO–nEDTA were irradiated at 0 °C by a 254 nm UV lamp for 5 min. Two minutes later, the solid sample was heated to 237 °C at a heating rate of 10 °C min−1 and the afterglow at 695 nm was synchronously recorded using a FLS920 fluorescence spectrophotometer. | ||
Afterglows are usually related to the traps (reflected by TL peaks). The effective traps for RT afterglows are considered to be around 0.5–0.8 eV, but many reports suggested that the electrons in the deep traps could be retrapped by the mediate or shallow traps via the quantum tunneling process;15 thus, the deep traps also would have some contributions to the RT afterglows. The EDTA etching of ZGO not only alters the density of mediate traps, but also generates the new deep traps; thus, it is a new way to regulate the traps and afterglows of ZGO–EDTA. For instance, the ZGO–5EDTA-B has the highest density of mediate traps and deep traps (Fig. 2a and S5‡), and thus the brightest afterglows for 51 days (Fig. 3b and S7‡). The ZGO–7EDTA-B owns similar density of 0.64 eV traps as ZGO, but displays brighter afterglows than ZGO since the 15th day due to the existence of deep traps. The ZGO–3EDTA-B, which has lower density of mediate traps but higher density of deep traps than ZGO, exhibits higher afterglows over ZGO since the 30th day. The slightly more mediate traps of ZGO–water-B over ZGO–5EDTA-RT-B lead to the slightly higher afterglows of ZGO–water-B over ZGO–5EDTA-RT-B during the first 30 days, while the deep traps of ZGO–5EDTA-RT-B result in the reverse on the 42nd day (Fig. S6d‡). All these data suggest that the mediate traps are related to the afterglow intensity at early durations. After depletion of the electrons in mediate traps, the electrons in deep traps can be released and retrapped by mediate traps, and generate the afterglows of the late stage (the electrons trapped in mediate traps are emptied faster than those in deep traps, as revealed by the decay time-dependent TL measurements in Fig. S8‡). It should be noted that the maintained or enhanced afterglows of the ZGO–nEDTA are companied with the reduced size, which is quite different from the reported PL enhancement of the hydrothermal treatments (where the particle size keeps invariable).
It is worth noting that the afterglow of all solid ZGO, ZGO-S, ZGO-B and ZGO–nEDTA is bright at the 51st day (Fig. S7‡), with the highest signal-to-noise ratio (SNR) of 115 (ZGO–5EDTA-B) and the lowest SNR of 38 (ZGO-S). The ZGO–nEDTA-S (n = 1, 3, 5, and 7) have smaller size than ZGO-S (Fig. 1a), but own higher afterglow than ZGO-S (Fig. 3a and S7‡). Similarly, ZGO–nEDTA-B (n = 1, 3, 5, and 7) also have smaller size (Fig. 1b) but higher afterglow (Fig. 3b) than ZGO-B. These data demonstrate the superiority of EDTA etching in maintaining or enhancing the afterglow when reducing the size. It should be noted that the ZGO–nEDTA-B (n = 3, 5, 7) even own higher afterglow intensity than the raw ZGO, which is the first case of reducing the size but increasing the afterglow of nanoparticles.
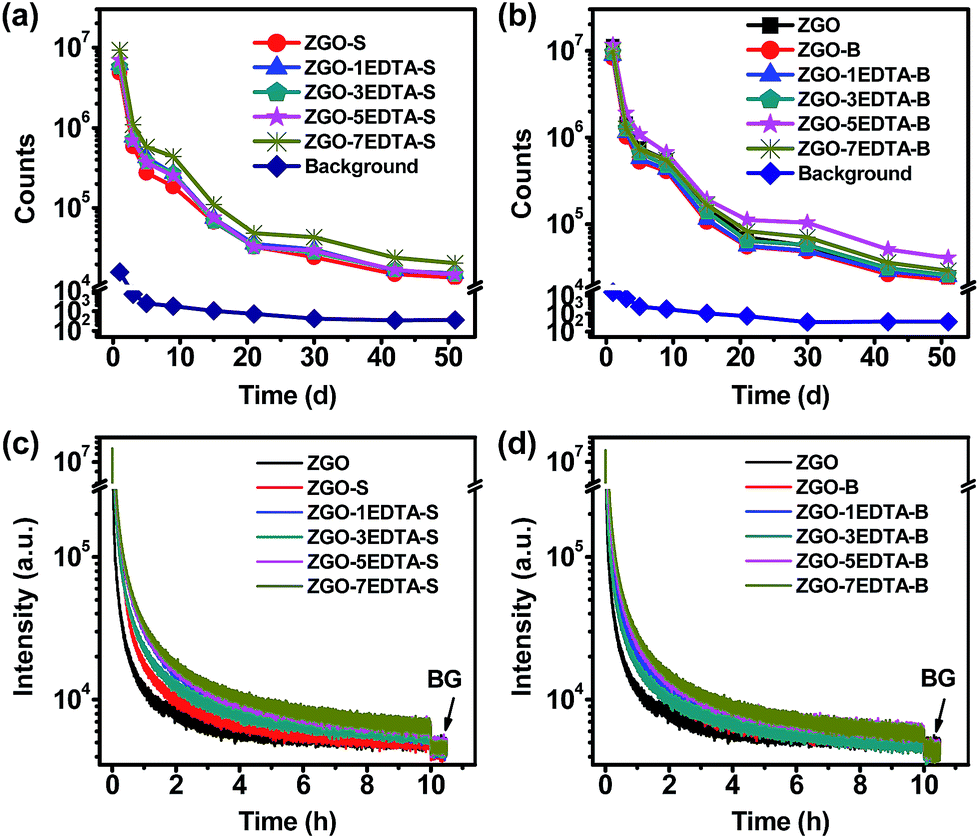 | ||
| Fig. 3 The afterglow decays of (a) solid ZGO-S and ZGO–nEDTA-S, (b) solid ZGO, ZGO-B and ZGO–nEDTA-B, (c) aqueous dispersions of ZGO, ZGO-S and ZGO–nEDTA-S and (d) aqueous dispersions of ZGO, ZGO-B and ZGO–nEDTA-B (n =1, 3, 5, 7). For (a) and (b), 3 mg of solid was irradiated by a 254 nm UV lamp (6 W) for 5 min, and the afterglow images and intensity were recorded using a CCD camera at different durations after stoppage of irradiation. For (c) and (d), 3 mL of 2 g L−1 aqueous dispersions was pre-lighted by a 254 nm UV lamp for 5 min and then was put into the sample holder immediately for recording the afterglow at 695 nm using a PTI fluorescence spectrophotometer. | ||
As many applications require using the aqueous dispersions, we measured the afterglow spectra (Fig. S1‡) and decays (Fig. 3c and d) of the aqueous dispersions of ZGO–nEDTA, ZGO-S, ZGO-B and ZGO using a fluorometer. As shown in Fig. S1,‡ ZGO–nEDTA (n = 1, 3, 5, 7) displays higher intensity in both PL and afterglow spectra. Furthermore, smaller size, better aqueous-dispersibility, and higher intensity are observed. More significant difference is observed in the afterglow intensity because the difference in aqueous-dispersibility is magnified when the aqueous suspensions are settled for longer time in measurements of afterglow spectra. Similarly, the afterglow decays of the aqueous dispersions measured using a fluorometer are mainly related to aqueous-dispersibility and not only the traps. ZGO–nEDTA has much better aqueous-dispersibility. Thus, all the aqueous dispersions of the small-sized ZGO–nEDTA display higher afterglow intensity than that of the large-sized ZGO during the decays (Fig. 3c and d), which is quite different from the results of the measurements in solid form (Fig. 3a and b). For the same reason, the aqueous dispersions of the ZGO–nEDTA-S have higher afterglow intensity than the corresponding ZGO–nEDTA-B. For the aqueous dispersions of S or B series, the more the EDTA used, the higher the afterglow intensity observed in afterglow decays. This elucidates the regulation role of EDTA in adjusting the size, aqueous-dispersibility and afterglows of ZGO–nEDTA. It is worth noting that the afterglows of aqueous dispersions of ZGO–nEDTA are higher than the background (BG) at 10 h.
The erosion mechanism
The sintering process greatly enhances the afterglows, but with the price of converting the primary powder into the hard-agglomerated particles via the formation of interparticle necks with different curvature and crystallinity degree.46 The erosion by EDTA prioritizes the dissolution of such interparticle necks between the agglomerated ZGO nanoparticles, and thus breaks the large particles down into the small ones. Moreover, EDTA etching drives some metals (mainly Ga and Zn) into the supernatants (Table 1 and S1‡), which results in further reduction of the size (Fig. 1), but without significant change in the spinel phase of ZnGa2O4 (JCPDS 38-1240, Fig. S9‡). As all Ga and Zn atoms were connected to several oxygen atoms, the departure of Ga and Zn inevitably takes away the linked oxygen atoms and thus generates some oxygen vacancies neighboring the remaining Ga and Zn sites on the resultant ZGO–nEDTA.To verify the oxygen vacancies generated by EDTA erosion, we compared the XPS (Fig. 4) and ESR spectra (Fig. 5) of ZGO and the typical ZGO–5EDTA. The symmetric peaks of Ga 2p3/2 (1117.5 eV) and Zn 2p3/2 (1021.2 eV) of ZGO suggest that the Ga3+ ions are located at the octahedral sites and Zn2+ ions are located at the tetrahedral sites47 (Fig. 4). The corresponding peaks of ZGO–5EDTA (both S and B) are still symmetric, but positively shift to around 1117.8 (Ga) and 1021.8 eV (Zn). Moreover, the O1S peak in ZGO is at 530.4 eV, but that in ZGO–5EDTA (both S and B) is observed at 531.0 eV. Similarly, the binding energy of Cr 2p3/2 is also enlarged in ZGO–5EDTA. These positively shifted binding energies of Ga, Zn, Cr and O in ZGO–5EDTA are ascribed to the neighboring electron-attracting oxygen vacancies.48 The extra tailing peaks at around 533 eV of ZGO–5EDTA are ascribed to the oxygen of the attached EDTA, which is in accordance with the results of zeta potentials (Fig. 1) and FT-IR (Fig. S4‡). Further calculations of the surface atomic concentration from XPS spectra reveal that ZGO has the ratio of Cr0.005:Zn0.365GaO2.00, while the atom ratios of ZGO–5EDTA-S and ZGO–5EDTA-B are Cr0.006:Zn0.438GaO1.85 and Cr0.006:Zn0.428GaO1.80, respectively. Compared with ZGO, the surface of ZGO–5EDTA has more Zn atoms (in according with Table 1), but less O atoms. All these XPS data prove that the ZGO–5EDTA nanoparticles (both B and S) have oxygen vacancies.
 | ||
| Fig. 4 XPS spectra of (a) Ga 2p3/2, (b) Zn 2p3/2, (c) Cr 2p3/2 and (d) O 1s of ZGO, ZGO–5EDTA-S and ZGO–5EDTA-B. | ||
 | ||
| Fig. 5 ESR spectra of ZGO, ZGO–5EDTA-S and ZGO–5EDTA-B. | ||
In ESR (Fig. 5), the signals near 3555 G ascribed to the Cr3+ ions in the undisturbed sites of ZnGa2O4 host49 are both observed in ZGO and ZGO–5EDTA, but ZGO–5EDTA shows the extra conspicuous broad peaks in the range of 2400–4000 G (the g-factor of the peak at 3560 G is 1.9745), which identify the existence of oxygen vacancies.50 These oxygen vacancies, related to the deep traps51 in TL (Fig. 2), are responsible for the maintained or enhanced afterglow of ZGO–nEDTA with reduced size, as discussed above.
Application in afterglow imaging in vivo
We examined the in vivo afterglow imaging and the corresponding biodistribution of ZGO and ZGO–5EDTA in normal mice (Fig. S10‡) and MCF-7 tumor-bearing mice (Fig. 6). The afterglow images with high SNR of both ZGO and ZGO–5EDTA are clearly detected without any external illuminations within 6 h. At 24 h, the afterglow images with high SNR were observed with the help of in vivo activation using a 650 nm LED for 1 min. For normal mice, a great difference in the biodistribution of ZGO–5EDTA and ZGO (Fig. S10‡) is observed because ZGO displays much higher existence in the lung and the spleen, while the ZGO–5EDTA has slightly higher existence in the liver. For MCF-7 tumor-bearing mice, the SNRs in the liver of the mice injected with ZGO and ZGO–5EDTA are very similar (54 vs. 56) at 3 h. However, the SNR in tumor of the mice injected with ZGO–5EDTA (26) is higher than that of the mice injected with ZGO (15). With passage of time, ZGO–5EDTA displays gradual accumulation in the tumor and gradual elimination in the liver. For example, at 6 h, the SNR in the tumor is 35, whereas the SNR in the liver is 17. At 24 h (the mice were in vivo activated using a 650 nm LED for 1 min), the SNR in the tumor is 1174, but the SNR in the liver is only 23. The SNR of the tumor and the liver of the mice injected with ZGO–5EDTA gradually increased with time. In contrast, the mice injected with ZGO exhibited gradually decreased SNR ratio in the tumor and the liver (at 3, 6 and 24 h, the ratio is 15/54, 3.7/21 and 4.2/171, respectively). The biodistribution of ZGO and ZGO–5EDTA in the organs and tumor at 24 h (Fig. 6c and d) was in accordance with the in vivo images (Fig. 6a and b). The vital biodistribution difference between the mice injected with ZGO–5EDTA and ZGO is most probably ascribed to the much smaller size and much better aqueous dispersibility of ZGO–5EDTA than ZGO,40 demonstrating the great superiority of ZGO–5EDTA in biological applications.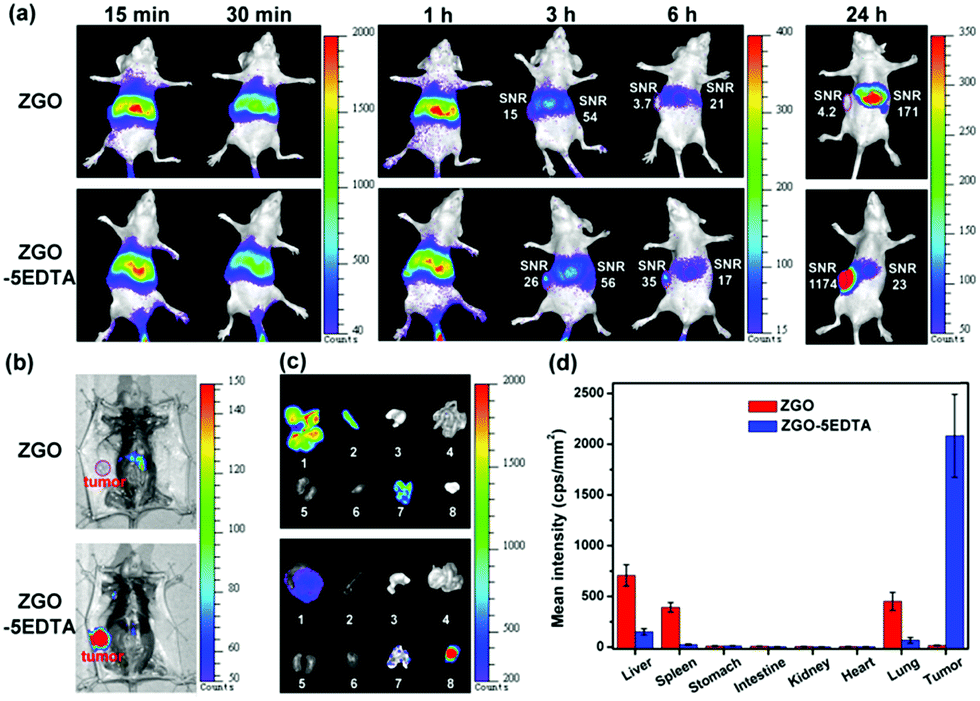 | ||
| Fig. 6 (a) Afterglow images of MCF-7 tumor-bearing mice after intravenous injection of ZGO and ZGO–5EDTA (0.1 mg, 5 min of irradiation using a 254 nm UV lamp before injection). (b) NIR afterglow images of the mice at 24 h in panel (a), without the superficial skin. (c) Representative afterglow images of isolated organs from the mice in panel (a): (1) liver, (2) spleen, (3) stomach, (4) intestine, (5) kidney, (6) heart, (7) lung, and (8) tumor. (d) Mean afterglow intensity of the organs in panel (c). | ||
Application in information storage
We also tested the potential application of ZGO and ZGO–5EDTA in information storage. The information (the heart shape and N K letters) was first restored by the photomask-protected illumination of 254 nm and then, the afterglow was read using a CCD camera. As shown in Fig. 7, both ZGO and ZGO–5EDTA display fine shapes at room temperature, but only ZGO–5EDTA with deep traps has a recognizable readout at a high temperature of 220 °C. These data further support the existence of deep traps in ZGO–5EDTA, and demonstrate that the ZGO–EDTA from EDTA etching has great potential for information storage. | ||
| Fig. 7 The information readout by ZGO and ZGO–5EDTA at RT and 220 °C. | ||
Conclusions
We present a novel and simple EDTA-etching strategy for regulating the traps, size and aqueous-dispersibility of ZGO–EDTA. The EDTA etching ability of the sintered ZGO results in effective reduction in size and great improvement in the aqueous-dispersibility. Moreover, EDTA etching alters the density of mediate traps and generates new deep traps, thus achieving massive production of (ultra)small ZGO–EDTA with fine aqueous-dispersibility and suitable mediate/deep traps. As EDTA can interact with most metals, this simple EDTA etching strategy would be prospectively applied to other PLNPs, and the resultant PLNPs–EDTA would find wide applications in biological field and information storage.Conflicts of interest
There are no conflicts to declare.Acknowledgements
The authors appreciate Dr Hongwu Zhang and Yanan Liu at Institute of Urban Environment, Chinese Academy of Sciences for help in TL measurements, and the support by the National Natural Science Foundation of China (No. 21575070 and 21435001), the Open Funds of the State Key Laboratory of Electroanalytical Chemistry (SKLEAC201805) and the Fundamental Research Funds for the Central Universities (China). All animal experiments were in accordance with the Guidelines for the Care and Use of Laboratory Animals of the Chinese Animal Welfare Committee and approved by the Institutional Animal Care and Use Committee, Nankai University Center for Animal Experiment, Tianjin, China.Notes and references
- Y. Li, M. Gecevicius and J. R. Qiu, Chem. Soc. Rev., 2016, 45, 2090–2136 RSC.
- T. Lecuyer, E. Teston, G. Ramirez-Garcia, T. Maldiney, B. Viana, J. Seguin, N. Mignet, D. Scherman and C. Richard, Theranostics, 2016, 6, 2488–2524 CrossRef CAS PubMed.
- S. K. Singh, RSC Adv., 2014, 4, 58674–58698 RSC.
- J. Wang, Q. Q. Ma, Y. Q. Wang, H. J. Shen and Q. Yuan, Nanoscale, 2017, 9, 6204–6218 RSC.
- S.-K. Sun, H.-F. Wang and X.-P. Yan, Acc. Chem. Res., 2018, 51, 1131–1143 CrossRef CAS PubMed.
- L.-J. Chen, S.-K. Sun, Y. Wang, C.-X. Yang, S.-Q. Wu and X.-P. Yan, ACS Appl. Mater. Interfaces, 2016, 8, 32667–32674 CrossRef CAS PubMed.
- Z. Zhou, W. Zheng, J. Kong, Y. Liu, P. Huang, S. Zhou, Z. Chen, J. Shi and X. Chen, Nanoscale, 2017, 9, 6846–6853 RSC.
- B.-Y. Wu, H.-F. Wang, J.-T. Chen and X.-P. Yan, J. Am. Chem. Soc., 2011, 133, 686–688 CrossRef CAS PubMed.
- B.-Y. Wu and X.-P. Yan, Chem. Commun., 2015, 51, 3903–3906 RSC.
- N. Li, Y. H. Li, Y. Y. Han, W. Pan, T. T. Zhang and B. Tang, Anal. Chem., 2014, 86, 3924–3930 CrossRef CAS PubMed.
- A. Abdukayum, J.-T. Chen, Q. Zhao and X.-P. Yan, J. Am. Chem. Soc., 2013, 135, 14125–14133 CrossRef CAS PubMed.
- Y.-J. Li and X.-P. Yan, Nanoscale, 2016, 8, 14965–14970 RSC.
- Y.-C. Lu, C.-X. Yang and X.-P. Yan, Nanoscale, 2015, 7, 17929–17937 RSC.
- H.-X. Zhao, C.-X. Yang and X.-P. Yan, Nanoscale, 2016, 8, 18987–18994 RSC.
- Z. Pan, Y.-Y. Lu and F. Liu, Nat. Mater., 2012, 11, 58–63 CrossRef CAS PubMed.
- T. Maldiney, A. Bessiere, J. Seguin, E. Teston, S. K. Sharma, B. Viana, A. J. J. Bos, P. Dorenbos, M. Bessodes, D. Gourier, D. Scherman and C. Richard, Nat. Mater., 2014, 13, 418–426 CrossRef CAS.
- A. Abdukayum, C.-X. Yang, Q. Zhao, J.-T. Chen, L.-X. Dong and X.-P. Yan, Anal. Chem., 2014, 86, 4096–4101 CrossRef CAS.
- S. Q. Wu, C. W. Chi, C. X. Yang and X. P. Yan, Anal. Chem., 2016, 88, 4114–4121 CrossRef CAS PubMed.
- Y.-J. Chuang, Z. Zhen, F. Zhang, F. Liu, J. P. Mishra, W. Tang, H. Chen, X. Huang, L. Wang, X. Chen, J. Xie and Z. Pan, Theranostics, 2014, 4, 1112–1122 CrossRef CAS PubMed.
- Z. Xue, X. Li, Y. Li, M. Jiang, G. Ren, H. Liu, S. Zeng and J. Hao, Nanoscale, 2017, 9, 7276–7283 RSC.
- S. K. Sharma, D. Gourier, E. Teston, D. Scherman, C. Richard and B. Viana, Opt. Mater., 2017, 63, 51–58 CrossRef CAS.
- F. Liu, W. Z. Yan, Y. J. Chuang, Z. P. Zhen, J. Xie and Z. W. Pan, Sci. Rep., 2013, 3, 1554 CrossRef PubMed.
- Z. Li, Y. Zhang, X. Wu, X. Wu, R. Maudgal, H. Zhang and G. Han, Adv. Sci., 2015, 2, 1500001 CrossRef PubMed.
- Y. Li, S. Zhou, Y. Li, K. Sharafudeen, Z. Ma, G. Dong, M. Peng and J. Qiu, J. Mater. Chem. C, 2014, 2, 2657–2663 RSC.
- T. Maldiney, B.-T. Doan, D. Alloyeau, M. Bessodes, D. Scherman and C. Richard, Adv. Funct. Mater., 2015, 25, 331–338 CrossRef CAS.
- E. Teston, Y. Lalatonne, D. Elgrabli, G. Autret, L. Motte, F. Gazeau, D. Scherman, O. Clement, C. Richard and T. Maldiney, Small, 2015, 11, 2696–2704 CrossRef CAS PubMed.
- Y. Wang, C.-X. Yang and X.-P. Yan, Nanoscale, 2017, 9, 9049–9055 RSC.
- L. Song, X. H. Lin, X. R. Song, S. Chen, X. F. Chen, J. Li and H. H. Yang, Nanoscale, 2017, 9, 2718–2722 RSC.
- J. Shi, X. Sun, J. Li, H. Man, J. Shen, Y. Yu and H. Zhang, Biomaterials, 2015, 37, 260–270 CrossRef CAS PubMed.
- T. Maldiney, B. Ballet, M. Bessodes, D. Scherman and C. Richard, Nanoscale, 2014, 6, 13970–13976 RSC.
- L.-J. Chen, C.-X. Yang and X.-P. Yan, Anal. Chem., 2017, 89, 6936–6939 CrossRef CAS PubMed.
- B. Zheng, H.-B. Chen, P.-Q. Zhao, H.-Z. Pan, X.-L. Wu, X.-Q. Gong, H.-J. Wang and J. Chang, ACS Appl. Mater. Interfaces, 2016, 8, 21603–21611 CrossRef CAS PubMed.
- S.-Q. Wu, C.-X. Yang and X.-P. Yan, Adv. Funct. Mater., 2017, 27, 1604992 CrossRef.
- R. Abdurahman, C.-X. Yang and X.-P. Yan, Chem. Commun., 2016, 52, 13303–13306 RSC.
- J. Shi, X. Sun, S. Zheng, J. Li, X. Fu and H. Zhang, Biomaterials, 2018, 152, 15–23 CrossRef CAS PubMed.
- Y.-J. Li, C.-X. Yang and X.-P. Yan, Anal. Chem., 2018, 90, 4188–4195 CrossRef CAS PubMed.
- Y. Zhuang, Y. Lv, L. Wang, W. Chen, T.-L. Zhou, T. Takeda, N. Hirosaki and R.-J. Xie, ACS Appl. Mater. Interfaces, 2018, 10, 1854–1864 CrossRef CAS PubMed.
- Y. Zhuang, L. Wang, Y. Lv, T.-L. Zhou and R.-J. Xie, Adv. Funct. Mater., 2018, 28, 1705769 CrossRef.
- X. Xu, L. Yan, X. Yu, H. Yu, T. Jiang, Q. Jiao and J. Qiu, Mater. Lett., 2013, 99, 158–160 CrossRef CAS.
- T. Maldiney, C. Richard, J. Seguin, N. Wattier, M. Bessodes and D. Scherman, ACS Nano, 2011, 5, 854–862 CrossRef CAS PubMed.
- Z. Li, Y. Zhang, X. Wu, L. Huang, D. Li, W. Fan and G. Han, J. Am. Chem. Soc., 2015, 137, 5304–5307 CrossRef CAS PubMed.
- J. P. Shi, X. Sun, J. F. Zhu, J. L. Li and H. Zhang, Nanoscale, 2016, 8, 9798–9804 RSC.
- B. B. Srivastava, A. Kuang and Y. Mao, Chem. Commun., 2015, 51, 7372–7375 RSC.
- E. Teston, S. Richard, T. Maldiney, N. Lievre, G. Y. Wang, L. Motte, C. Richard and Y. Lalatonne, Chem.–Eur. J., 2015, 21, 7350–7354 CrossRef CAS PubMed.
- A. Bessiere, S. K. Sharma, N. Basavaraju, K. R. Priolkar, L. Binet, B. Viana, A. J. J. Bos, T. Maldiney, C. Richard, D. Scherman and D. Gourier, Chem. Mater., 2014, 26, 1365–1373 CrossRef CAS.
- S. P. Yeap, Powder Technol., 2018, 323, 51–59 CrossRef CAS.
- Y. Yuan, W. Du and X. Qian, J. Mater. Chem., 2012, 22, 653–659 RSC.
- M. Xing, J. Zhang, F. Chen and B. Tian, Chem. Commun., 2011, 47, 4947–4949 RSC.
- D. Gourier, A. Bessiere, S. K. Sharma, L. Binet, B. Viana, N. Basavaraju and K. R. Priolkar, J. Phys. Chem. Solids, 2014, 75, 826–837 CrossRef CAS.
- J. S. Kim, H. I. Kang, W. N. Kim, J. I. Kim, J. C. Choi, H. L. Park, G. C. Kim, T. W. Kim, Y. H. Hwang, S. I. Mho, M. C. Jung and M. Han, Appl. Phys. Lett., 2003, 82, 2029–2031 CrossRef CAS.
- J. Su, S. Ye, X. Yi, F. Q. Lu, X. B. Yang and Q. Y. Zhang, Opt. Mater. Express, 2017, 7, 734–743 CrossRef CAS.
Footnotes |
| † This article is dedicated to the 100th anniversary of Nankai University. |
| ‡ Electronic supplementary information (ESI) available. See DOI: 10.1039/c8sc04173c |
| This journal is © The Royal Society of Chemistry 2018 |