 Open Access Article
Creative Commons Attribution 3.0 Unported Licence
In situ generation of photoactivatable aggregation-induced emission probes for organelle-specific imaging†
Shiwu
Li
ab,
Xia
Ling
a,
Yuhan
Lin
a,
Anjun
Qin
 a,
Meng
Gao
 *c and
Ben Zhong
Tang
 *ad
*ad
aGuangdong Innovative Research Team, Center for Aggregation-Induced Emission, State Key Laboratory of Luminescent Materials & Devices, South China University of Technology, Guangzhou 510640, China
bSchool of Medicine, South China University of Technology, Guangzhou 510006, China
cNational Engineering Research Center for Tissue Restoration and Reconstruction, South China University of Technology, Guangzhou 510006, China. E-mail: msmgao@scut.edu.cn
dDepartment of Chemistry, Hong Kong Branch of Chinese National Engineering Research Center for Tissue Restoration and Reconstruction, The Hong Kong University of Science & Technology, Clear Water Bay, Kowloon, Hong Kong, China. E-mail: tangbenz@ust.hk
First published on 1st June 2018
Abstract
Photoactivatable fluorescent probes are ideal tools for organelle study with a significant advantage of high spatiotemporal resolution. However, conventional photo-caged fluorophores for organelle-specific imaging suffer from several drawbacks, such as aggregation-caused quenching (ACQ), instability under ambient light, low photoactivation efficiency, and toxic photo-cleavage byproducts. Herein, we propose a strategy for in situ generation of photoactivatable aggregation-induced emission (AIE) probes of 2-(2-hydroxyphenyl)-benzothiazolines from easily available disulfide and thiol substrates through tandem S–S bond reduction and intramolecular cyclization reaction. Because the photoactivatable AIE probes can be in situ generated in a quantitative yield, they can be directly used for bio-imaging without complicated separation steps. Under both one- and NIR two-photon irradiation, excellent spatiotemporal resolution and high photoactivation efficiency were achieved for specific imaging of lipid droplets and lysosomes, respectively. Based on their in situ generation and adjustable organelle-targeting ability, the photoactivatable AIE probes could become an easy-to-use imaging tool in the study of the biological functions of organelles.
Introduction
The intracellular locations and motilities of organelles are closely related to their biological functions.1 It's thus highly desirable to track organelle distribution and movement within living cells to reveal their functions in different biological processes.2 To date, many “always-on” fluorescent probes have been reported for organelle-specific imaging, but the lack of spatiotemporal controlling ability has seriously restricted their applications.3 In contrast, photoactivatable fluorescent probes can transform from a non-emissive state to a highly emissive state under light irradiation with high spatiotemporal resolution, making them powerful imaging tools for organelle study.4 In the past few years, a series of caged proteins and fluorophores have been developed for photoactivatable imaging;5 however, they suffer from several drawbacks in terms of difficult synthesis, low photoactivation efficiency, inadvertent activation under ambient light, and generation of photocleavage toxic byproducts.6 Moreover, conventional fluorophores can easily undergo serious self-quenching after accumulation in organelles, which further restricts their application in organelle study.7Recently, aggregation-induced emission (AIE) has been proposed as a fundamental solution to tackle the challenge of fluorescence self-quenching.8 Based on their unique advantages of high brightness in the aggregate state, strong photostability, and low cytotoxicity,9 AIE-active probes have found broad applications in bio-imaging and sensing.10 Recently, several photoactivatable or photoswitchable AIE fluorogens (AIEgens) have been developed, including tetraphenylethene, cyanostilbene, dihydro-2-azafluorenone, and distyrylanthracene derivatives.11 However, these AIEgens need several synthetic steps for preparation and tedious column chromatography procedures for separation. To make photoactivatable probes easy-to-use for organelle study, the following requirements need be satisfied: (1) the photoactivatable probes should be in situ generated in a quantitative yield from easily available substrates and directly used for bio-imaging without complicated separation steps; (2) the targeting groups for different organelles should be easily introduced; (3) the photoactivation process should be conducted under NIR two-photon irradiation to reduce the photodamage effect and guarantee high spatiotemporal resolution; and (4) the fluorescence self-quenching effect for organelle imaging should be overcome.
Herein, we unexpectedly found that bis(2-(2-hydroxybenzylidene)amino)aryl disulfides 1 and ethyl mercaptoacetate can easily undergo S–S bond reduction to afford Schiff base intermediate 2, which then underwent intramolecular cyclization reaction to in situ quantitatively generate 2-(2-hydroxyphenyl)-benzothiazolines 3. Compounds 3 can further undergo photooxidative dehydrogenation reaction to afford the AIE-active compound 2-(2-hydroxyphenyl)-benzothiazoles 4 under both one- and two-photon irradiation (Scheme 1). The in situ generated compounds 3 with a methoxy or morpholinomethyl substituent can be respectively used for photoactivatable imaging of lipid droplets (LDs) and lysosomes with high specificity and excellent photoactivation efficiency. Because the disulfide and thiol substrates are easily available and the photoactivatable probes 3 could be in situ generated in a quantitative yield, they would be easy-to-use tools for organelle study.
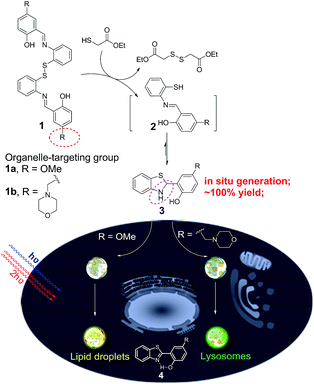 | ||
| Scheme 1 The in situ generation of photoactivatable AIE probe 3 for specific imaging of lipid droplets and lysosomes. | ||
Experimental section
The in situ preparation of photoactivatable AIE probe 3
Disulfide 1 and ethyl mercaptoacetate were first dissolved in DMSO solutions at a concentration of 10 mM and 20 mM, respectively. Their DMSO solutions were then mixed with an equal volume (100 μL) to in situ generate the photoactivatable probe 3 (10 mM, 200 μL) in a quantitative yield within 5 min.Cell culture
HeLa and MCF-7 cells were cultured in DMEM containing 1% penicillin–streptomycin and 10% FBS at 37 °C in a humid atmosphere with 5% CO2.Photoactivatable imaging of lipid droplets
The HeLa or MCF-7 cells were first treated with oleic acid (50 μM) for 6 h to induce the formation of lipid droplets. The cell culture medium was removed and the cells were washed twice with HBSS buffer. Then the in situ generated compound 3a in DMSO solution (5.0 μL, 10 mM) was directly added into the HBSS buffer (1.0 mL) and incubated with the cells for 5 min. Fluorescence images were then taken under a confocal microscope through continuous irradiation at 405 nm with 10% laser power, λem = 500–700 nm.Photoactivatable imaging of lysosomes
The in situ generated compound 3b in DMSO solution (2.0 μL, 10 mM) was directly added into the HBSS buffer (1.0 mL) and incubated with the cells for 5 min. Fluorescence images were then taken under a confocal microscope through continuous irradiation at 405 nm with 5% laser power, λem = 450–657 nm.Colocalization experiment
For co-staining of compound 3a and BODIPY493/503 Green, the HeLa or MCF-7 cells in HBSS buffer were first incubated with BODIPY493/503 Green (1.0 μg mL−1) for 10 min and then incubated with 3a (50 μM) for 5 min. The fluorescence images of 3a after photoactivation were taken with λex = 405 nm and λem = 550–700 nm. For BODIPY493/503 Green, λex = 488 nm and λem = 500–550 nm.For co-staining of compound 3b and LysoTracker Red, the HeLa or MCF-7 cells in HBSS buffer were first incubated with 3b (20 μM) for 5 min and then incubated with LysoTracker Red (100 nM) for 5 min. The fluorescence images of 3b after photoactivation were taken with λex = 405 nm and λem = 410–539 nm. For LysoTracker Red, λex = 543 nm and λem = 576–657 nm.
Photoactivatable imaging under two-photon irradiation
The HeLa or MCF-7 cells stained with the in situ generated 3 were irradiated in a bleach model with a two-photon femtosecond laser at 780 nm (1.0% power). The emission filter was 575–630 nm and 495–540 nm for 3a and 3b, respectively.Spatiotemporal imaging with two-photon irradiation
The fluorescence image of multi-cells was first taken under two-photon irradiation (780 nm, 0.5% laser power). The selected cells were then continuously irradiated with a bleaching model (780 nm, 1.0% laser power) to activate fluorescence. Then, the whole observation window of multi-cells was imaged. This process was repeated to light-up all the selected cells. The emission filter was 575–630 nm and 495–540 nm for 3a and 3b, respectively.Results and discussion
Compounds 1, 3, and 4 can be easily prepared by condensation or cyclization reaction between 2-hydroxybenzaldehyde derivatives and 2,2′-disulfanediyldianiline or 2-aminobenzenethiol (for detailed synthetic procedures, see Scheme S1†).12 The structures of all these compounds were unambiguously verified by NMR and HRMS analysis (Fig. S1–S6†).The AIE properties of compounds 4 were first investigated. For 4-methoxy-substituted compound 4a, a weak “enol” emission at 404 nm was observed in THF solution, while a strong “keto” emission at 570 nm was observed in the solid state (Fig. S7†). Compared with the THF solution, the fluorescence quantum yield and lifetime of 4a showed a 33.4-fold increase from 1.2 to 40.1% and a 5.2-fold increase from 0.94 to 4.88 ns, respectively (Table S1†). For 4-morpholinomethyl-substituted compound 4b, a weak “enol” emission at 446 nm in THF solution and a strong “keto” emission at 523 nm in the solid state were observed. The fluorescence quantum yield and lifetime of 4b respectively showed a 25.8-fold increase from 1.1% to 28.4% and a 4.1-fold increase from 1.56 to 6.39 ns (Table S1†). The AIE properties of compounds 4 can be ascribed to the synergistic effects of restriction of intramolecular motion (RIM) and excited state intramolecular proton transfer (ESIPT) mechanisms.13 The excellent “keto” emission efficiency of compounds 4 in the aggregate state with large Stokes shifts (up to 208 nm) would greatly favor their bio-imaging applications.
We then investigated the in situ generation ability of compounds 3. To our satisfaction, a quantitative transformation to 3 was achieved by a simple mixing of the DMSO solutions of disulfides 1 and ethyl mercaptoacetate within 5 min. This quantitative transformation was clearly verified by the NMR analysis of the reaction mixtures. As shown in Fig. 1, the O–Ha and C–Hb peaks of 1a at 12.0 and 9.0 ppm completely disappeared after reaction with ethyl mercaptoacetate, and new O–Ha′ and C–Hb′ peaks appeared at 9.4 and 6.4 ppm, which overlap well with the purified compound 3a. Meanwhile, the ethyl mercaptoacetate was oxidized to diethyl 2,2′-disulfanediyldiacetate (Fig. S8†). The in situ generation of compound 3a was also verified by UV-Vis absorption measurements. The main absorption peak of 1a at 380 nm disappeared after reaction with ethyl mercaptoacetate, and a new absorption peak at 309 nm was observed, which overlaps well with the absorption spectrum of purified compound 3a (Fig. S9†). Similarly, 3b could also be in situ generated in a quantitative yield by the simple mixing of 1b and ethyl mercaptoacetate in DMSO solution (Fig. S10†). The quantitative transformation to compound 3 was also verified by the HPLC experiment (Fig. S11†).
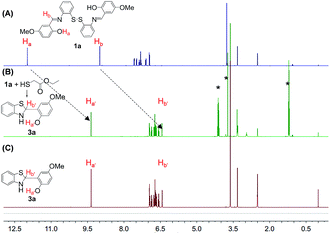 | ||
| Fig. 1 The 1H NMR stacking spectra of (A) 1a, (B) “1a + ethyl thioglycolate”, and (C) purified 3a (* represents diethyl 2,2′-disulfanediyldiacetate). | ||
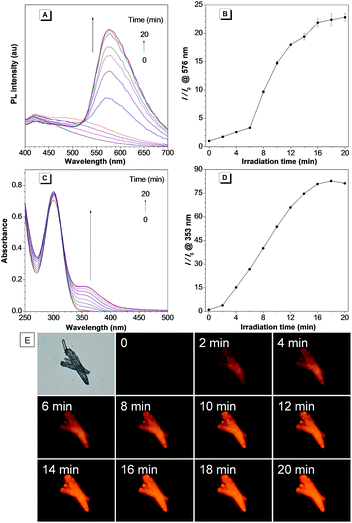
The photoactivation ability of the in situ generated compound 3 was then investigated. Under UV irradiation at 365 nm, the PL intensity of the in situ generated 3a increased quickly with a maximum emission wavelength at 576 nm (Fig. 2A and B). Meanwhile, the absorption intensity of 3a at 353 nm also increased rapidly (Fig. 2C and D). The PL and UV-Vis spectral changes can be attributed to the generation of compound 4a through photooxidative dehydrogenation of the C–N single bond to a C![[double bond, length as m-dash]](https://www.rsc.org/images/entities/char_e001.gif) N double bond. The 1H NMR spectral analysis further verified the photooxidative dehydrogenation transformation by disappearance of the hydrogen peaks of the C–N single bond (Fig. S12†). Moreover, a gradual light-up fluorescence was observed for compound 3a in the solid state under UV irradiation (365 nm), which suggests that the photooxidative dehydrogenation reaction can also smoothly proceed in the aggregate or solid state (Fig. 2E). Compound 3b can also smoothly undergo photooxidative dehydrogenation reaction to efficiently afford the AIE-active compound 4b both in solution and in the solid state (Fig. S13–S15†).
N double bond. The 1H NMR spectral analysis further verified the photooxidative dehydrogenation transformation by disappearance of the hydrogen peaks of the C–N single bond (Fig. S12†). Moreover, a gradual light-up fluorescence was observed for compound 3a in the solid state under UV irradiation (365 nm), which suggests that the photooxidative dehydrogenation reaction can also smoothly proceed in the aggregate or solid state (Fig. 2E). Compound 3b can also smoothly undergo photooxidative dehydrogenation reaction to efficiently afford the AIE-active compound 4b both in solution and in the solid state (Fig. S13–S15†).
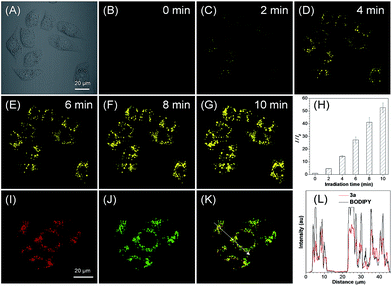
The cytotoxicities of ethyl mercaptoacetate and the in situ generated 2,2′-disulfanediyldiacetate and compounds 3 were then investigated based on MTT assay and no significant decrease in cell viability was observed for both HeLa and MCF-7 cells (Fig. S16–S19†). Because compounds 3 can be in situ generated in a quantitative yield, they were then directly used for the cell imaging experiment, which was conducted with HeLa cells as a model cell line. After incubation with the in situ generated 3a for 5 min, a fast light-up fluorescence was observed inside the cells under light irradiation at 405 nm, while almost no fluorescence was observed outside the cells even without washing (Fig. 3A–G). These results suggest that the in situ generated 3a can be quickly taken up by HeLa cells and the photooxidative dehydrogenation reaction can smoothly proceed inside the cells. Through statistical analysis of the intracellular fluorescence intensity, a nearly 53-fold light-up ratio was obtained (Fig. 3H). The PL spectrum of 3a after photoactivation overlaps well with the “keto” emission spectrum of compound 4a, which suggests the smooth proceeding of the ESIPT process after photoactivation (Fig. S20†). Furthermore, the co-localization experiment of photoactivated 3a with lipid dye BODIPY493/503 Green showed a high overlap coefficient of 0.89, which suggests that the probe could selectively accumulate in LDs (Fig. 3I–K and S21A†). Moreover, the intensity profile of photoactivated 3a and BODIPY493/503 showed a close synchrony for the region of interest (ROI) line across HeLa cells (Fig. 3L), which further verified the specific targeting ability of 3a for LDs.
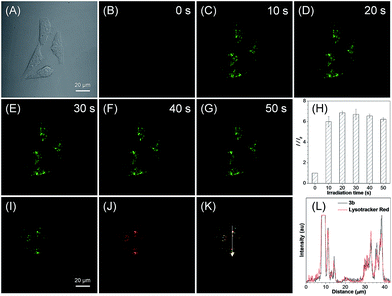
For the in situ generated compound 3b, a very fast light-up fluorescence within 20 s and a more than 6-fold light-up ratio was observed for HeLa cells under light irradiation at 405 nm (Fig. 4A–G). The co-staining experiment of photoactivated 3b with LysoTracker Red showed a high overlap coefficient of 0.86 and an excellent signal synchrony for the ROI line across the cells (Fig. 4I–L and S21B†). These results suggest that the in situ generated 3b with a basic morpholine group could be used for photoactivatable imaging of acidic lysosomes with high specificity. To further verify the organelle-specific imaging ability of the in situ generated 3, the cell imaging experiment was then conducted for MCF-7 cells. A high light-up ratio of 18-fold was observed for 3a and an excellent overlap coefficient of 0.93 was observed with BODIPY493/503 Green (Fig. S22†). Meanwhile, a 4-fold light-up ratio was observed for 3b and a high overlap coefficient of 0.88 was observed with LysoTracker Red (Fig. S23†). These results further verified the organelle-specific targeting ability and high photoactivation efficiency of the in situ generated compound 3.
To reduce the photo-damage effect of one-photon UV irradiation, the photoactivatable imaging experiment was then investigated under two-photon irradiation at 780 nm. The time-lapse fluorescence images under two-photon irradiation showed a very fast light-up fluorescence within 45 s for both 3a and 3b (Fig. 5A and C and S24†). Based on the high spatial imaging resolution under two-photon irradiation, the photoactivation of LDs and lysosomes for selected cells was conducted in a multi-cellular environment. To our satisfaction, the selected cells can be sequentially photoactivated with high spatiotemporal resolution (Fig. 5B and D), which suggests that the photoactivatable probes 3 can be used for organelle study in a complex biological environment.
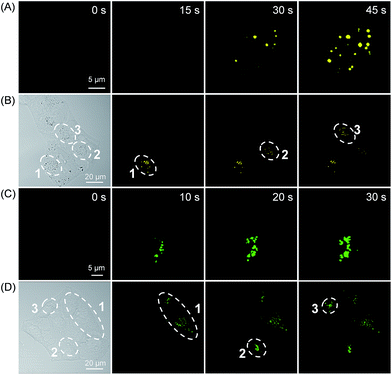 | ||
| Fig. 5 The temporal and spatial photoactivation of LDs (A and B) and lysosomes (C and D) in HeLa cells under two-photon irradiation at 780 nm. [3a] = 50 μM; [3b] = 20 μM. | ||
We also investigated the anti-interfering ability of compounds 3 from chemical oxidants. For both compounds 3a and 3b in aqueous solution, almost no fluorescence increase was observed even in the presence of H2O2 and NaClO (100 μM) for 2 h (Fig. S25†). Moreover, no fluorescence changes were observed for HeLa cells stained with 3 and further treated with H2O2 or NaClO (100 μM) for 1 h (Fig. S26†). In contrast, a fast light-up fluorescence within 30 s to 5 min was observed under light irradiation at 405 nm, which could thus efficiently preclude the interference of chemical oxidants for the photoactivation process.14
Conclusions
In conclusion, we have developed photoactivatable AIE probes for organelle-specific imaging through in situ quantitative generation from easily available disulfide and thiol substrates. The in situ generated AIE probes could be directly used for photoactivatable bio-imaging without tedious purification procedures. Based on the adjustable organelle-targeting ability and excellent photoactivation efficiency, high spatiotemporal resolution for photoactivatable imaging of LDs and lysosomes was respectively achieved under both one- and two-photon irradiation. Through avoiding complicated separation steps, the photoactivatable AIE probe could act as an easy-to-use imaging tool and is expected to have broad applications in biological study.Conflicts of interest
There are no conflicts to declare.Acknowledgements
This work was financially supported by the National Natural Science Foundation of China (21788102, 51620105009 and 21602063); the Science and Technology Planning Project of Guangzhou (201607020015 and 201704030069); the Pearl River S&T Nova Program of Guangzhou (201806010152); the Natural Science Foundation of Guangdong Province (2013A030313852 and 2013A030312002); the Fundamental Research Funds for the Central Universities (2015ZY013 and 2015ZZ104); the Innovation and Technology Commission of Hong Kong (ITC-CNERC14SC01); and the Guangdong Innovative Research Team Program (201101C0105067115).Notes and references
- M. Bornens, Nat. Rev. Mol. Cell Biol., 2008, 9, 874–886 CrossRef PubMed.
- (a) A. M. Valm, S. Cohen, W. R. Legant, J. Melunis, U. Hershberg, E. Wait, A. R. Cohen, M. W. Davidson, E. Betzig and J. Lippincott-Schwartz, Nature, 2017, 546, 162–167 CrossRef PubMed; (b) H. Zhu, J. Fan, J. Du and X. Peng, Acc. Chem. Res., 2016, 49, 2115–2126 CrossRef PubMed; (c) W. Xu, Z. Zeng, J.-H. Jiang, Y.-T. Chang and L. Yuan, Angew. Chem., Int. Ed., 2016, 55, 13658–13699 CrossRef PubMed; (d) L. Li, J. Ge, H. Wu, Q.-H. Xu and S. Q. Yao, J. Am. Chem. Soc., 2012, 134, 12157–12167 CrossRef PubMed.
- (a) The Molecular Probes Handbook, ed. I. Jonhson and M. T. Z. Spence, Invitrogen Corp., Carlsbad, 11th edn, 2010 Search PubMed; (b) D. B. Zorov, E. Kobrinsky, M. Juhaszova and S. J. Sollott, Circ. Res., 2004, 95, 239–252 CrossRef PubMed.
- F. M. Raymo, Phys. Chem. Chem. Phys., 2013, 15, 14840–14850 RSC.
- (a) F. Perez, Nature, 2015, 518, 41–42 CrossRef PubMed; (b) W. Watanabe, T. Shimada, S. Matsunaga, D. Kurihara, K. Fukui, S.-i. Arimura, N. Tsutsumi, K. Isobe and K. Itoh, Opt. Express, 2007, 15, 2490–2498 Search PubMed; (c) V. Adam, R. Berardozzi, M. Byrdin and D. Bourgeois, Curr. Opin. Chem. Biol., 2014, 20, 92–102 CrossRef PubMed; (d) M. N. Tran and D. M. Chenoweth, Angew. Chem., Int. Ed., 2015, 54, 6442–6446 CrossRef PubMed; (e) E. Lacivita, M. Leopoldo, F. Berardi, N. A. Colabufo and R. Perrone, Curr. Med. Chem., 2012, 19, 4731–4741 CrossRef PubMed; (f) M. Fernandez-Suarez and A. Y. Ting, Nat. Rev. Mol. Cell Biol., 2008, 9, 929–943 CrossRef PubMed.
- (a) V. Sharma and D. S. Lawrence, Angew. Chem., Int. Ed., 2009, 48, 7290–7292 CrossRef PubMed; (b) W. H. Li and G. Zheng, Photochem. Photobiol. Sci., 2012, 11, 460–471 RSC; (c) Y.-M. Guo, S. Chen, P. Shetty, G. Zheng, R. Lin and W.-h. Li, Nat. Methods, 2008, 5, 835–841 CrossRef PubMed; (d) D. Puliti, D. Warther, C. Orange, A. Specht and M. Goeldner, Bioorg. Med. Chem., 2011, 19, 1023–1029 CrossRef PubMed.
- (a) M. Huang, A. K. S. Camara, D. F. Stowe, F. Qi and D. A. Beard, Ann. Biomed. Eng., 2007, 35, 1276–1285 CrossRef PubMed; (b) A. Reisch and A. S. Klymchenko, Small, 2016, 12, 1968–1992 CrossRef PubMed; (c) Y. Hama, Y. Urano, Y. Koyama, M. Kamiya, M. Bernardo, R. S. Paik, I. S. Shin, C. H. Paik, P. L. Choyke and H. Kobayashi, Cancer Res., 2007, 67, 2791–2799 CrossRef PubMed.
- (a) Y. Hong, J. W. Lam and B. Z. Tang, Chem. Soc. Rev., 2011, 40, 5361–5388 RSC; (b) J. Mei, N. L. C. Leung, R. T. K. Kwok, J. W. Y. Lam and B. Z. Tang, Chem. Rev., 2015, 115, 11718–11940 CrossRef PubMed; (c) J. Mei, Y. Huang and H. Tian, ACS Appl. Mater. Interfaces, 2018, 10, 12217–12261 CrossRef PubMed; (d) C. Chen, Z. Song, X. Zheng, Z. He, B. Liu, X. Huang, D. Kong, D. Ding and B. Z. Tang, Chem. Sci., 2017, 8, 2191–2198 RSC; (e) J. Liu, C. Chen, S. Ji, Q. Liu, D. Ding, D. Zhao and B. Liu, Chem. Sci., 2017, 8, 2782–2789 RSC.
- (a) J. Qian and B. Z. Tang, Chem, 2017, 3, 56–91 CrossRef; (b) J. Liang, B. Z. Tang and B. Liu, Chem. Soc. Rev., 2015, 44, 2798–2811 RSC; (c) Y. Yuan, S. Xu, X. Cheng, X. Cai and B. Liu, Angew. Chem., Int. Ed., 2016, 55, 6457–6461 CrossRef PubMed; (d) C. Y. Y. Yu, H. Xu, S. Ji, R. T. K. Kwok, J. W. Y. Lam, X. Li, S. Krishnan, D. Ding and B. Z. Tang, Adv. Mater., 2017, 29, 1606167 CrossRef PubMed.
- (a) A. Shao, Y. Xie, S. Zhu, Z. Guo, S. Zhu, J. Guo, P. Shi, T. D. James, H. Tian and W. H. Zhu, Angew. Chem., Int. Ed., 2015, 54, 7275–7280 CrossRef PubMed; (b) S. Xie, A. Y. H. Wong, R. T. K. Kwok, Y. Li, H. Su, J. W. Y. Lam, S. Chen and B. Z. Tang, Angew. Chem., Int. Ed., 2018, 57, 5750–5753 CrossRef PubMed; (c) M. T. Gabr and F. C. Pigge, Mater. Chem. Front., 2017, 1, 1654–1661 RSC; (d) Q. Li and Z. Li, Sci. China: Chem., 2015, 58, 1800–1809 CrossRef; (e) Y. F. Wang, T. Zhang and X. J. Liang, Small, 2016, 12, 6451–6477 CrossRef PubMed.
- (a) M. Gao, H. Su, Y. Lin, X. Ling, S. Li, A. Qin and B. Z. Tang, Chem. Sci., 2017, 8, 1763–1768 RSC; (b) X. Gu, E. Zhao, T. Zhao, M. Kang, C. Gui, J. W. Y. Lam, S. Du, M. M. T. Loy and B. Z. Tang, Adv. Mater., 2016, 28, 5064–5071 CrossRef PubMed; (c) P. Wei, J.-X. Zhang, Z. Zhao, Y. Chen, X. He, M. Chen, J. Gong, H. H. Y. Sung, I. D. Williams, J. W. Y. Lam and B. Z. Tang, J. Am. Chem. Soc., 2018, 140, 1966–1975 CrossRef PubMed; (d) Q. Qi, C. Li, X. Liu, S. Jiang, Z. Xu, R. Lee, M. Zhu, B. Xu and W. Tian, J. Am. Chem. Soc., 2017, 139, 16036–16039 CrossRef PubMed; (e) Y. Zheng, X. Zheng, Y. Xiang and A. Tong, Chem. Commun., 2017, 53, 11130–11133 RSC.
- (a) M. Behpour, S. M. Ghoreishi, E. Honarmand and M. Salavati-Niasari, J. Electroanal. Chem., 2011, 653, 75–80 CrossRef; (b) K. Yamamoto, M. Fujita, K. Tabashi, Y. Kawashima, E. Kato, M. Oya, T. Iso and J. Iwao, J. Med. Chem., 1988, 31, 919–930 CrossRef PubMed; (c) H. Xu, H. Wang, Y. Yue, L. Chen, Y. Hao and B. Xu, Synth. Met., 2012, 162, 775–780 CrossRef.
- M. Gao, L. Wang, J. Chen, S. Li, G. Lu, L. Wang, Y. Wang, L. Ren, A. Qin and B. Z. Tang, Chem.–Eur. J., 2016, 22, 5107–5112 CrossRef PubMed.
- (a) Z. Wu, X. Wu, Z. Li, Y. Yang, J. Han and S. Han, Bioorg. Med. Chem. Lett., 2013, 23, 4354–4357 CrossRef PubMed; (b) P. Li, W. Zhang, K. Li, X. Liu, H. Xiao, W. Zhang and B. Tang, Anal. Chem., 2013, 85, 9877–9881 CrossRef PubMed.
Footnote |
| † Electronic supplementary information (ESI) available: Synthetic procedures, NMR spectra, photophysical characterization data, UV-Vis and PL spectra, cell imaging, and cell viability (PDF). See DOI: 10.1039/c8sc01887a |
| This journal is © The Royal Society of Chemistry 2018 |

