
 Open Access Article
 This Open Access Article is licensed under a Creative Commons Attribution-Non Commercial 3.0 Unported Licence
Near-infrared fluorescence probes to detect reactive oxygen species for keloid diagnosis†
Penghui
Cheng
a,
Jianjian
Zhang
ab,
Jiaguo
Huang
a,
Qingqing
Miao
a,
Chenjie
Xu
 a and
Kanyi
Pu
*a
a and
Kanyi
Pu
*a
aSchool of Chemical and Biomedical Engineering, Nanyang Technological University, 637457 Singapore. E-mail: kypu@ntu.edu.sg
bKey Laboratory of Synthetic and Natural Functional Molecule Chemistry of Ministry of Education, College of Chemistry and Materials Science, Northwest University, Xi'an, Shaanxi 710127, People's Republic of China
First published on 20th June 2018
Abstract
Development of molecular probes for the detection of reactive oxygen and nitrogen species (RONS) is important for the pathology and diagnosis of diseases. Although an abnormally high RONS level has been identified in keloids – a benign dermal tumour developed after lesion, the ability of employing RONS probes for keloid detection has not yet been exploited. Herein, we report two near-infrared (NIR) fluorescent probes (CyTF and CyBA) that can specifically distinguish keloid fibroblasts from normal dermal fibroblasts. Both CyTF and CyBA show a 15-fold NIR fluorescence enhancement at 717 nm upon reaction with RONS. However, because CyTF has higher specificity towards ONOO− than CyBA, CyTF can detect stimulated fibroblasts in a more sensitive way, showing 3.76 and 2.26-fold fluorescence increments in TGF-β1 stimulated dermal fibroblasts and keloid fibroblasts, respectively. Furthermore, CyTF permits specific detection of implanted keloid fibroblasts in a xenograft live mouse model. Our work thus developed a new optical imaging approach that has the potential for early diagnosis and drug screening of keloids.
Introduction
Reactive oxygen and nitrogen species (RONS) are essential to regulate normal physiological processes, while abnormally high levels of RONS are associated with pathogenesis. In addition to cancer, inflammation, cardiovascular diseases and organ fibrosis,1 an abnormally high cellular level of RONS production has been reported in chronic wound healing and keloid scars.2,3 Keloid is a type of tissue fibrosis after initial lesion with characteristics of excess collagen neoplasm and invasiveness into surrounding tissues, causing severe cosmetic problems, pruritus, and pain. The current treatments of keloid including surgical incision, radiation, pressure and laser therapy suffer from high recurrence rate, not to mention that radiation therapy has the risk of carcinogenesis.4 However, only a few diagnostic probes have been developed for keloids based on the overexpression of FAPα (fibroblast activation protein-alpha)5 and CTGF (connective tissue growth factor).6 In the scar formation process, an abnormal high RONS level could affect the processes of fibroblast epithelial to mesenchymal transition (EMT) required for ECM deposition,7 fibroblast migration and adhesion,8 and extra collagen deposition.9,10 Abnormal expressions of nuclear factor erythroid 2-related factor 2 (Nrf2),11 and fibrogenic cytokine transforming growth factor β (TGF-β)12,13 could account for this high RONS level. It yet still remains unclear which specific RONS plays a part in developing keloid pathogenesis. Thereby, understanding the molecular mechanism of RONS in keloid formation not only can provide useful information for early diagnosis of keloid but also may bring in new therapeutic interventions.As compared to other imaging modalities, optical imaging has the advantages of rapid detection with high-throughput capacity, high sensitivity with detection at molecular and cellular levels, and relatively low instrumentation costs.14 Molecular probes with high detection specificity and sensitivity have been readily developed for RONS such as O2˙−,15 H2O2,16 ONOO−,17–20 NO˙,21 HO˙,22 OCl− (ref. 23) and O3 (ref. 24) and have been summarized in a number of nice reviews.25–27 A natural extension of such efforts is the detection of RONS in living cells and living organisms with different disease models. Particularly, the development of near-infrared (NIR) probes have enabled deeper tissue penetration, minimized tissue auto-fluorescence and enhanced signal-to-noise ratios. These RONS probes have been successfully applied in the evaluation of drug-induced toxicity,28 ischemia-reperfusion,29 acute peritonitis inflammation30 and neuroinflammation31 models. However, optical molecular probes have not yet been used to study the role of RONS in keloids and to apply in its early diagnosis.
Here, we report the design and syntheses of two near-infrared (NIR) fluorescent activatable molecular probes for the detection of RONS in keloids. These two probes have different responses towards peroxynitrite (ONOO−) in terms of specificity (Scheme 1a). CyTF is designed by linking a trifluoromethyl ketone group to a NIR hemicyanine dye (CyOH), and it could undergo ONOO−-mediated oxidation in a highly-selective manner. The ketone unit forms a dioxirane intermediate, which selectively oxidizes the phenyl ring to afford a dienone product, releasing the caged oxygen atom.17,18 Meanwhile, CyBA is designed by conjugating a boronic acid-based self-immolative group to CyOH. The boronate reaction site is Lewis acidic, and strong Lewis bases like ONOO− and H2O2 could readily attack the boron atom, followed by aryl migration to oxygen and release of the boronate group. The self-immolative linker is then released through 1,4-immolation.19,20,32 Both CyTF and CyBA are non-fluorescent initially as the electron-donating oxygen atoms are caged by the ROS responsive group. After reaction with RONS, the caging groups are released, leading to free fluorescent CyOH. This characteristic fluorescence turn-on mechanism could be used to specifically distinguish keloid scar cells from normal dermal fibroblasts, where an abnormally high oxidative stress is reported (Scheme 1b).16
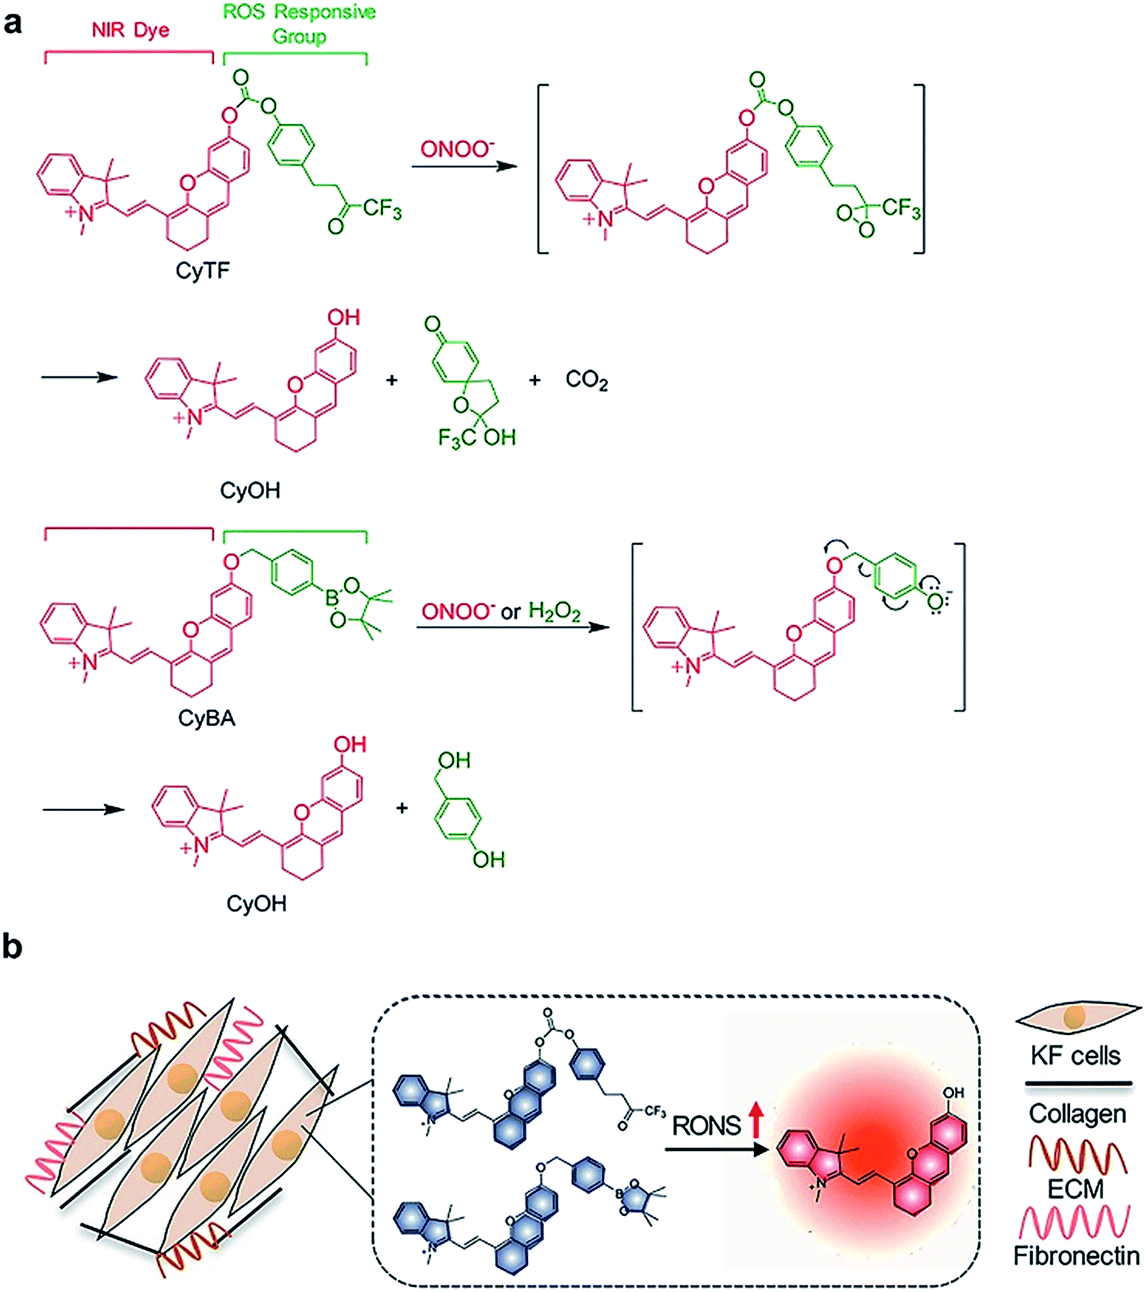 | ||
| Scheme 1 (a) Design and mechanism of CyTF and CyBA for RONS imaging. (b) Illustration of CyTF and CyBA activation in KF cells due to higher RONS levels. | ||
Results and discussion
Syntheses of CyTF and CyBA
The probes were synthesized according to Scheme 2. 3-(4-Methoxyphenyl)propanoic acid (compound 1) was reacted with ethanol to give compound 2. Compound 2 was then reacted with trimethyl(trifluoromethyl)silane to obtain compound 3, which was then reacted with tetra-n-butylammonium fluoride to obtain compound 4. Compound 4 was then reacted with boron tribromide to give compound 5. CyOH was synthesized by reacting IR775-chloride with resorcinol via a retro-Knoevenagel reaction. CyOH was then reacted with synthesized compound 5 or bromomethylphenylboronic acid pinacol ester by caging the oxygen atom to afford CyTF and CyBA, respectively. The structures of purified probes were confirmed by NMR and mass spectroscopy (ESI†).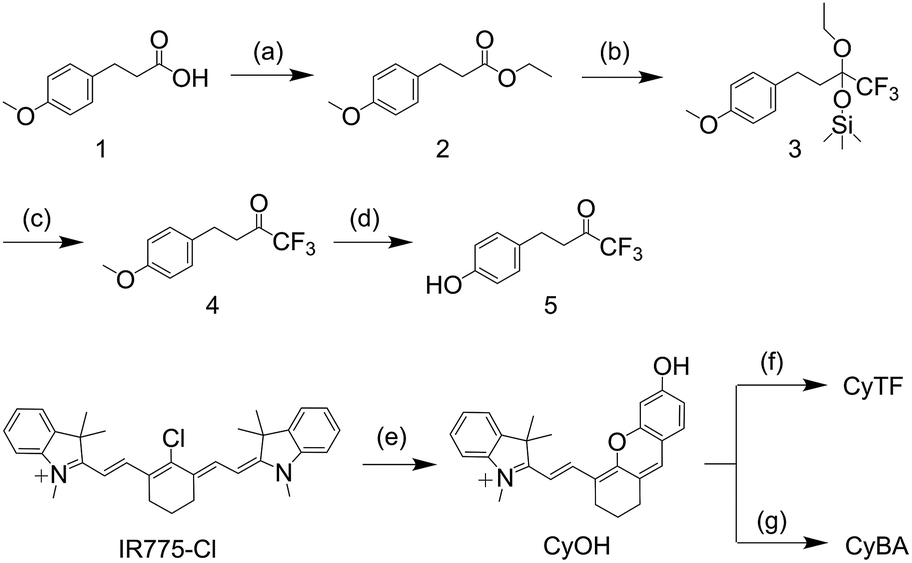 | ||
| Scheme 2 Synthetic route of CyTF and CyBA. (a) H2SO4 (con.), reflux, 4 h, EtOH, 97%; (b) TMSCF3, CsF, THF, 18 h, 86%; (c) TBAF, THF, 5 h, then 4 M HCl, 3 h, 97%; (d) BBr3, −78 °C, room temperature, 12 h, CH2Cl2, 74%; (e) K2CO3, resorcinol, CH3CN, 2 h; (f) 5, BTC, Et3N, 0 °C, 2 h, CH2Cl2, 28%; (g) 4-methylphenylboronic acid pinacol ester, K2CO3, CH3CN, 75%. | ||
In vitro sensing of RONS
To validate and compare the RONS sensing ability between CyTF and CyBA, their absorption and fluorescence spectra in the absence and presence of different RONS were measured (Fig. 1). | ||
| Fig. 1 UV-vis absorption spectra (a) and fluorescence (b) of CyTF or CyBA (20 μM) in the absence or presence of ONOO− (25 μM) at 25 °C in PBS (1×, pH = 7.4) containing 20% DMSO. Excitation: 640 nm. (c) High performance liquid chromatography (HPLC) traces of the incubation mixture of CyTF (c) and CyBA (d) in the absence (upper panel) or presence (middle panel) of ONOO− (25 μM), and HPLC traces of CyOH in water (lower panel). Wavelength: 600 nm. (e) Fluorescence titration of CyTF or CyBA (20 μM) as a function of ONOO− concentration. Each spectrum was recorded 5 min after addition of ONOO−. Regression equation for CyTF: FL = 1.07 × 10⁶ + 1.16 × 10⁶ [ONOO−] μM (R2 = 0.99); regression equation for CyBA: FL = 1.14 × 10⁶ + 1.27 × 10⁶ [ONOO−] μM (R2 = 0.99). (f) Fluorescence intensity of CyTF and CyBA in the presence of various RONS for 5 min in PBS (1×, pH = 7.4) containing 20% DMSO. Control represents assay buffer only. ONOO− was 25 μM, O2˙−, OCl−, ˙OH, and H2O2 were 50 μM. The incubation time for H2O2 was 2 hours. Error bars represent standard deviations of three separate measurements. | ||
Both CyTF and CyBA had two absorption peaks at 605 and 654 nm and were initially non-fluorescent; upon adding ONOO−, the absorption peak at 605 nm disappeared and a new peak at 690 nm – the fingerprint spectrum of free CyOH appeared.33 Such a cleavage led to fluorescence enhancement up to 15-fold at 717 nm (Fig. 1a and b).
High performance liquid chromatography (HPLC) and liquid chromatography mass spectroscopy (LCMS) further confirmed that CyTF (HPLC retention time, TR = 24 min) and CyBA (TR = 24.1 min) were totally converted into free CyOH (TR = 20.8 min) after incubation with ONOO− (Fig. 1c and d). In addition, a gradual increase in fluorescence intensity with ONOO− concentration could be observed, and linearity existed at concentrations ranging from 0–8 μM (Fig. 1e, S1†). Under such conditions, the limits of detection (LODs) for CyTF and CyBA were determined to be 89.4 and 71.7 nM, respectively (LOD = 3σ/s, σ: standard deviation of the blank, s: slope of the calibration curve).
The selectivity of CyTF and CyBA was tested against other RONS including O2˙−, OCl−, ˙OH, and H2O2. As expected, CyTF was highly specific towards ONOO−. However, CyBA showed responses to both ONOO− and H2O2 and the fluorescence enhancement for H2O2 was 5-fold (Fig. 1f). Moreover, the response rates of both CyTF and CyBA were tested by time-course fluorescence measurements (Fig. S2†). Upon addition of ONOO−, the fluorescence intensity of both probes at 717 nm increased drastically and reached a plateau in less than two minutes, indicating the rapid response of both probes to ONOO−. Thus, CyTF and CyBA showed similar fluorescence enhancement and kinetics upon adding ONOO−, yet CyBA showed poorer selectivity as it was responsive towards both ONOO− and H2O2.
Imaging of RONS in cells
After confirming the low cytotoxicity of CyTF and CyBA against living cells by MTS assay (Fig. S4†), these probes were used to detect endogenously generated RONS in cultured normal dermal fibroblasts (NDFs). NDFs without treatment served as control groups. NDFs treated with Transforming Growth Factor (TGF)-β1 alone were used as the positive control, whereas the cells treated with TGF-β1 along with a RONS scavenger (NAC: N-acetyl-L-cysteine) and the cells treated with NAC only were used as the negative control groups. All groups were then incubated with CyTF or CyBA for fluorescence imaging.As a whole, for control and negative control groups, weak fluorescence signals were observed for both CyTF and CyBA (Fig. 2a and b), indicating low RONS levels in NDFs. However, in the control group, CyBA had a slightly higher background signal than CyTF in the untreated cells (Fig. 2a). CyBA could react with both H2O2 and ONOO−, implying a higher basal level of H2O2 than ONOO− in untreated cells. This is reasonable because H2O2 is a less reactive and hence more stable oxidative species than ONOO−.34,35
 | ||
| Fig. 2 (a) Fluorescence microscopy of NDF cells incubated with CyTF or CyBA (10 μM, 30 min) before imaging; first panel: untreated cells; second panel: cells treated with TGF-β1 (36 h); third panel: cells pre-treated with NAC (2 h) before being treated with TGF-β1 (0.5 h), followed with NAC for 1 h; fourth panel: cells treated with NAC for 20 min. [TGF-β1] = 2.5 ng mL−1, [NAC] = 5 mM. Scale bars: 50 μm. (b) Quantification of fluorescence intensities of NDF cells after incubation with CyTF or CyBA in Fig. 2a, the fluorescence intensities were normalized by a total cell nuclei signal, and the values presented were relative to the control groups. Error bars represent standard deviations of three separate measurements. (c) Schematic illustration of TGF-β1 signalling and RONS generation in NDF cells. *p < 0.05, **n.s. | ||
After TGF-β1 stimulation, the fluorescence of both CyTF and CyBA dramatically increased, and the fluorescence enhancement for CyTF (3.76 fold) was 2.6-times higher than CyBA (1.43 fold) (Fig. 2a and b). The overall increased fluorescence signals after TGF-β1 stimulation were caused by the fact that a high concentration of cytokine TGF-β1 could induce an inflammatory response and in turn oxidative stress. Furthermore, upon NAC addition into these stimulated cells, the fluorescence level decreased to basal levels similar to those untreated cells (Fig. 2a and b), confirming the role of TGF-β1 in inducing oxidative stress.
The great fluorescence enhancement for CyTF and CyBA in TGF-β1 stimulated NDFs further implies that TGF-β1 could especially increase the intracellular ONOO− level. In the TGF-β1 signalling cascade (Fig. 2c), it first binds to and phosphorylates the transmembrane TGF-β type II receptor (TβRII), and then trans-phosphorylates the TGF-β type I receptor (TβRI). This subsequently activates Smad signalling proteins, which then translocate into the nucleus to interact with other transcription factors to regulate transcription pathways.36 In particular, TGF-β1 could increase the expressions of transmembrane proteins NADPH oxidase 4 (NOX4)37 and endothelial nitric oxide synthase (eNOS).38 eNOS generates nitric oxide, NO˙ from L-Arginine and the oxygen molecule; NOX4 produces superoxide anion, O2˙− from the oxygen molecule. The generated O2˙− could subsequently react with NO˙ to produce ONOO− (k ≈ 1010 M−1 s−1) or convert to H2O2 by enzyme superoxide dismutase (k ≈ 109 M−1 s−1).35 As both reactants O2˙− and NO˙ have high intracellular levels, and the reaction producing ONOO− is more kinetically favoured, the level of ONOO− should be higher than H2O2 in TGF-β1 stimulated NDFs (Fig. 2c).
The NIR probes were then applied to detect keloid-derived fibroblasts (KFs) in culture, with NDFs as control groups. Compared with low basal fluorescence levels in NDFs, both probes incubated in untreated KFs had shown enhanced fluorescence levels. The fluorescence enhancement in CyTF (2.26-fold) was 1.5-times higher than CyBA (1.5-fold) due to a higher background level of H2O2 as explained earlier (Fig. 3a and b). However, when KFs were further treated with a selective TβR1 inhibitor (RepSox),39 the fluorescence levels for both probes decreased to a large extent, suggesting the role of TGF-β1 signalling in causing keloid oxidative stress. As a result, by targeting the TGF-β1 signalling pathway, keloid therapeutic drugs like RepSox could be developed.
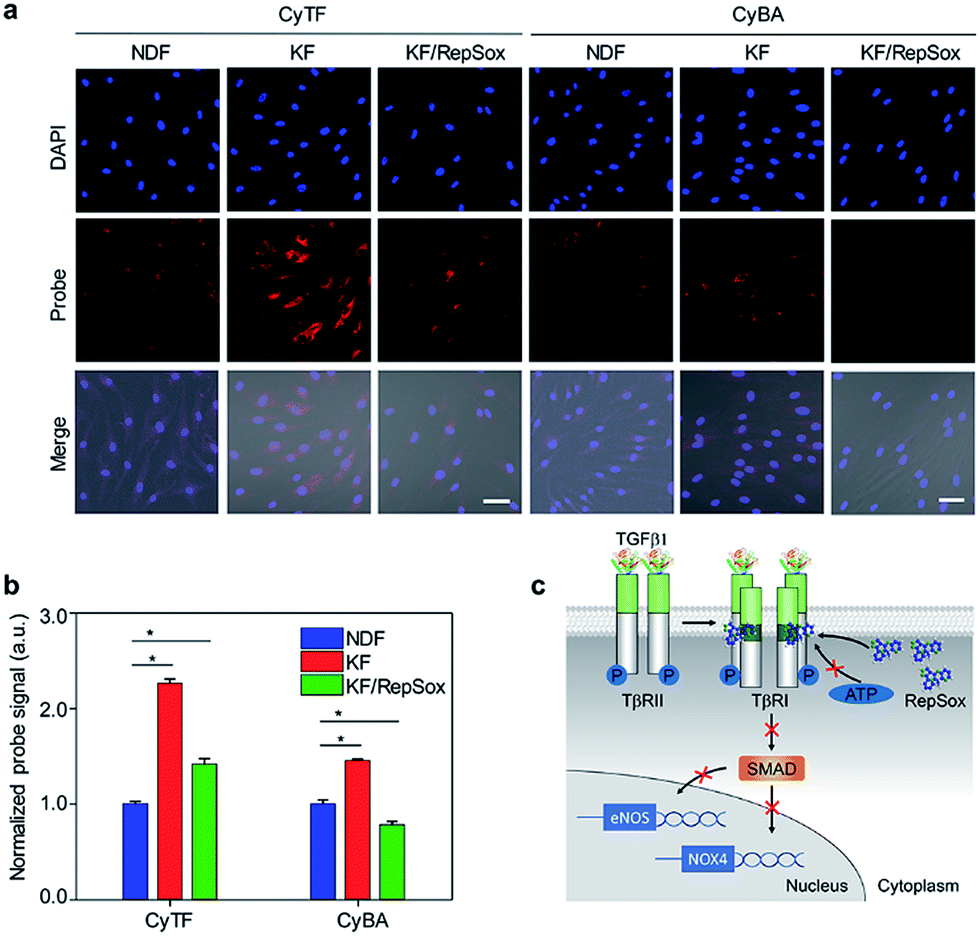 | ||
| Fig. 3 (a) Fluorescence microscopy of NDF, KF and KF cells treated with RepSox incubated with CyTF or CyBA (10 μM, 30 min) before imaging, [RepSox] = 25 μM. Scale bars: 50 μm. (b) Quantification of fluorescence intensities of NDF cells after incubation with CyTF or CyBA as shown in Fig. 3a, the fluorescence intensities were normalized by the total cell nuclei signal, and values presented were relative to the control groups. Error bars represent standard deviations of three separate measurements. (c) Schematic illustration of the RepSox inhibiting TGF-β type 1 receptor signalling pathway in KF cells. *p < 0.05. | ||
An uncontrolled TGF-β1 signalling was found in keloid pathogenesis, originating from both overproduction of the cytokine itself and higher expression levels of TβRI & TβRII in keloid cells.3 Specifically, the distinguishable fluorescence enhancement from CyTF had demonstrated a much higher ONOO− level in KF cells. When RepSox was subsequently added to inhibit TGF-β1 signalling by blocking TβRII trans-phosphorylation, the intracellular ONOO− level was reduced (Fig. 3c).
Hence, ONOO− could become a specific biomarker for keloid disease, and CyTF has the potential to be applied in early diagnosis. Furthermore, identifying the significance of TGF-β1 signalling in keloid pathogenesis has made developing TGF-β signalling pathway-targeting drug treatment towards keloid disease plausible. By targeting the intracellular ONOO− level, CyTF could also become a potent drug screener.
In vivo keloid imaging
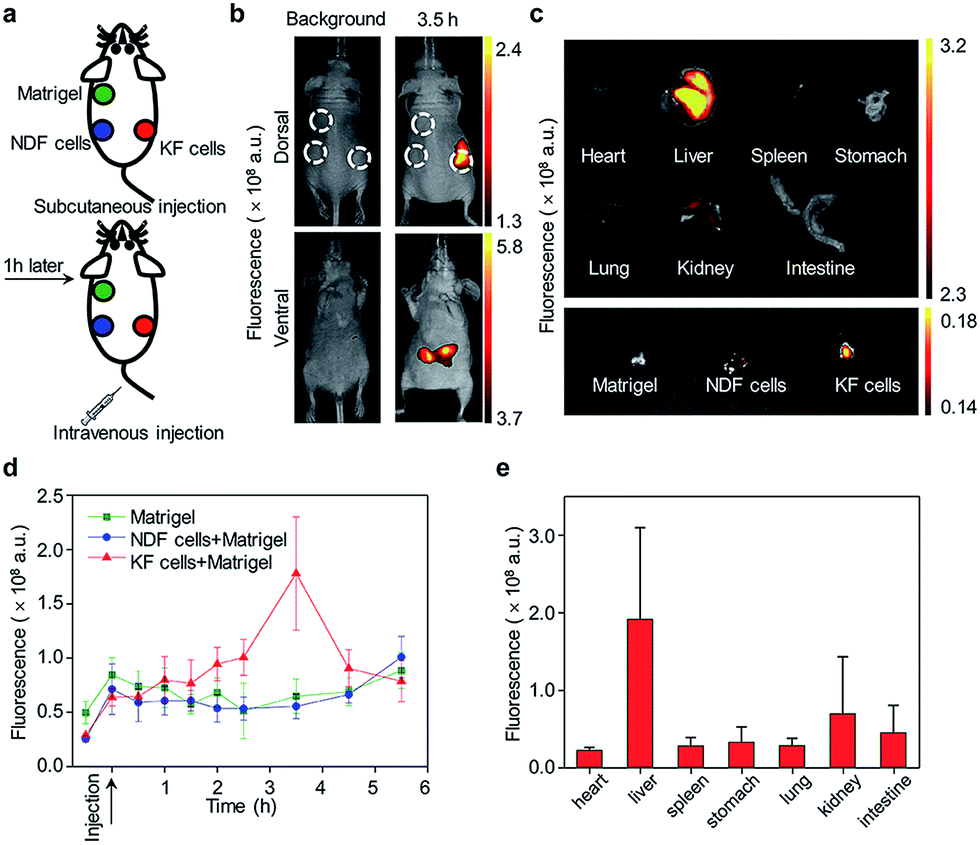
The ability of CyTF to distinguish keloid cells from normal skin cells was further tested in a xenograft mice model. The KF cell pellets (6 × 10⁵ cells), NDF cell pellets (6 × 10⁵ cells) separately dissolved in 200 μL solution (Matrigel/DMEM = 1![[thin space (1/6-em)]](https://www.rsc.org/images/entities/char_2009.gif) :1) and Matrigel (200 μL) only as the control group were injected into three points on the back of living mice, and 200 μL CyTF (0.2 mM in deionized water containing 20% ethanol) was intravenously injected (Fig. 4a). By virtue of its NIR fluorescence with deep tissue penetration and minimized tissue auto-fluorescence, fluorescence signals from CyTF being turned on to CyOH could be readily observed in living mice (Fig. 4b). The fluorescence signal of CyTF at the keloid site was found to gradually increase from t = 1 h and reached its maximum at t = 3.5 h.
:1) and Matrigel (200 μL) only as the control group were injected into three points on the back of living mice, and 200 μL CyTF (0.2 mM in deionized water containing 20% ethanol) was intravenously injected (Fig. 4a). By virtue of its NIR fluorescence with deep tissue penetration and minimized tissue auto-fluorescence, fluorescence signals from CyTF being turned on to CyOH could be readily observed in living mice (Fig. 4b). The fluorescence signal of CyTF at the keloid site was found to gradually increase from t = 1 h and reached its maximum at t = 3.5 h.
 | ||
| Fig. 4 In vivo fluorescence imaging of keloid. (a) Schematic illustration of keloid fluorescence imaging in living nude mice. (b) Whole animal dorsal (upper panel) and ventral (lower panel) fluorescence imaging before intravenous injection (left panel) and 3.5 hours after intravenous injection (right panel). The upper left green circle indicates subcutaneously injected Matrigel as a control. The lower left blue circle indicates subcutaneous injected mixture of NDF cells and Matrigel. And the lower right red circle indicates a subcutaneous injected mixture of KF cells and Matrigel. (c) Fluorescence imaging of different organs and injected Matrigel. The organs were imaged after incubating in 200 μM ONOO− solution for 30 minutes. (d) Quantification of fluorescence intensity as a function of time. (e) Fluorescence quantification of major organs of mice. The fluorescence images were acquired at 720 nm upon excitation at 675 nm. | ||
At this time point, the fluorescence intensity was 3-fold compared to NDF cells and control (Fig. 4d). Afterwards, the fluorescence signal at the keloid site decreased, until reaching a similar level to the background, suggesting that CyTF could be readily cleared over time. After 6 h, the mice were sacrificed to study in vivo distribution, the organs were first incubated in ONOO− solution to activate any remaining CyTF to fluorescent CyOH, and most of the probes were found accumulated in the liver (Fig. 4c and e). The injected cell pellets were also extracted, and KF cell pellets showed stronger fluorescence signals as compared to those of the NDF cell pellets and control group. The in vivo experiments confirmed that CyTF could be activated by ONOO− and used to image implanted KF cells in living mice.
Conclusions
In summary, we have developed NIR molecular probes CyTF and CyBA (λex/λem = 640/717 nm) to detect ONOO−, and applied them to distinguish keloid fibroblasts from normal dermal fibroblasts. CyTF was highly specific towards ONOO−, while CyBA was responsive to both ONOO− and H2O2. In living cells, CyTF showed higher fluorescence enhancement than CyBA, which were 3.76 and 2.26-fold in TGF-β stimulated normal dermal fibroblasts and keloid fibroblasts, respectively. In keloid fibroblasts treated with RepSox, the fluorescence signals decreased to a large extent, proving CyTF to be a potent drug screener. This cellular imaging results proved that keloid fibroblasts had a higher intracellular level of ONOO− than H2O2, which could be explained by the rapid reaction between elevated NO˙ and O2˙− from abnormal TGF-β signalling. In the xenograft mice model, an obvious fluorescence signal from CyTF was detected, which was 3-fold higher than that from normal tissues. Our study not only highlights the role of ONOO− in keloid pathogenesis, but validates the feasibility of applying optical molecular probes in keloid diagnosis.Experimental section
Materials
All chemicals and reagents were purchased from Sigma-Aldrich unless otherwise stated. Commercially available reagents were used without further purification unless noted otherwise. Corning Matrigel Matrix was purchased from Corning Life Sciences.Instrumentation
UV-vis spectra were recorded on a Shimadzu UV-2450 spectrophotometer. Fluorescence measurements were carried out on a Fluorolog 3-TCSPC spectrofluorometer (Horiba Jobin Yvon). HPLC analyses were performed on an Agilent 1260 system equipped with a G1311B pump, a UV detector and an Agilent Zorbax SB-C18 RP (9.4 × 250 mm) column, with CH3CN (0.1% of TFA) and water (0.1% of TFA) as the eluent. NMR spectra were measured using a Bruker 300 MHz instruments (Germany). All 1H chemical shifts (δ) are relative to residual protic solvent (CHCl3: δ 7.26 ppm). Mass spectra were measured using a Thermo LCQ Fleet LC-MS in ESI mode (America). Fluorescence images of cells were acquired on a Laser Scanning Microscope LSM800 (Zeiss).Synthesis
:1) to afford compound CyBA as a blue solid (75%). 1H NMR (300 MHz, CDCl3): δ = 8.61 (d, J = 15, 1H), 7.86 (d, J = 9, 2H), 7.48 (m, 3H), 7.40 (m, 1H), 7.32 (m, 1H), 7.16 (s, 1H), 6.86 (m, 2H), 6.60 (d, J = 15, 1H), 5.22 (s, 2H), 4.04 (s, 2H), 3.67 (m, 2H), 3.12 (m, 2H), 1.75 (s, 3H), 1.60 (m, 2H), 1.46 (s, 6H), 1.32 (s, 12H). 13C NMR (75 MHz, DMSO-d6): δ = 166.87, 160.83, 159.62, 144.22, 142.03, 141.76, 137.70, 134.25, 132.49, 131.39, 129.34, 128.68, 128.45, 126.98, 126.72, 126.55, 122.46, 113.55, 113.37, 113.13, 104.89, 101.77, 65.45, 50.15, 45.07, 33.44, 32.30, 31.58, 27.76, 27.13. MS (ESI): m/z = 600.3 [M + H]+.
Cell culture and fluorescence imaging
Normal dermal fibroblasts (NDFs) and keloid-derived fibroblasts (KFs) were cultured in DMEM (Dulbecco's Modified Eagle Medium) supplemented with heat-inactivated fetal bovine serum (10%) in a humidified environment containing 5% CO2 and 95% air at 37 °C, respectively. Cell media were replaced every three days. For cell fluorescence imaging, NDFs and KFs (6 × 10⁴ cells per well in 1 mL) were seeded in the dishes (dia. 35 mm) and incubated overnight to reach 70% confluency. Cells in the negative control groups were treated with NAC alone or NAC followed by TGF-β1 and NAC. Cells in the positive control were treated with TGF-β1. Cells in the control group underwent the same treatment procedure with DMEM (10% FBS, 1% PE). After incubation, the medium was removed, and the cells were washed three times with PBS buffer. Then the cells were stained with Hoechst 33342 (NucBlue Live ReadyProbes Reagent, Thermo Fisher) for nuclei and fixed with 4% polyformaldehyde solution. Fluorescence images of the live cells were acquired on a Laser Scanning Microscope LSM800 (Zeiss). The excitation and emission wavelengths for cell imaging were 640/655–710 nm for CyTF/CyBA and 405/410–470 nm for Hoechst. ImageJ software was utilized to remove signal background and quantify cellular fluorescence intensity.Cytotoxicity assay
Normal dermal fibroblasts (NDFs) and keloid-derived fibroblasts (KFs) were seeded in 96-well plates (2 at 104 cells per well) for 24 h, and then CyTF or CyBA (final concentration: 5, 10, 15, and 20 μM) was added to the cell culture medium. Cells were incubated with or without (control) CyTF or CyBA, followed by the addition of MTS assay (Promega Cat. no. G3581, 100 μL, 0.1 mg mL−1) for 4 h. The absorbance of MTS at 490 nm was measured by using a microplate reader. The cytotoxic effects (VR) of CyTF or CyBA were assessed using the following equation: VR = A/A0 × 100%, where A and A0 are the absorbance of the experimental group and control group, respectively. The assays were performed in five sets for each concentration.In Vivo imaging
All animal studies were performed in accordance with the Guidelines for Care and Use of Laboratory Animals of the Nanyang Technological University-Institutional Animal Care and Use Committee (NTU-IACUC) and approved by the Institutional Animal Care and Use Committee (IACUC) for Animal Experiment, Singapore. NDF and KF cell suspensions in DMEM-diluted Matrigel were freshly prepared. Then the mixtures were injected at three positions on the back under the skin of nude 8 week-old female mice with equal volume. CyTF was intravenously injected. Fluorescence imaging was performed using an IVIS imaging system (exposure time: 60 s, IVIS-CT machine, PerkinElmer).Statistics analysis
The fluorescence images were processed with ROI analysis using Living Image 4.0 Software. The results are expressed as the mean ± standard deviation unless otherwise stated. Statistical comparisons between the two groups were determined by Student's t-test. For all tests, p < 0.05 was considered as statistically significant. All statistical calculations were performed using GraphPad Prism v.6 (GraphPad Software Inc., CA, USA).Conflicts of interest
There are no conflicts to declare.Acknowledgements
K. P. thanks Nanyang Technological University (Start-Up grant: NTUSUG: M4081627.120) and the Singapore Ministry of Education (Academic Research Fund Tier 1: RG133/15 M4011559 and 2015-T1-002-091; and Tier 2 MOE2016-T2-1-098) for the financial support. C. X. thanks Singapore A*STAR Biomedical Research Council (IAF-PP grant): M4070281. All the animal experiments were conducted in compliance with the guidelines established by the Institutional Animal Care and Use Committee (IACUC), Sing Health.Notes and references
- R. Medzhitov, Nature, 2008, 454, 428–435 CrossRef PubMed.
- B. De Felice, C. Garbi, M. Santoriello, A. Santillo and R. R. Wilson, Mol. Cell. Biochem., 2009, 327, 191–201 CrossRef PubMed.
- E. Novo and M. Parola, Fibrog. Tissue Repair, 2008, 1, 5 CrossRef PubMed.
- D. Wolfram, A. Tzankov, P. Pulzl and H. Piza-Katzer, Dermatol. Surg., 2009, 35, 171–181 CrossRef PubMed.
- Q. Miao, D. C. Yeo, C. Wiraja, J. Zhang, X. Ning, C. Xu and K. Pu, Angew. Chem., Int. Ed. Engl., 2018, 57, 1256–1260 CrossRef PubMed.
- D. C. Yeo, C. Wiraja, A. S. Paller, C. A. Mirkin and C. Xu, Nat. Biomed. Eng., 2018, 2, 227 CrossRef.
- N. Sampson, P. Berger and C. Zenzmaier, Oxid. Med. Cell. Longevity, 2012, 2012, 458276 Search PubMed.
- P. Chiarugi, G. Pani, E. Giannoni, L. Taddei, R. Colavitti, G. Raugei, M. Symons, S. Borrello, T. Galeotti and G. Ramponi, J. Cell Biol., 2003, 161, 933–944 CrossRef PubMed.
- A. Gabrielli, S. Svegliati, G. Moroncini and D. Amico, Open Rheumatol. J., 2012, 6, 87 CrossRef PubMed.
- A. Shroff, A. Mamalis and J. Jagdeo, Curr. Pathobiol. Rep., 2014, 2, 257–267 CrossRef PubMed.
- Y. J. Lee, S. B. Kwon, C. H. Kim, H. D. Cho, H. S. Nam, S. H. Lee, M. W. Lee, D. H. Nam, C. Y. Choi and M. K. Cho, Ann. Dermatol., 2015, 27, 507–516 CrossRef PubMed.
- J. Jagadeesan and A. Bayat, Int. J. Surg., 2007, 5, 278–285 CrossRef PubMed.
- M. Gharaee-Kermani and S. H. Phan, Curr. Pharm. Des., 2001, 7, 1083–1103 CrossRef PubMed.
- J. K. Willmann, N. van Bruggen, L. M. Dinkelborg and S. S. Gambhir, Nat. Rev. Drug Discovery, 2008, 7, 591–607 CrossRef PubMed.
- H. Maeda, K. Yamamoto, I. Kohno, L. Hafsi, N. Itoh, S. Nakagawa, N. Kanagawa, K. Suzuki and T. Uno, Chemistry, 2007, 13, 1946–1954 CrossRef PubMed.
- M. Abo, Y. Urano, K. Hanaoka, T. Terai, T. Komatsu and T. Nagano, J. Am. Chem. Soc., 2011, 133, 10629–10637 CrossRef PubMed.
- D. Yang, H. L. Wang, Z. N. Sun, N. W. Chung and J. G. Shen, J. Am. Chem. Soc., 2006, 128, 6004–6005 CrossRef PubMed.
- Z. N. Sun, H. L. Wang, F. Q. Liu, Y. Chen, P. K. Tam and D. Yang, Org. Lett., 2009, 11, 1887–1890 CrossRef PubMed.
- X. Sun, Q. Xu, G. Kim, S. E. Flower, J. P. Lowe, J. Yoon, J. S. Fossey, X. Qian, S. D. Bull and T. D. James, Chem. Sci., 2014, 5, 3368–3373 RSC.
- F. Yu, P. Song, P. Li, B. Wang and K. Han, Analyst, 2012, 137, 3740–3749 RSC.
- H. Zhang, R. Liu, Y. Tan, W. H. Xie, H. Lei, H.-Y. Cheung and H. Sun, ACS Appl. Mater. Interfaces, 2015, 7, 5438–5443 CrossRef PubMed.
- P. Li, T. Xie, X. Duan, F. Yu, X. Wang and B. Tang, Chemistry, 2010, 16, 1834–1840 CrossRef PubMed.
- Y. Jiang, G. Zheng, N. Cai, H. Zhang, Y. Tan, M. Huang, Y. He, J. He and H. Sun, Chem. Commun., 2017, 53, 12349–12352 RSC.
- A. L. Garner, C. M. St Croix, B. R. Pitt, G. D. Leikauf, S. Ando and K. Koide, Nat. Chem., 2009, 1, 316–321 CrossRef PubMed.
- X. Chen, X. Tian, I. Shin and J. Yoon, Chem. Soc. Rev., 2011, 40, 4783–4804 RSC.
- T. D. Ashton, K. A. Jolliffe and F. M. Pfeffer, Chem. Soc. Rev., 2015, 44, 4547–4595 RSC.
- B. Kalyanaraman, V. Darley-Usmar, K. J. Davies, P. A. Dennery, H. J. Forman, M. B. Grisham, G. E. Mann, K. Moore, L. J. Roberts II and H. Ischiropoulos, Free Radical Biol. Med., 2012, 52, 1–6 CrossRef PubMed.
- A. J. Shuhendler, K. Pu, L. Cui, J. P. Uetrecht and J. Rao, Nat. Biotechnol., 2014, 32, 373 CrossRef PubMed.
- W. Zhang, P. Li, F. Yang, X. Hu, C. Sun, W. Zhang, D. Chen and B. Tang, J. Am. Chem. Soc., 2013, 135, 14956–14959 CrossRef PubMed.
- K. Pu, A. J. Shuhendler and J. Rao, Angew. Chem., Int. Ed., 2013, 52, 10325–10329 CrossRef PubMed.
- X. Zhen, C. Zhang, C. Xie, Q. Miao, K. L. Lim and K. Pu, ACS Nano, 2016, 10, 6400–6409 CrossRef PubMed.
- A. R. Lippert, G. C. Van de Bittner and C. J. Chang, Acc. Chem. Res., 2011, 44, 793–804 CrossRef PubMed.
- L. Yuan, W. Lin, S. Zhao, W. Gao, B. Chen, L. He and S. Zhu, J. Am. Chem. Soc., 2012, 134, 13510–13523 CrossRef PubMed.
- M. Giorgio, M. Trinei, E. Migliaccio and P. G. Pelicci, Nat. Rev. Mol. Cell Biol., 2007, 8, 722–728 CrossRef PubMed.
- R. Radi, J. Biol. Chem., 2013, 288, 26464–26472 CrossRef PubMed.
- R. J. Akhurst and A. Hata, Nat. Rev. Drug Discovery, 2012, 11, 790–811 CrossRef PubMed.
- K. M. Holmstrom and T. Finkel, Nat. Rev. Mol. Cell Biol., 2014, 15, 411–421 CrossRef PubMed.
- M. Saura, C. Zaragoza, W. Cao, C. Bao, M. Rodriguez-Puyol, D. Rodriguez-Puyol and C. J. Lowenstein, Circ. Res., 2002, 91, 806–813 CrossRef PubMed.
- F. Gellibert, J. Woolven, M.-H. Fouchet, N. Mathews, H. Goodland, V. Lovegrove, A. Laroze, V.-L. Nguyen, S. Sautet and R. Wang, J. Med. Chem., 2004, 47, 4494–4506 CrossRef PubMed.
Footnote |
| † Electronic supplementary information (ESI) available. See DOI: 10.1039/c8sc01865k |
| This journal is © The Royal Society of Chemistry 2018 |