 Open Access Article
The robust, readily available cobalt(III) trication [Co(NH2CHPhCHPhNH2)3]3+ is a progenitor of broadly applicable chirality and prochirality sensing agents†
Quang H.
Luu
 ,
Kyle G.
Lewis‡
,
Anik
Banerjee
,
Kyle G.
Lewis‡
,
Anik
Banerjee
 ,
Nattamai
Bhuvanesh
and
John A.
Gladysz
 *
*
Department of Chemistry, Texas A&M University, P.O. Box 30012, College Station, Texas 77842-3012, USA. E-mail: gladysz@mail.chem.tamu.edu
First published on 11th May 2018
Abstract
When NMR spectra of chiral racemic organic molecules containing a Lewis basic functional group are recorded in the presence of air and water stable salts of the cobalt(III) trication [Co((S,S)-NH2CHPhCHPhNH2)3]3+ (23+), separate signals are usually observed for the enantiomers (28 diverse examples, >12 functional groups). Several chiral molecules can be simultaneously analyzed, and enantiotopic groups in prochiral molecules differentiated (16 examples). Particularly effective are the mixed bis(halide)/tetraarylborate salts Λ-23+ 2X−BArf− (X = Cl, I; BArf = B(3,5-C6H3(CF3)2)4), which are applied in CD2Cl2 or CDCl3 at 1–100 mol% (avg 34 and 14 mol%). Job plots establish 1![[thin space (1/6-em)]](https://www.rsc.org/images/entities/char_2009.gif) :
:![[thin space (1/6-em)]](https://www.rsc.org/images/entities/char_2009.gif) 1 binding for Λ-23+ 2Cl−BArf− and 1-phenylethyl acetate (4) or 1-phenylethanol (10), and ca. 1
1 binding for Λ-23+ 2Cl−BArf− and 1-phenylethyl acetate (4) or 1-phenylethanol (10), and ca. 1![[thin space (1/6-em)]](https://www.rsc.org/images/entities/char_2009.gif) :
:![[thin space (1/6-em)]](https://www.rsc.org/images/entities/char_2009.gif) 2 binding with DMSO (CD2Cl2). Selected binding constants are determined, which range from 7.60–2.73 M−1 for the enantiomers of 10 to 28.1–22.6 M−1 for the enantiomers of 4. The NH moieties of the C2 faces of the trication are believed to hydrogen bond to the Lewis basic functional groups, as seen in the crystal structure of a hexakis(DMSO) solvate of Λ-23+ 3I−. These salts rank with the most broadly applicable chirality sensing agents discovered to date.
2 binding with DMSO (CD2Cl2). Selected binding constants are determined, which range from 7.60–2.73 M−1 for the enantiomers of 10 to 28.1–22.6 M−1 for the enantiomers of 4. The NH moieties of the C2 faces of the trication are believed to hydrogen bond to the Lewis basic functional groups, as seen in the crystal structure of a hexakis(DMSO) solvate of Λ-23+ 3I−. These salts rank with the most broadly applicable chirality sensing agents discovered to date.
1. Introduction
Ever since the recognition of molecular chirality, chemists have sought to quantify enantiomer ratios in non-racemic samples.1 For more than a century, the dominant method was polarimetry, despite many intrinsic limitations.2,3 Today, nearly every analytical technique is being brought to bear on the problem, often in a quest for high throughput screening.4,5 Two broad classes of assays see the most use: “chiral” chromatography6,7 and NMR spectroscopy.8–13NMR methods can be divided into three principal categories: chiral derivatizing agents (CDAs),8–12,14,15 paramagnetic chiral lanthanide shift reagents (CLSRs),16 and chiral solvating agents (CSAs).8,10–13 Over the past few years, the last approach has attracted increasing attention.17–30 Many but not all of the CSAs are hydrogen bond donors, often with two-four NH or OH groups.17,21,22,25–28,30 Some of these have been tailored to recognize a specific functional group,19,23,24,26–28 while others have wider applicability.17,20–22,25,29,30
The first chiral inorganic compounds to be isolated in enantiomerically pure form were reported by Werner some 105 years ago, and included salts of the trication [Co(en)3]3+ (13+; en = ethylenediamine).31–35 We have recently found that lipophilic salts of this trication36 and the related species [Co((S,S)-NH2CHArCHArNH2)3]3+ (23+ for Ar = Ph)37–39 and [Co(en)2(NH2CH2CH((CH2)nN(CH3)2)NH2)]3+ (33+)40 – all of which are depicted in Fig. 1 – serve as hydrogen bond donor catalysts for a variety of organic transformations. The trication 13+ features only metal centered chirality, for which the absolute configurations are traditionally designated Λ and Δ.41 In the trications 23+ and 33+, the three ethylenediamine ligands are substituted with six aryl groups42 or a single (CH2)nN(CH3)2 moiety, respectively.43 The latter constitutes a bifunctional catalyst.40 Both enantiomers of the NH2CHPhCHPhNH2 (dpen) ligand in 23+ are commercially available at modest prices.44
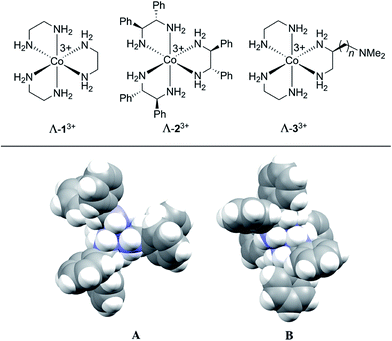 | ||
| Fig. 1 (Top) Chiral hydrogen bond donor catalysts based upon cobalt(III) tris(ethylenediamine) trications. (Bottom) Space filling representations of the trication of Λ-23+ 3Cl−·2H2O·2CH3OH; A, view down the idealized C3 axis; B, view down one of three idealized C2 axes.42 | ||
Although the mechanisms of these transformations are still under investigation, their effectiveness is thought to be rooted in the large number of NH groups (twelve). Those of one diastereomer of 23+ are depicted in Fig. 1 (bottom). As many as five to six might play a role in transition state assemblies,45 as opposed to a maximum of two with most literature catalysts such as thioureas.46 As such, they might possess unique capabilities as CSAs. Indeed, in the course of screening catalytic reactions by NMR, marked differentiation of enantiomers and enantiotopic (prochiral) groups were noted.
In this paper, we report a detailed study of chirality and prochirality sensing by the preceding complexes, and in particular the commercially available47 bis(chloride)/tetraarylborate mixed salt Λ-23+ 2Cl−BArf− (BArf = B(3,5-C6H3(CF3)2)4) and the bis(iodide) analog Λ-23+ 2I−BArf−. These robust, air and water stable substances are remarkable in affording baseline NMR signal separations at loadings as low as 1 mol%. The scope of functional group applicability ranks with the most versatile existing CSAs, and they appear unsurpassed in differentiating enantiotopic groups in achiral molecules.48–55
2. Results
2.1. Syntheses of cobalt(III) CSAs
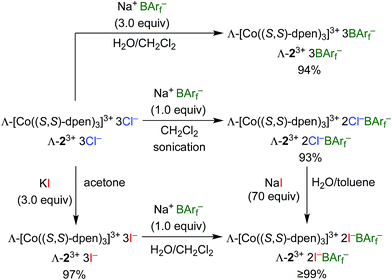
Enantiopure Λ-13+ 3BArf− and diastereopure Λ-23+ 2Cl−BArf−, Λ-23+ 2Cl−B(C6F5)4−, Λ-23+ 3BArf−, and Δ-23+ 2Cl−BArf− were prepared according to previously reported procedures.36,42 Those for the BArf− salts of Λ-23+ are summarized in Scheme 1. The key precursor Λ-23+ 3Cl− is easily synthesized from CoCl2 or Co(OAc)2, O2, and (S,S)-dpen.42The new triiodide salt Λ-23+ 3I− was isolated in 97% yield from the reaction of Λ-23+ 3Cl− and KI in acetone.56 Addition of 1.0 equiv. of Na+ BArf− afforded the mixed bis(iodide)/tetraarylborate salt Λ-23+ 2I−BArf− in 99% yield after workup. This complex could also be isolated in >99% yield from the reaction of excess NaI and Λ-23+ 2Cl−BArf−. It possessed the advantage of being – unlike the other salts – soluble in the inexpensive deuterated solvent CDCl3.
2.2. Screening of cobalt(III) CSAs
The efficacies of the preceding complexes as CSAs were screened with racemic 1-phenylethyl acetate (4). As presented in Table 1, 0.0071 M solutions of the CSAs in various solvents were combined with neat 4 (1.0 equiv.). In favorable cases, the chemical shifts of all of the aliphatic NMR signals of the enantiomers differed, as detailed in Table S1 of the ESI.† In all of these cases, the methine (PhC![[H with combining low line]](https://www.rsc.org/images/entities/b_i_char_0048_0332.gif) (CH3)O(C
(CH3)O(C![[double bond, length as m-dash]](https://www.rsc.org/images/entities/char_e001.gif) O)CH3) protons were the most strongly differentiated (Δδ, Table 1). However, Λ-13+ 3BArf− (entry 1) was ineffective in all assays, including additional analytes such as 1-phenethyl amine (5), phenyl methyl sulfoxide (6), and 2-carbomethoxycyclopentanone (7).
O)CH3) protons were the most strongly differentiated (Δδ, Table 1). However, Λ-13+ 3BArf− (entry 1) was ineffective in all assays, including additional analytes such as 1-phenethyl amine (5), phenyl methyl sulfoxide (6), and 2-carbomethoxycyclopentanone (7).
| Entry | CSA | Solvent | Δδ |
|---|---|---|---|
| a Samples were prepared in 5 mm NMR tubes as described in the Experimental section. b Separate signals for the enantiomers were not observed, although line widths increased from 0.6–0.9 to 1.0–2.0 Hz. | |||
| 1 | Λ-13+ 3BArf− | CD2Cl2 | —b |
| 2 | Λ-23+ 2Cl−BArf− | CD2Cl2 | 1.32 |
| 3 | Δ-23+ 2Cl−BArf− | CD2Cl2 | 0.15 |
| 4 | Λ-23+ 2Cl−B(C6F5)4− | CD2Cl2 | 1.37 |
| 5 | Λ-23+ 3BArf− | CD2Cl2 | 0.34 |
| 6 | Λ-23+ 2I−BArf− | CD2Cl2 | 1.30 |
| 7 | Λ-23+ 2I−BArf− | CDCl3 | 1.75 |
| 8 | Λ-23+ 2I−BArf− | Acetone-d6 | —b |
| 9 | Λ-23+ 2I−BArf− | CD3CN | —b |
| 10 | Λ-23+ 2I−BArf− | DMSO-d6 | —b |
| 11 | Λ-23+ 2Cl−BArf− | Acetone-d6 | —b |
| 12 | Λ-23+ 2Cl−BArf− | CD3CN | —b |
| 13 | Λ-23+ 2Cl−BArf− | DMSO-d6 | —b |
In contrast, the bis(chloride) tetraarylborate salts Λ-23+ 2Cl−BArf− and Λ-23+ 2Cl−B(C6F5)4− gave widely separated methine proton signals in CD2Cl2 (entries 2 and 4; Δδ 1.37–1.32 ppm). The opposite diastereomer of the former, Δ-23+ 2Cl−BArf−, was much less effective (entry 3, Δδ 0.15 ppm). Interestingly, the corresponding tris(tetraarylborate) salt Λ-23+ 3BArf− was also less effective (entry 5; Δδ 0.34 ppm), despite the removal of all counter anions that can hydrogen bond to the NH groups of the trication.42
The bis(iodide) salt Λ-23+ 2I−BArf− gave a high Δδ value (entry 6; 1.30 ppm), comparable to that of Λ-23+ 2Cl−BArf−. Happily, when Λ-23+ 2I−BArf− was applied in the less polar and coordinating solvent CDCl3, the Δδ value increased by 33% (entry 7, 1.75 ppm). Finally, when either Λ-23+ 2Cl−BArf− or Λ-23+ 2I−BArf− were employed in the more polar and coordinating solvents acetone-d6, CD3CN, or DMSO-d6, the enantiomers of 4 were no longer differentiated (entries 8–13).
It was sought to establish the minimum CSA loading needed to resolve the NMR signals of the enantiomers. Accordingly, an NMR tube was charged with a 0.036 M CD2Cl2 solution of Λ-23+ 2Cl−BArf− (0.70 mL, 0.025 mmol). Then neat 4 was added in increments (0.00050 mL; ca. 0.0012 g, 0.0050 mmol). As shown in Fig. 2, the Δδ values for all three aliphatic signals were plotted against the mol% of the CSA, which is in great excess at the start. The data spanned a range of 500 mol% down to 5 mol% (total volume of liquids: 0.7005 to 0.7500 mL, or less than a 7% concentration change). Although the Δδ values monotonically decreased, all signals maintained baseline separations.
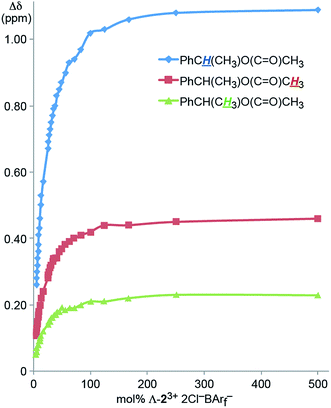 | ||
| Fig. 2 Dependence of the separation of the aliphatic 1H NMR signals of the enantiomers of 4 (Δδ, CD2Cl2) upon the mol% of the CSA Λ-23+ 2Cl−BArf−. | ||
The concentration dependence of the efficacies of the CSAs was also probed. For this purpose, a NMR tube was charged with a CD2Cl2 solution that was 0.040 M in 4 (0.020 mmol) and 0.010 M in Λ-23+ 2Cl−BArf− (0.0050 mmol), or a CSA loading of 25 mol%. Then increments of CD2Cl2 were added, giving more dilute solutions. As shown in Fig. 3, there was little change in the Δδ values over a two fold dilution. However, up to a 30% decrease could be seen at the lower concentration ranges investigated.
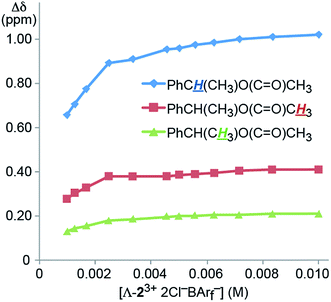 | ||
| Fig. 3 Dependence of the separation of the aliphatic 1H NMR signals of the enantiomers of 4 (Δδ, CD2Cl2) upon concentration using the CSA Λ-23+ 2Cl−BArf− (constant at 25 mol%). | ||
2.3. Functional group scope, chirality sensing
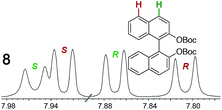
As summarized in Table 2, racemic chiral organic compounds with a variety of Lewis basic functionalities (4–31) were treated with the most effective CSAs, Λ-23+ 2I−BArf− (CDCl3 solution) and Λ-23+ 2Cl−BArf− (CD2Cl2 solution). The former could differentiate the 1H NMR signals of the enantiomers in every case, and the latter failed with only three analytes. The signals employed are denoted in red in Table 2. With fluorine (15) or phosphorus (19, 20) containing analytes, 19F{1H} or 31P{1H} NMR was used instead. In cases where signals have been assigned to specific enantiomers, the samples were spiked with 0.50 equiv. of an authentic sample of one of the enantiomers.| Analyte/NMR signalsb | Δδc, mol% | Δδd, mol% | Analyte/NMR signalsb | Δδc, mol% | Δδd, mol% |
|---|---|---|---|---|---|
| a Samples were prepared in 5 mm NMR tubes as described in the Experimental section. b The spectra depicted (1H unless noted) were obtained with Λ-23+ 2I−BArf− in CDCl3. c Signal separation (ppm)/mol% using Λ-23+ 2I−BArf−. d Signal separation (ppm)/mol% using Λ-23+ 2Cl−BArf−. e 19F{1H} NMR spectra were utilized. f 31P{1H} NMR spectra were utilized. g Separate signals for the enantiomers were not observed. | |||||

|
0.07, 1.0 | 0.29, 5.0 |

|
0.05, 0 | 0.01, 10 |

|
0.01, 4.0 | 0.05, 10 |

|
0.01, 3.0 | 0.05, 10 |
|
0.08, 100 | 0.04, 20 |

|
0.05, 20 | 0.04, 50 |

|
0.06, 3.0 | 0.07, 50 |

|
0.05, 3.0 | 0.06, 30 |

|
0.10, 1.0 | 0.43, 100 |

|
0.18, 30 | 0.06, 100 |

|
0.06, 30 | 0.32, 100 |

|
0.02e, 30 | 0.04e, 100 |

|
0.03, 10 | 0.04, 4.0 |

|
0.12, 30 | 0.28, 100 |

|
0.11, 1.0 | 0.09, 1.0 |

|
0.09f, 11 | 0.07f, 10 |

|
0.09f, 3.0 | 0.10f, 2.0 |

|
0.09, 5.0 | 0.09, 12 |

|
0.06, 5.0 | 0.06, 4.0 |

|
0.11, 7.0 | 0.16, 50 |

|
0.07, 33 | —g |

|
0.08, 6.0 | 0.05, 33 |

|
0.05, 2.0 | 0.06, 3.0 |

|
0.03, 3.0 | —g |

|
0.02, 22 | —g |

|
0.10, 11 | 0.07, 25 |

|
0.04, 2.0 | 0.04, 2.0 |

|
0.12, 18 | 0.06, 18 |
With Λ-23+ 2Cl−BArf−, the loadings required for baseline to near-baseline signal separations ranged from 1 to 100 mol%, with an average of 34 mol%. With Λ-23+ 2I−BArf−, the loading range was identical, but the average decreased to 14 mol%. It was sought to verify that reliable quantitative data could be obtained from this new class of CSAs. Thus, scalemic samples of 4 were prepared and the ee values assayed using both Λ-23+ 2Cl−BArf− and chiral HPLC, as described in the Experimental section. As depicted in Fig. S1 (ESI†), the two methods were essentially in perfect agreement.
When a chiral arene lacking a Lewis basic functional group, sec-butyl benzene (PhCH(CH3)CH2CH3), was similarly investigated (Λ-23+ 2I−BArf−, CDCl3), only a single set of (broadened) NMR signals was observed. Other analytes that gave only one set of signals included the benzylic chloride 1-phenyl-1-chloroethane, BINOL and its diacetate, and (surprisingly) the amide 5-hydroxymethyl-2-pyrrolidinone. However, the enantiomers of alkyl halides that contained additional Lewis basic functional groups, such as 29 and 30 (Table 2), were easily differentiated.
2.4. Prochirality sensing
The types of experiments in the previous section were repeated with achiral molecules using a CSA loading of 100 mol% (1.0 equiv.). As summarized in Table 3, in many cases different signals were observed for enantiotopic groups. Enantiotopic geminal or vicinal hydrogen atoms also became coupled to each other. Achiral molecules in which enantiotopic groups were not differentiated include nitroethane, propionitrile, propionic acid, methyl isovalerate, tetrahydrofuran, and diethyl phosphite.| Analyte/NMR signalsb | Δδc | Δδd | Analyte/NMR signalsb | Δδc | Δδd |
|---|---|---|---|---|---|
| a Samples were prepared in 5 mm NMR tubes as described in the Experimental section. b The spectra depicted were obtained with Λ-23+ 2I−BArf− in CDCl3. c Signal separation (ppm) using Λ-23+ 2I−BArf−. d Signal separation (ppm) using Λ-23+ 2Cl−BArf−. e Separate signals for the enantiomers were not observed in the presence of 100–500 mol% of Λ-23+ 2I−BArf−. | |||||

|
0.03 | 0.04 |

|
0.12 | 0.10 |

|
0.12 | 0.23 |

|
0.04 | 0.12 |

|
0.16 | 0.15 |

|
0.02 | 0.02 |

|
0.03 | 0.02 |

|
0.46 | 0.66 |

|
0.05 | 0.04 |

|
0.16 | 0.09 |

|
0.17 | 0.11 |

|
0.20 | 0.09 |

|
0.30 | 0.18 |

|
0.12 | 0.11 |

|
—e | 0.07 |

|
0.15 | 0.10 |
2.5. Enhanced throughput sensing
Higher throughput variants of the above methodology would be desirable. Thus, it was tested whether the enantiomeric purities of two or more analytes could be simultaneously determined. A CDCl3 solution of racemic 4, 2-carbomethoxycyclopentanone (7), 1-phenylethanol (10), and two hydroxyphenylmethyl dialkyl phosphonates (19, 20) was prepared (2.0![[thin space (1/6-em)]](https://www.rsc.org/images/entities/char_2009.gif) :
:![[thin space (1/6-em)]](https://www.rsc.org/images/entities/char_2009.gif) 2.0
2.0![[thin space (1/6-em)]](https://www.rsc.org/images/entities/char_2009.gif) :
:![[thin space (1/6-em)]](https://www.rsc.org/images/entities/char_2009.gif) 2.0
2.0![[thin space (1/6-em)]](https://www.rsc.org/images/entities/char_2009.gif) :
:![[thin space (1/6-em)]](https://www.rsc.org/images/entities/char_2009.gif) 1.0
1.0![[thin space (1/6-em)]](https://www.rsc.org/images/entities/char_2009.gif) :
:![[thin space (1/6-em)]](https://www.rsc.org/images/entities/char_2009.gif) 2.0 mol ratio). Then Λ-23+ 2I−BArf− was added (100 mol% with respect to 19; 50 mol% with respect to the other analytes; average loading per analyte 11 mol%).
2.0 mol ratio). Then Λ-23+ 2I−BArf− was added (100 mol% with respect to 19; 50 mol% with respect to the other analytes; average loading per analyte 11 mol%).
As shown in Fig. 4, the enantiomers of all five analytes were differentiated by NMR. Such experiments are potentially complicated by overlapping signals, but this is sidestepped in Fig. 4 by using a second nucleus, 31P, to assay the phosphonates 19 and 20. Some practical uses of simultaneous enantiomeric purity assays would include kinetic resolutions,57–59 for example the acetylation of 10 to 4 or vice versa,57–60 and enantioselective reactions that afford two or more diastereomers. To date, the closest approximation to this capability seems to involve covalent adducts of CDAs where all analytes contain a common functional group (e.g., a primary amine).61
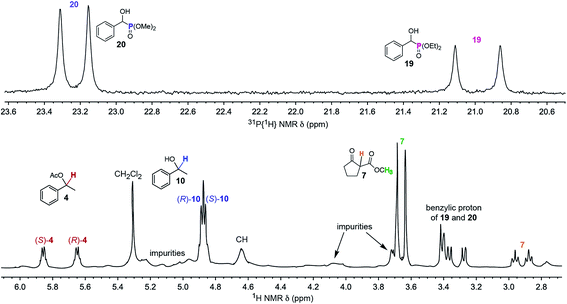 | ||
Fig. 4
31P{1H} (top) and 1H (bottom) NMR spectra of a CDCl3 solution of a 2.0![[thin space (1/6-em)]](https://www.rsc.org/images/entities/char_2009.gif) : :![[thin space (1/6-em)]](https://www.rsc.org/images/entities/char_2009.gif) 2.0 2.0![[thin space (1/6-em)]](https://www.rsc.org/images/entities/char_2009.gif) : :![[thin space (1/6-em)]](https://www.rsc.org/images/entities/char_2009.gif) 2.0 2.0![[thin space (1/6-em)]](https://www.rsc.org/images/entities/char_2009.gif) : :![[thin space (1/6-em)]](https://www.rsc.org/images/entities/char_2009.gif) 1.0 1.0![[thin space (1/6-em)]](https://www.rsc.org/images/entities/char_2009.gif) : :![[thin space (1/6-em)]](https://www.rsc.org/images/entities/char_2009.gif) 2.0 2.0![[thin space (1/6-em)]](https://www.rsc.org/images/entities/char_2009.gif) : :![[thin space (1/6-em)]](https://www.rsc.org/images/entities/char_2009.gif) 1.0 mixture of 4, 7, 10, 19, 20 and the CSA Λ-23+ 2I−BArf− (50 mol% vs.4, 7, 10, and 20; 100 mol% vs.19). 1.0 mixture of 4, 7, 10, 19, 20 and the CSA Λ-23+ 2I−BArf− (50 mol% vs.4, 7, 10, and 20; 100 mol% vs.19). | ||
2.6. Mechanism of chirality and prochirality sensing
Some insight has been previously acquired regarding hydrogen bonding between the twelve NH protons of the trications 13+ and 23+ and various counter anions.37,42,45 For example, data for Λ-23+ 2Cl−BArf− indicate that the two chloride anions strongly bind to the two C3 faces (Fig. 1, bottom left), shifting the 1H NMR signals of six NH protons markedly downfield (ca. δ 8 ppm). The other six NH protons, which occupy the three C2 faces (Fig. 1, bottom right), have only the solvent or the very poorly coordinating BArf− anion to interact with. Accordingly, their 1H NMR signals remain upfield (ca. δ 4 ppm).37 These trends are illustrated in the bottom spectrum in Fig. 5, although it deserves emphasis that the signal separation is both concentration and temperature dependent.42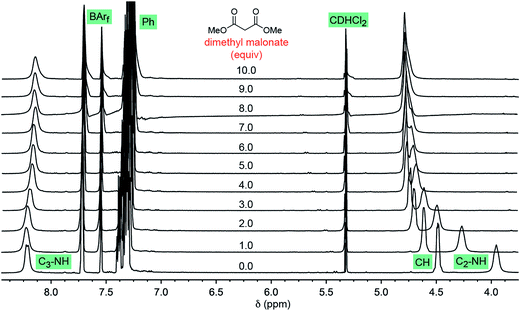 | ||
| Fig. 5 1H NMR spectra: titration of a 0.019 M CD2Cl2 solution of Λ-23+ 2Cl−BArf− (0.0076 mmol; bottom spectrum) with dimethyl malonate in 0.0080 mL (0.0073 mmol) increments (ten ascending spectra). | ||
As exemplified by the other spectra in Fig. 5, CD2Cl2 solutions of Λ-23+ 2Cl−BArf− have been titrated with various analytes, such as dimethyl malonate, trans-β-nitrostyrene, methyl ethyl ketone, and both enantiomers of 4. In proceeding from one to 10 equivalents, appreciable downfield shifts of the upfield C2 NH signals are observed. The downfield C3 NH signals are much less affected. Often there is virtually no shift, as seen with dimethyl malonate (Fig. 5, Δδ = 0.07 ppm), trans-β-nitrostyrene, and methyl ethyl ketone; with the enantiomers of 4, there is a modest upfield trend (0.13–0.33 ppm). Although these shifts may reflect a combination of phenomena, it seems assured that the donor functionalities in the analytes hydrogen bond to the C2 faces.
Next, Job plots62 were constructed using 1H NMR data (CD2Cl2) for Λ-23+ 2Cl−BArf− and the enantiopure analytes (S)-4 and (S)-10 as described in the Experimental section. As shown in Fig. 6, both exhibited maxima when the mol fraction of both components was 0.50, indicative of 1![[thin space (1/6-em)]](https://www.rsc.org/images/entities/char_2009.gif) :
:![[thin space (1/6-em)]](https://www.rsc.org/images/entities/char_2009.gif) 1 adducts. Analogous experiments with the prochiral analyte DMSO showed a maximum when the mol fraction of the CSA was 0.3, indicative of a ca. 2
1 adducts. Analogous experiments with the prochiral analyte DMSO showed a maximum when the mol fraction of the CSA was 0.3, indicative of a ca. 2![[thin space (1/6-em)]](https://www.rsc.org/images/entities/char_2009.gif) :
:![[thin space (1/6-em)]](https://www.rsc.org/images/entities/char_2009.gif) 1 DMSO/Λ-23+ 2Cl−BArf− adduct.
1 DMSO/Λ-23+ 2Cl−BArf− adduct.
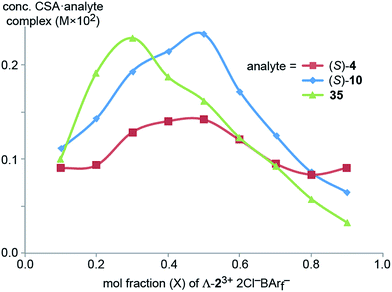 | ||
| Fig. 6 Job plots for mixtures of Λ-23+ 2Cl−BArf− and (S)-1-phenylethyl acetate ((S)-4), (S)-1-phenylethanol ((S)-10), and DMSO (35) in CD2Cl2 at ambient temperature. | ||
In an established protocol for obtaining binding constants (K),62 0.0050 M CD2Cl2 solutions of Λ-23+ 2Cl−BArf− and Λ-23+ 2I−BArf− were titrated with (S)-4, (R)-4, (S)-10, and (R)-10. The concentrations of the analytes were plotted vs. the change in chemical shift of the C2 NH protons. The K values were calculated by nonlinear least-square curve fitting using the 1![[thin space (1/6-em)]](https://www.rsc.org/images/entities/char_2009.gif) :
:![[thin space (1/6-em)]](https://www.rsc.org/images/entities/char_2009.gif) 1 stoichiometry established from the Job plots and standard equations and software (Experimental section and Fig. S7 (ESI†)).
1 stoichiometry established from the Job plots and standard equations and software (Experimental section and Fig. S7 (ESI†)).
As can be seen in Table 4, the alcohol 10 exhibited the lowest K values (7.60–2.73 M−1), while those of the corresponding acetate 4 were somewhat higher (124–22.6 M−1). Whereas (R)-4 gave somewhat higher K values than (S)-4, (S)-10 (which has the same relative configuration as (S)-4) gave higher K values than (R)-10. The K values for Λ-23+ 2I−BArf− and either enantiomer of 4 were considerably higher than those with Λ-23+ 2Cl−BArf−. However, they were much more comparable for the other analytes.
| Entry | CSA | analyte | K (M−1) |
|---|---|---|---|
| a See Experimental section including the ESI for details. | |||
| 1 | Λ-23+ 2Cl−BArf− | (S)-4 | 22.6 |
| 2 | Λ-23+ 2Cl−BArf− | (R)-4 | 28.1 |
| 3 | Λ-23+ 2I−BArf− | (S)-4 | 104 |
| 4 | Λ-23+ 2I−BArf− | (R)-4 | 124 |
| 5 | Λ-23+ 2Cl−BArf− | (S)-10 | 7.60 |
| 6 | Λ-23+ 2Cl−BArf− | (R)-10 | 2.73 |
| 7 | Λ-23+ 2I−BArf− | (S)-10 | 5.60 |
| 8 | Λ-23+ 2I−BArf− | (R)-10 | 4.28 |
2.7. Crystal structure of a DMSO adduct
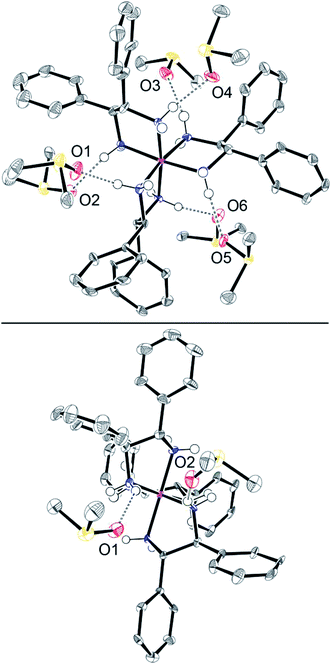
Efforts were made to cocrystallize salts of 23+ with analytes from Tables 2 and 3. This proved to be much more challenging than anticipated. Finally, diethyl ether was allowed to vapor diffuse into a DMSO solution of Λ-23+ 3I−. This gave yellow blocks of the hexakis(DMSO) solvate Λ-23+ 3I−·6DMSO. X-ray data were acquired and the structure was solved as outlined in Table S3 (ESI†) and the Experimental section. The unit cell contained two independent molecules. Their structures were quite similar, so only one is depicted in Fig. 7.Although there was no crystallographic symmetry, the trication exhibited an idealized C3 axis. This lies perpendicular to the plane of the paper in the top view in Fig. 7. Furthermore, three idealized C2 axes lie in the plane of the paper. The bottom view in Fig. 7 is oriented so that one C2 axis runs perpendicular to the plane of the paper. Since the CHPh–CHPh bonds of each chelate are parallel to the C3 axis (Fig. 7, top), the trication is said to exhibit a lel3 orientation,41 as previously found in the crystal structure of Λ-23+ 3Cl− (Fig. 1, bottom).
As illustrated in Fig. S8 (ESI†), two of the three iodide anions hydrogen bond to the three NH groups on opposite C3 faces, consistent with the rationale for the downfield NH 1H NMR signals in Fig. 5. The I⋯HN and I⋯N distances (2.725–2.835 Å (avg 2.767 Å)63–65 and 3.612–3.712 Å (avg 3.648 Å)) are in typical ranges.66 The closest contacts for the third iodide anion (see Fig. S9 and S10†) involve the hydrogen atoms of DMSO molecules (2.996–4.043 Å; avg 3.330 Å) and phenyl rings of adjacent trications (3.027–3.285 Å; avg 3.121 Å).63–65
As shown in Fig. 7 (top) and Table S4,† the oxygen atoms of all six DMSO molecules make a single hydrogen bond to a different NH group associated with the three C2 faces. The O⋯HN and O⋯N distances (1.975–2.290 Å (avg 2.132 Å)63–65 and 2.869–3.006 Å (avg 2.929 Å)) are close to those found in other crystallographically characterized adducts of DMSO with NH hydrogen bond donors (for five typical examples67–71 1.81–2.10 Å (avg 1.97 Å) and 2.65–2.85 Å (avg 2.77 Å)). For further validation, the sums of the relevant van der Waals radii can be considered (oxygen/hydrogen, 1.52 + 1.20–1.10 Å; oxygen/nitrogen, 1.52 + 1.55 Å).72–74 The closer contacts in Λ-23+ 3I−·6DMSO confirm bonding interactions by both classical75 and modern76 criteria.
Over 150 crystal structures of salts of the trication [Co(en)3]3+ have been determined, and the diverse types of NH/anion hydrogen bonding interactions observed have been reviewed and classified.45 The bonding motifs exhibited by the two proximal iodide anions in Λ-23+ 3I−·6DMSO are quite common and have been given the designation [C3,C3,C3][1]. Those for the DMSO molecules would be abbreviated [C2][1].
3. Discussion
3.1. New CSAs vs. literature systems
The preceding data document an impressive efficacy of Λ-23+ 2Cl−BArf− and Λ-23+ 2I−BArf− as CSAs. The former has the advantage of being commercially available, whereas the latter (easily synthesized from the former) exhibits superior performance characteristics apparently connected to its solubility in CDCl3. The data for Λ-23+ 2Cl−B(C6F5)4− in Table 1 suggest that salts with related tetraarylborate anions may be comparably effective. The mechanism of action (following section) clearly involves hydrogen bonding between the C2 NH donor groups of the CSAs and the analytes.Most of the other CSAs described in the literature also feature hydrogen bond donor groups,17,19–21,23–30 although many possess acceptor groups as well.17,20,21,23,29 Typical donor groups include ureas or chalcogenoureas,25,26,30 squaramides,27 secondary amines,24 amides of primary amines,17,23,29 sulfonamides,19 and BINOL derivatives.20 However, many of these have only been applied to one or two functional groups.
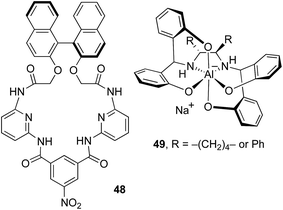
The most broadly applicable CSAs for chirality sensing reported to date have been developed by Ema, Sakai and coworkers.17 Their lead system, 48 (Fig. 8), was applied to ten functional groups, three of which were not assayed with Λ-23+ 2X−BArf− (oxazolidinone, sulfoximine, isocyanate). Their typical loadings were 100–200 mol%, although a chiral sulfoxide was found to require only 5 mol%. Conversely, Tables 2 and 3 contain several functional groups that they did not study (ester/β-ketoester, amine, amide/sulfonamide, hydroxyphosphonate, ketone/1,3-diketone, ether). Furthermore, with our lead CSA, Λ-23+ 2I−BArf−, the average loading is 14% (range 1–100%).
There is a wider selection of CSAs that have been applied to four-seven functional groups.21,22,25,29 These generally require loadings of 100–300 mol%, although with one analyte the CSA 49 (Fig. 5, R = Ph) was shown to be effective at 60 mol%. None of these CSAs are commercially available. However, another group has assembled a library of 32 commercial CSAs, and developed high throughput protocols for identifying optimal partners for specific analytes.77 Far fewer CSAs have been applied to prochirality sensing, and the eight functional groups represented in Table 3 exceed the sum of all those in the literature we have been able to locate.48–54
To our knowledge, the above salts of Λ-23+ represent the first CSAs that are based upon transition metals. However, transition metals are well represented among chiral derivatizing agents (CDAs).61,78,79 The salt 49 (ref. 22) in Fig. 8 is based upon a main group metal, aluminum, and displays several conceptual similarities with our cobalt(III) systems. First, both metals are octahedral and constitute stereocenters. Second, the anion of 49 has C2 symmetry, vs. D3 symmetry for the trication 23+. Third, 49 has two Al–NH groups that can serve as hydrogen bond donors (as well as four Al–O groups that can serve as hydrogen bond acceptors).
3.2. Analyte binding to Λ-23+
There is a variety of evidence that the enthalpy of hydrogen bonding to a C3 face of Λ-23+ (A, Fig. 1) is much greater than that to a C2 face (B, Fig. 1). For example, the solid state structures of the diastereomeric trichloride salts Λ- and Δ-23+ 3Cl− show the three chloride ions to be distributed over two C3 faces and one C2 face (as opposed to, for example, three C2 faces).37Scheme 1 shows that one chloride ion – presumably that associated with the C2 face – can more easily be replaced by the very poor hydrogen bond acceptor BArf− than the other two.37,42 As illustrated by the bottom trace in Fig. 5, the 1H NMR spectra of mixed salts Λ-23+ 2X−BArf− always show two NH signals of equal area (6H/6H), with the downfield signal moving upfield as X− becomes a poorer hydrogen bond acceptor (e.g., BF4−, PF6−).37,42 These observations are consistent with two “occupied” C3 faces and three “free” C2 faces.When Λ-23+ 2Cl−BArf− is titrated with suitable substrates, such as dimethyl malonate in Fig. 5, the upfield NH groups shift markedly downfield, but the downfield NH groups are much less affected. This indicates dominant analyte binding at the C2 faces. In accord with the Job plots (Fig. 6), we presume that the binding constants for the first one ((S)-4, (S)-10) or two (35) analyte molecules are much greater than those for additional molecules. This may seem at odds with the crystal structure in Fig. 7, in which the three C2 faces engage in hydrogen bonding with six DMSO molecules (one per NH group). However, interactions that may be very weak in solution are often expressed in the solid state, where physical packing effects may also play roles. For example, one could speculate that a crystal lattice grows faster when comprised of more symmetrical entities derived from six-fold DMSO binding.
The binding constants (K) in Table 4 track the order found for the hydrogen bond donor p-fluorophenol and the analytes ethyl acetate and benzyl alcohol (CCl4, 25 °C; 11.7 and 7.24 M−1).80 Those for the acetate 4 (22–124 M−1) are in the range of values measured for other CSAs and cyclic esters,17,19 and those for the benzylic alcohol 10 (2.7–7.6 M−1) likewise compare well with values obtained with other benzylic alcohols.26
The loss of efficacy of Λ-23+ 2Cl−BArf− and Λ-23+ 2I−BArf− in coordinating solvents (entries 8–13, Table 1) presumably reflects the saturation of the C2 faces, obstructing access by the analytes. The halide free salt Λ-23+ 3BArf−, with three very poorly hydrogen bond accepting anions, gives much lower Δδ values (entry 5, Table 1). We speculate that the analyte now preferentially binds to an “unoccupied” C3 face, which for some reason gives diminished chiral recognition. Naturally, the cocrystallization of additional analytes with all of the preceding cobalt(III) complexes remains a goal. Crystal structures have been reported for analyte adducts of only a few other CSAs.22,24 Alternatively, insight can be gained by computational studies,22,23,26–28 and a series of DFT investigations are currently underway.
3.3. Conclusion
The new cobalt based CSAs described above offer unparalleled functional group applicability, effectiveness at significantly lower loadings and in the presence of multiple analytes, extended stability to air and water, and ready availability from inexpensive building blocks. Their success reflects the generality of second coordination sphere hydrogen bonding between the NH donor groups and Lewis basic functional groups in the analytes. Given the many “best in class” characteristics, and recent commercial availability,47 they appear primed for wide adoption.4. Experimental section
4.1. General
The CSAs Λ-23+ 2Cl−BArf−, Λ-23+ 2Cl−B(C6F5)4−, Λ-23+ 3BArf−, and Δ-23+ 2Cl−BArf− were synthesized as reported earlier,42 and Λ-13+ 3BArf− was prepared as described for the enantiomer;36 Λ-23+ 2Cl−BArf− is also commercially available.47 All abbreviations are defined in the introduction. All reactions and workups were conducted in air.4.2. Λ-23+ 3I−
A round bottom flask was charged with a suspension of Λ-23+ 3Cl−·3H2O (0.170 g, 0.199 mmol)42 in acetone (20 mL) and KI (0.099 g, 0.597 mmol) was added with vigorous stirring. A suspension of white particles in an orange solution formed. After 1 h, the mixture was filtered. The solvent was removed from the filtrate by rotary evaporation and oil pump vacuum (20 h, rt) to give Λ-23+ 3I−·3H2O (0.219 g, 0.194 mmol, 97%) as an orange solid, mp 200–202 °C dec (open capillary). Anal. calcd for C42H48CoI3N6·3H2O (1130.07): C 44.62, H 4.81, N 7.43; found C 44.81, H 4.91, N 7.02.NMR (CD3OD/acetone-d6, δ in ppm): 1H (500 MHz) 7.51–7.49 (m, 12H, o-Ph), 7.38–7.37 (m, 18H, m-, p-Ph), 6.75 (br s, 6H, NHH′), 5.95 (br s, 6H, NHH′), 5.26 (s, 6H, CHPh), 2.83 (br s, 7H, H2O); 13C{1H} (125 MHz) 136.4 (s, i-Ph), 130.1 (s, p-Ph), 129.9 and 129.7 (2 s, o- and m-Ph), 62.8 (s, CHPh). IR (powder film, cm−1): 3032 (m, νNH), 1683 (m, δNH), 1041 (vs, δCCN).
4.3. Λ-23+ 2I−BArf−
A. A round bottom flask was charged with Λ-23+ 3I−·3H2O (0.117 g, 0.104 mmol), CH2Cl2 (20 mL), H2O (20 mL), and Na+ BArf− (0.092 g, 0.104 mmol). The mixture was vigorously stirred until the orange color had entirely transferred to the CH2Cl2 layer (30 min), which was separated. The solvent was removed by passive evaporation (fume hood) and oil pump vacuum (20 h, rt) to give Λ-23+ 2I−BArf−·0.5H2O (0.188 g, 0.103 mmol, 99%) as a red solid, mp 107–110 °C dec (black liquid, open capillary). Anal. calcd for C74H60BCoF24I2N6·0.5H2O (1821.20): C 48.79, H 3.37, N 4.61; found C 48.88, H 3.61, N 4.62. B. A round bottom flask was charged with aqueous NaI (15.0 mL, 10 wt%, 10.5 mmol), toluene (15.0 mL), and Λ-23+ 2Cl−BArf−·2H2O (0.259 g, 0.152 mmol). The mixture was vigorously stirred, and after 6 h transferred to a separatory funnel. The clear aqueous layer was discarded and the red toluene layer was washed with water (2 × 10 mL). The solvent was removed from the toluene layer by rotary evaporation. The residue was dissolved in CH3OH (10 mL) and the solution was stirred for 20 min.81 The solvent was removed again by rotary evaporation and oil pump vacuum (10 h, rt) to give Λ-23+ 2I−BArf−·0.5H2O (0.277 g, 0.152 mmol, >99%) as a red solid, mp 108–110 °C dec (black liquid, open capillary). Anal. calcd, see above; found C 49.17, H 3.50, N 4.46.4.4. Dependence of Δδ upon CSA and solvent (Table 1)
A 5 mm NMR tube was charged with a 0.0071 M solution of a CSA (0.70 mL, 0.0049 mmol) in the indicated solvent. Neat 1-phenylethyl acetate (4; 0.00050 mL, 0.0012 g, 0.0050 mmol) was added and a 1H NMR spectrum was recorded.4.5. Dependence of Δδ upon mol% of CSA (Fig. 2)
A 5 mm NMR tube was charged with a CD2Cl2 solution of Λ-23+ 2Cl−BArf−·2H2O (0.70 mL, 0.036 M, 0.025 mmol). Neat 4 was then added in 0.00050 mL increments (ca. 0.0012 g, 0.0050 mmol). A 1H NMR spectrum was acquired after each addition. The total volume of 4 added from the first data point (500 mol%) to the final data point (5 mol%) was 0.050 mL.4.6. Dependence of Δδ upon concentration (Fig. 3)
A 5 mm NMR tube was charged with a CD2Cl2 solution (0.50 mL) that was 0.040 M in 4 (0.020 mmol) and 0.010 M in Λ-23+ 2Cl−BArf−·2H2O (0.0050 mmol, 25 mol%). A 1H NMR spectrum was recorded. Then CD2Cl2 was added in increments so as to attain total volumes of 0.60, 0.70, 0.80, 0.90, 1.00, 1.10, 1.50, 2.00, 3.00, 4.00, and 5.00 mL. After each addition, a 1H NMR spectrum was recorded.4.7. Chirality sensing (Table 2)
A (liquid analytes 4–7, 10, 14–18, 21–25, 27–29, 31). 5 mm NMR tubes were charged with CD2Cl2 solutions of Λ-23+ 2Cl−BArf−·2H2O or CDCl3 solutions of Λ-23+ 2I−BArf−·0.5H2O (0.70 mL, 0.0071 M, 0.0049 mmol). The samples were titrated with neat liquid analytes in increments of 0.0050 mmol (1.0 equiv.) and monitored by 1H NMR. Experiments were halted when separate signals for the enantiomers were no longer observed. The total volume of liquids added usually ranged from 0.72 to 0.80 mL. B (solid analytes 8, 9, 11–13, 19–20, 26, 30). Procedure A was repeated, but with the analytes added as 10.0 M CD2Cl2 or CDCl3 solutions in increments of 0.00050 mL (0.0050 mmol).4.8. Enhanced throughput sensing (Fig. 4)
A 5 mm NMR tube was charged with a CDCl3 solution (0.70 mL) that was 0.029 M in 4, 7, 10, and 20 (0.020 mmol each), and 0.014 M in 19 (0.010 mmol). Then Λ-23+ 2I−BArf−·0.5H2O (0.018 g, 0.010 mmol) was added, and 1H and 31P{1H} NMR spectra were recorded.4.9. Prochirality sensing (Table 3)
A 5 mm NMR tube was charged with a CD2Cl2 solution of Λ-23+ 2Cl−BArf−·2H2O or a CDCl3 solution of Λ-23+ 2I−BArf−·0.5H2O (0.70 mL, 0.0071 M, 0.0049 mmol). The analyte (1.0 equiv.) was added as a neat liquid (32–38, 40–42, 44, 46) or solid (39, 43, 45, 47) and 1H NMR spectra were recorded.4.10. Titration of a CSA with dimethyl malonate (Fig. 5)
A 5 mm NMR tube was charged with a 0.019 M CD2Cl2 solution (0.40 mL) of Λ-23+ 2Cl−BArf−·2H2O (0.0076 mmol). A reference 1H NMR spectrum were recorded. A 0.91 M CD2Cl2 solution of dimethyl malonates was added in 0.0080 mL increments (0.0073 mmol). A 1H NMR spectrum was recorded after each addition.4.11. Job plots (Fig. 6)62
0.010 M CD2Cl2 solutions of Λ-23+ 2Cl−BArf−·2H2O and (S)-4 were prepared and mixed at nine volume ratios (mL/mL: 0.050/0.45, 0.10/0.40, 0.15/0.35, 0.20/0.30, 0.25/0.25, 0.30/0.20, 0.35/0.15, 0.40/0.10, 0.45/0.050). 1H NMR spectra were recorded (500 MHz) and the concentration of the adduct CSA·(S)-4 calculated from the equation83,84| [CSA·(S)-4] = [(δobs − δ0)/(δc − δ0)] × [CSA] |
4.12. Binding constants (Table 4)62
0.0050 M CD2Cl2 solutions of Λ-23+ 2Cl−BArf−·2H2O and Λ-23+ 2I−BArf−·0.5H2O were prepared. One 5 mm NMR tube was charged with 1.0 mL of one solution, and another tube with 1.0 mL of the other. Reference 1H NMR spectra were recorded. Analytes were then added in 0.0050 mmol increments (1.0 equiv.) using a microsyringe, and a 1H NMR spectrum was recorded after each addition. The concentrations of the analytes were plotted versus the change in chemical shift of the C2 NH protons (Δδ = δobs − δ0) as in Fig. S7.† The binding constants K were calculated by nonlinear least-square curve fitting using Origin Pro 8.0,85 the 1![[thin space (1/6-em)]](https://www.rsc.org/images/entities/char_2009.gif) :
:![[thin space (1/6-em)]](https://www.rsc.org/images/entities/char_2009.gif) 1 stoichiometry established from the Job plots, and the equation86
1 stoichiometry established from the Job plots, and the equation86| [Analyte] = (1/K) × [x/(1 − x)] |
4.13. Crystallography
A solution of Λ-23+ 3I−·3H2O (0.011 g, 0.010 mmol) in DMSO (0.50 mL) in an open vial was placed inside a 20 mL closed vial containing diethyl ether (7.0 mL). After 4 d, yellow blocks were collected. Data were obtained as outlined in Table S3.† Cell parameters were determined from 45 data frames using a 1° scan. Integrated intensity information for each reflection was obtained by reduction of the data frames with the program APEX3.87 Data were corrected for Lorentz, polarization, and crystal decay effects. SADABS88 was employed for absorption corrections, and the structure was solved using XT/XS in APEX3.87,89–92 The unit cell contained two independent molecules of Λ-23+ 3I−, each associated with six molecules of DMSO. Hydrogen atoms were placed in idealized positions and refined using a riding model. All non-hydrogen atoms were refined with anisotropic thermal parameters. Five of the DMSO molecules were disordered over two positions (occupancy ratios: C1S/3A, C1R/4A, O2/2A, S2/2A, 72![[thin space (1/6-em)]](https://www.rsc.org/images/entities/char_2009.gif) :
:![[thin space (1/6-em)]](https://www.rsc.org/images/entities/char_2009.gif) 28; C1T/6A, C1U/5A, O3/3A, S3/3A, 79
28; C1T/6A, C1U/5A, O3/3A, S3/3A, 79![[thin space (1/6-em)]](https://www.rsc.org/images/entities/char_2009.gif) :
:![[thin space (1/6-em)]](https://www.rsc.org/images/entities/char_2009.gif) 21; C1V/8A, C1W/7A, O4/4A, S4/4A, 78
21; C1V/8A, C1W/7A, O4/4A, S4/4A, 78![[thin space (1/6-em)]](https://www.rsc.org/images/entities/char_2009.gif) :
:![[thin space (1/6-em)]](https://www.rsc.org/images/entities/char_2009.gif) 22; C1X/10A, C1Y/9A, O5/5A, S5/5A, 72
22; C1X/10A, C1Y/9A, O5/5A, S5/5A, 72![[thin space (1/6-em)]](https://www.rsc.org/images/entities/char_2009.gif) :
:![[thin space (1/6-em)]](https://www.rsc.org/images/entities/char_2009.gif) 28; C2C/2E, C1AA/2CA, O12/12A, S12/12A, 52
28; C2C/2E, C1AA/2CA, O12/12A, S12/12A, 52![[thin space (1/6-em)]](https://www.rsc.org/images/entities/char_2009.gif) :
:![[thin space (1/6-em)]](https://www.rsc.org/images/entities/char_2009.gif) 48). Restraints were applied to keep the metrical parameters meaningful. The data were refined by weighted least squares refinement on F2 to convergence.89–93 PLATON (ADDSYM)94 was used to verify the absence of additional symmetry and voids. Flack's parameter (Table S3†) confirmed the absolute stereochemistry.95
48). Restraints were applied to keep the metrical parameters meaningful. The data were refined by weighted least squares refinement on F2 to convergence.89–93 PLATON (ADDSYM)94 was used to verify the absence of additional symmetry and voids. Flack's parameter (Table S3†) confirmed the absolute stereochemistry.95
Conflicts of interest
The authors have a financial interest in the CSAs described in this work, some of which are commercially available.47Acknowledgements
The authors thank the Welch Foundation (Grant A-1656) for support.References
- P. Schreier, A. Bernreuther and M. Huffer, Analysis of Chiral Organic Molecules: Methodology and Applications, Walter de Gruyter & Co., Berlin, Germany, 1995 Search PubMed.
- G. G. Lyle and R. E. Lyle, in Asymmetric Synthesis, ed. J. D. Morrison, Academic Press, Inc., New York, NY, 1983, vol. 1, ch. 2, pp. 13–27 Search PubMed.
- V. Schurig, in Asymmetric Synthesis, ed. J. D. Morrison, Academic Press, Inc., New York, 1983, vol. 1, ch. 5, pp. 59–60 Search PubMed.
- D. Leung, S. O. Kang and E. V. Anslyn, Chem. Soc. Rev., 2012, 41, 448–479 RSC , and ref. 4 and 6–10 therein.
- H. H. Jo, C.-Y. Lin and E. V. Anslyn, Acc. Chem. Res., 2014, 47, 2212–2221 CrossRef PubMed and ref. 12 therein.
- V. Schurig, J. Chromatogr. A, 2001, 906, 275–299 CrossRef PubMed.
- Y. Okamoto and T. Ikai, Chem. Soc. Rev., 2008, 37, 2593–2608 RSC.
- T. J. Wenzel, Discrimination of Chiral Compounds Using NMR Spectroscopy, John Wiley & Sons, Hoboken, NJ, 2007 Search PubMed.
- T. J. Wenzel, in Differentiation of Enantiomers II, ed. V. Schurig, Springer-Verlag, Berlin, Germany, 2013, ch. 1, pp. 1–68 Search PubMed.
- T. J. Wenzel and C. D. Chisholm, Chirality, 2011, 23, 190–214 CrossRef PubMed.
- T. J. Wenzel and C. D. Chisholm, Prog. Nucl. Magn. Reson. Spectrosc., 2011, 59, 1–63 CrossRef PubMed.
- M. S. Silva, Molecules, 2017, 22, 247 CrossRef PubMed.
- G. Uccello-Barretta and F. Balzano, in Differentiation of Enantiomers II, ed. V. Schurig, Springer-Verlag, Berlin, Germany, 2013, ch. 2, pp. 69–132 Search PubMed.
- M. Raban and K. Mislow, Tetrahedron Lett., 1965, 6, 4249–4253 CrossRef.
- J. A. Dale, D. L. Dull and H. S. Mosher, J. Org. Chem., 1969, 34, 2543–2549 CrossRef.
- S.-I. Aizawa, M. Okano and T. Kidani, Chirality, 2017, 29, 273–281 CrossRef PubMed and ref. 1–29 therein.
- T. Ema, D. Tanida and T. Sakai, J. Am. Chem. Soc., 2007, 129, 10591–10596 CrossRef PubMed.
- Representative papers that have appeared since 2014 and describe new CSAs are given in ref. 19–30. For a complete bibliography for this period, see the additional ref. S14–S29 (ESI†).
- A. Couffin, O. Thillaye du Boullay, M. Vedrenne, C. Navarro, B. Martin-Vaca and D. Bourissou, Chem. Commun., 2014, 50, 5997–6000 RSC.
- I. Pal, S. R. Chaudhari and N. Suryaprakash, New J. Chem., 2014, 38, 4908–4912 RSC.
- A. Lakshmipriya, S. R. Chaudhari and N. Suryaprakash, Chem. Commun., 2015, 51, 13492–13495 RSC.
- M.-S. Seo and H. Kim, J. Am. Chem. Soc., 2015, 137, 14190–14195 CrossRef PubMed.
- H. Huang, G. Bian, H. Zong, Y. Wang, S. Yang, H. Yue, L. Song and H. Fan, Org. Lett., 2016, 18, 2524–2527 CrossRef PubMed.
- R. Gupta, R. G. Gonnade and A. V. Bedekar, J. Org. Chem., 2016, 81, 7384–7392 CrossRef PubMed.
- G. Bian, S. Yang, H. Huang, H. Zong and L. Song, Sens. Actuators, B, 2016, 231, 129–134 CrossRef.
- G. Bian, S. Yang, H. Huang, H. Zong, L. Song, H. Fan and X. Sun, Chem. Sci., 2016, 7, 932–938 RSC.
- Y. Li, G.-H. Yang, C. Q. He, X. Li, K. N. Houk and J.-P. Cheng, Org. Lett., 2017, 19, 4191–4194 CrossRef PubMed.
- C. Lv, L. Feng, H. Zhao, G. Wang, P. Stavropoulos and L. Ai, Org. Biomol. Chem., 2017, 15, 1642–1650 Search PubMed.
- N. Jain, A. N. Khanvilkar, S. Sahoo and A. Bedekar, Tetrahedron, 2018, 74, 68–76 CrossRef.
- S. Ito, M. Okuno and M. Asami, Org. Biomol. Chem., 2018, 16, 213–222 Search PubMed.
- A. Werner, Chem. Ber., 1912, 45, 121–130 CrossRef.
- A. Werner, Chem. Ber., 1911, 44, 3279–3284 CrossRef.
- A. Werner, Chem. Ber., 1911, 44, 3272–3278 CrossRef.
- A. Werner, Chem. Ber., 1911, 44, 2445–2455 CrossRef.
- A. Werner, Chem. Ber., 1911, 44, 1887–1898 CrossRef . V. L. King is listed as an author for the Experimental section.
- C. Ganzmann and J. A. Gladysz, Chem.–Eur. J., 2008, 14, 5397–5400 CrossRef PubMed.
- K. G. Lewis, S. K. Ghosh, N. Bhuvanesh and J. A. Gladysz, ACS Cent. Sci., 2015, 1, 50–56 CrossRef PubMed.
- A. Kumar, S. K. Ghosh and J. A. Gladysz, Org. Lett., 2016, 18, 760–763 CrossRef PubMed.
- H. Joshi, S. K. Ghosh and J. A. Gladysz, Synthesis, 2017, 49, 3905–3915 CrossRef.
- S. K. Ghosh, C. Ganzmann, N. Bhuvanesh and J. A. Gladysz, Angew. Chem., Int. Ed., 2016, 55, 4356–4360 ( Angew. Chem. , 2016 , 128 , 4429–4433 ) CrossRef PubMed.
- Review of stereoisomerism in salts of the trication [Co(en)3]3+, and homologs with substituted 1,2-diamine ligands: A. Ehnbom, S. K. Ghosh, K. G. Lewis and J. A. Gladysz, Chem. Soc. Rev., 2016, 45, 6799–6811 RSC.
- S. K. Ghosh, K. G. Lewis, A. Kumar and J. A. Gladysz, Inorg. Chem., 2017, 56, 2304–2320 CrossRef PubMed.
- S. K. Ghosh, C. Ganzmann and J. A. Gladysz, Tetrahedron: Asymmetry, 2015, 26, 1273–1280 CrossRef.
- The best prices in effect as of the submission date of this manuscript are from Oakwood Chemical (http://www.oakwoodchemical.com) (R,R-dpen; $359/100 g) and Ark Pharm (http://www.arkpharminc.com) (S,S-dpen; $420/100 g). Accessed 13 February 2018.
- S. K. Ghosh, A. Ehnbom, K. G. Lewis and J. A. Gladysz, Coord. Chem. Rev., 2017, 350, 30–48 CrossRef.
- H. Miyabe and Y. Takemoto, Bull. Chem. Soc. Jpn., 2008, 81, 785–795 CrossRef.
- https://secure.strem.com/catalog/v/27–4010/16/cobalt_1542135-29-4, accessed 13 February 2018.
- For a brief review of the differentiation of enantiotopic (prochiral) groups by NMR, see pp. 339–341 of ref. 8. For prochirality sensing using CSAs, see ref. 49–54. For prochirality sensing using CLSAs and CDAs, see ref. S30 and S31.† For prochirality sensing using chiral liquid crystals and other chiral media see ref. 55 and S32–S35.†.
- M. J. P. Harger, J. Chem. Soc., Perkin Trans. 2, 1980, 1505–1511 RSC.
- F. A. L. Anet and J. Park, J. Am. Chem. Soc., 1992, 114, 411–416 CrossRef.
- M. T. Reetz, J. Rudolph and R. Mynott, J. Am. Chem. Soc., 1996, 118, 4494–4495 CrossRef.
- A. Bilz, T. Stork and G. Helmchen, Tetrahedron: Asymmetry, 1997, 8, 3999–4002 CrossRef.
- Y. Kobayashi, N. Hayashi and Y. Kishi, Org. Lett., 2002, 4, 411–414 CrossRef PubMed.
- N. Seri, S. Simaan, M. Botoshansky, M. Kaftory and S. Biali, J. Org. Chem., 2003, 68, 7140–7142 CrossRef PubMed.
- P. Lesot, C. Aroulanda, H. Zimmermann and Z. Luz, Chem. Soc. Rev., 2015, 44, 2330–2375 RSC.
- All cobalt(III) complexes are isolated as hydrates, consistent with the appreciable hydrogen bond donor strengths of the NH groups. To aid readability, these are not specified in the formulae in the main text or graphics, but are given in the Experimental section. The additional mass is taken into account in the stoichiometries and yield calculations. For additional related remarks, see ref. 23 in ref. 42.
- J. M. Keith, J. F. Larrow and E. N. Jacobsen, Adv. Synth. Catal., 2001, 343, 5–26 CrossRef.
- E. Vedejs and M. Jure, Angew. Chem., Int. Ed., 2005, 44, 3974–4001 ( Angew. Chem. , 2005 , 117 , 4040–4069 ) CrossRef PubMed.
- H. Pellissier, Adv. Synth. Catal., 2011, 353, 1613–1666 CrossRef.
- C. E. Müller and P. R. Schreiner, Angew. Chem., Int. Ed., 2011, 50, 6012–6042 ( Angew. Chem. , 2011 , 123 , 6136–6167 ) CrossRef PubMed.
- Y. Zhao and T. M. Swager, J. Am. Chem. Soc., 2015, 137, 3221–3224 CrossRef PubMed.
- K. A. Connors, in Binding Constants: the Measurement of Molecular Complex Stability, John Wiley & Sons, New York, NY, 1987, ch. 2, pp. 21–101 Search PubMed.
- The C–H and N–H bond lengths determined from X-ray crystal structures are usually ca. 10% too short. See, inter alia, ref. 64 and 65.
- F. H. Allen, Acta Crystallogr. Sect. B Struct. Sci., 1986, 42, 515–522 CrossRef.
- B. Dittrich, J. Lübben, S. Mebs, A. Wagner, P. Luger and R. Flaig, Chem.–Eur. J., 2017, 23, 4605–4614 CrossRef PubMed.
- T. Steiner, Acta Crystallogr. Sect. B Struct. Sci., 1998, 54, 456–463 CrossRef.
- J. Mizuguchi, Acta Crystallogr., Sect. C: Struct. Chem., 1992, 48, 1279–1283 CrossRef.
- N. Nagel, C. Näther and H. Bock, Acta Crystallogr., Sect. C: Struct. Chem., 1995, C51, 1935–1937 CrossRef.
- K. Wijaya, O. Moers, A. Blaschette and P. G. Jones, Acta Crystallogr., Sect. C: Struct. Chem., 1998, 54, 1707–1710 Search PubMed.
- R. D. Gilardi and R. J. Butcher, Acta Crystallogr., Sect. E: Crystallogr. Commun., 2001, 57, o757–o759 Search PubMed.
- A. D. Bond, Acta Crystallogr., Sect. B: Struct. Sci., 2002, 58, o194–o195 Search PubMed.
- A. Bondi, J. Phys. Chem., 1964, 68, 441–451 CrossRef.
- M. Mantina, A. C. Chamberlin, R. Valero, C. J. Cramer and D. G. Truhlar, J. Phys. Chem. A, 2009, 113, 5806–5812 CrossRef PubMed.
- R. S. Rowland and R. Taylor, J. Phys. Chem., 1996, 100, 7384–7391 CrossRef.
- W. C. Hamilton and J. A. Ibers, Hydrogen bonding in solids: methods of molecular structure determination, ed. W. A. Benjamin, New York, NY, 1968, pp. 14–16 Search PubMed.
- T. Steiner, Angew. Chem., Int. Ed., 2002, 41, 48–76 ( Angew. Chem. , 2002 , 114 , 50–80 ) CrossRef . See ref. 21 therein for a critique of classical van der Waals criteria.
- L. Yang, T. Wenzel, R. T. Williamson, M. Christensen, W. Schafer and C. J. Welch, ACS Cent. Sci., 2016, 2, 332–340 CrossRef PubMed.
- See pp. 365–398 of ref. 8.
- G. Storch, M. Siebert, F. Rominger and O. Trapp, Chem. Commun., 2015, 51, 15665–15668 RSC.
- C. Laurence and J.-F. Gal, in Lewis Basicity and Affinity Scales: Data and Measurement, John Wiley & Sons, Chichester, UK, 2010, pp. 142–147, and 151 Search PubMed.
- When the CH3OH treatment was omitted, the toluene solvate Λ-23+ 2I−BArf−·0.8C7H8 was isolated, mp 110–112 °C dec (black liquid, open capillary). Anal. calcd for C74H60BCoF24I2N6·0.8C7H8 (1885.85): C 50.68, H 3.55, N 4.45; found C 50.09, H 3.63, N 4.38. 1H NMR (500 MHz, CD2Cl2, δ in ppm) BArf− at 7.71 (s, 8H, o), 7.54 (s, 4H, p); (S,S)-dpen at 7.29–7.45 (m, 30H, ArH), 5.31 (br s, 6H, NHH′; partial overlap, CDHCl2), 4.88 (br s, 6H, NHH′), 4.69 (s, 6H, CHPh); 2.01 (br s, 18H, H2O);82 toluene at 7.15-7.23 (m, 4H, C6H5), 2.33 (s, 2.4H, CH3).
- The increased level of water over that derived from the microanalysis is believed to originate from the solvent.
- See pp. 24–28 of ref. 62.
- P. Thordarson, Chem. Soc. Rev., 2011, 40, 1305–1323 RSC.
- http://www.originlab.com/ .
- See pp. 189–194 of ref. 62.
- APEX3, Program for Data Collection on Area Detectors, BRUKER AXS Inc., 5465 East Cheryl Parkway, Madison, WI, USA, pp. 53711–5373 Search PubMed.
- G. M. Sheldrick, SADABS, Program for Absorption Correction of Area Detector Frames, BRUKER AXS Inc., 5465 East Cheryl Parkway, Madison, WI, USA, pp. 53711–5373 Search PubMed.
- G. M. Sheldrick, Acta Crystallogr., Sect. A: Found. Adv., 2008, 64, 112–122 CrossRef PubMed.
- G. M. Sheldrick, Acta Crystallogr., Sect. A: Found. Adv., 2015, 71, 3–8 CrossRef PubMed.
- G. M. Sheldrick, Acta Crystallogr., Sect. C: Struct. Chem., 2015, 71, 3–8 CrossRef PubMed.
- X. T, X. S., BRUKER AXS Inc., 5465 East Cheryl Parkway, Madison, WI, USA, pp. 53711–5373 Search PubMed.
- O. V. Dolomanov, L. J. Bourhis, R. J. Gildea, J. A. K. Howard and H. Puschmann, J. Appl. Crystallogr., 2009, 42, 339–341 CrossRef.
- A. L. Spek, J. Appl. Crystallogr., 2003, 36, 7–13 CrossRef.
- H. D. Flack, J. Appl. Crystallogr., 1983, 39, 876–881 Search PubMed . Theory for correct and inverted structures: 0 and 1.
Footnotes |
| † Electronic supplementary information (ESI) available: CCDC 1812259. For ESI and crystallographic data in CIF or other electronic format see DOI: 10.1039/c8sc01510d |
| ‡ Present address: Synthetics Technology, ExxonMobil Chemical Company, 4500 Bayway Drive, Baytown, TX 77520. |
| This journal is © The Royal Society of Chemistry 2018 |

