
 Open Access Article
 This Open Access Article is licensed under a Creative Commons Attribution-Non Commercial 3.0 Unported Licence
Trapping [PMo12O40]3− clusters into pre-synthesized ZIF-67 toward MoxCoxC particles confined in uniform carbon polyhedrons for efficient overall water splitting†
Congfang
Chen
,
Aiping
Wu
,
Haijing
Yan
,
Yinglu
Xiao
,
Chungui
Tian
* and
Honggang
Fu
 *
*
Key Laboratory of Functional Inorganic Material Chemistry, Ministry of Education of the People’s Republic of China, Heilongjiang University, Harbin, 150080, China. E-mail: chunguitianhq@163.com; fuhg@vip.sina.com; fuhg@hlju.edu.cn
First published on 23rd April 2018
Abstract
Bi-transition metal carbides (BTMCs) are promising in catalytic fields, but the synthesis of small-sized BTMCs remains a challenge. Here, MoxCoxC (mainly below 20 nm in size) confined in uniform carbon polyhedrons (MoxCoxC@C) was synthesized based on trapping [PMo12O40]3− (PMo12) clusters into pre-synthesized, uniform ZIF-67 (PMo/ZIF-67). The opening of the windows (0.34 nm) of ZIF-67 cages through heating is essential to allow the trapping of PMo12 into the cages. This trapping route provides a new method to successfully combine POMs and MOFs that can not be effectively combined via traditional POMOF-based (simultaneous assembly) routes. It also has advantages in controlling the uniformity and components of the materials. The size matching of PMo12 (1 nm) and the cages (1.16 nm) of ZIF-67 enables effective contact of the Co and Mo sources, thus giving small-sized MoxCoxC protected by carbon via calcination. The optimized catalysts showed good performance for water splitting with a low η10 of 83 mV (295 mV) for the hydrogen (oxygen) evolution reaction, which is superior to those derived from ZIF-67 and precursors from POMOF-based routes. Our results also indicated that the HER activity is determined by the kind of BTMC, and the activity for the OER is relative to the oxygen-containing species formed during the initial OER test.
Introduction
Transition metal carbides (TMCs) (MoC,1,2 Co2C3etc.) are showing promise in catalytic fields. Compared with mono-TMCs (MTMCs), Bi-TMCs (BTMCs), composed of early TMs (Mo, W etc.) and late TMs (Co, Ni etc.), have shown tuned electronic properties and improved activity and stability in catalysis,4–6 and thus have received intensive research. The synthesis of small-sized BTMCs is important for their application, but is still a challenging task. One of the basic routes to form BTMCs is the calcination of a precursor containing ETMs (Mo and W), LTMs (Co and Ni) and carbon sources (pechini-based method).6,7 This route is straight-forward, but suffers from the formation of impure phase MTMCs. In other routes, bi-transition metal oxides have been synthesized first, followed by calcination.4,8,9 BTMCs with good purity can be obtained, but usually have a large size of up to μm. These issues are mainly ascribed to the uncontrollable distance between the two kinds of TM and the absence of effective protection. The fabrication of small-sized BTMCs, while avoiding the formation of MTMCs, is important to promote their applications in catalytic fields (an increase in the number of active sites and/or decrease of their usage).Accurate control of the distance between LTMs and ETMs to realize their effective contact in confined (protective) spaces is crucial for forming small-sized BTMCs. Keggin type polyoxometalates (POMs) [XM12O40]n− (XM12, where X is P, Si etc. and M is Mo, W etc.)10,11 are useful Mo (W) sources due to their small size (about 1 nm) and stable structure. Our group has synthesized small-sized MTMCs (nitrides and phosphides) based on the confined transformation of POMs on carbon.12–14 If POMs (typically PMo12) can be confined into LTM-containing spaces with matched sizes, effective contact between the two kinds of TM can be realized. Metal–organic frameworks (MOFs) have been a focus in materials science.15,16 The regular cages in MOFs provide useful spaces for the accommodation of guests.17,18 Thus, the effective combination of POMs and MOFs provides a potential route for carbide synthesis. Traditionally, this combination is realized based on a one-pot “POMOF”-based route, that is, via the simultaneous assembly of metal ions, POMs and ligands. This route is straight-forward, but only suitable for assembling certain ligands (typically 1,3,5-benzenetricarboxylic acid), metal ions and POMs. NENU-5, a POMOF containing Cu2+ and PMo12, can be prepared with uniform morphology, and used to synthesize MoxC@carbon.19 The pyrolysis of PMo12@MIL-100 (Fe) can from a mixture of Fe3C and Mo2C.20 The result should be relative to the un-matched sizes of MIL-100 cages (2.5–2.9 nm) with PMo12 (1 nm), not being favourable for effective contact of the Fe and Mo sources. Therefore, the size match of PMo12 clusters and the cages of MOFs is crucial for realizing effective contact of Mo with LTMs. ZIF-67, composed of Co and 2-MIM (2-methyl imidazole), is a potential host due to its cage size (1.16 nm),21 which is matched with the size of a PMo12 cluster (1 nm),22 so that only one PMo12 cluster can fit into one cage of ZIF-67, in principle. We have attempted to encapsulate PMo12 into ZIF-67 cages based on the simultaneous assembly of Co2+, PMo12 and 2-MIM. However, this straight-forward route has difficulties in concerting the reaction rate of Co2+ and PMo12 with 2-MIM, thus resulting in uncontrolled assembly (the formation of irregular particles) (Fig. S1†). A new route needed to be developed to realize the effective combination of PMo12 with uniform ZIF-67.
Here, we report a new, non-POMOF-based route to combine PMo12 and ZIF-67 effectively. The route is based on trapping PMo12 into pre-synthesized, uniform ZIF-67. The window aperture of a ZIF-67 cage (0.34 nm)21 is too small to allow PMo12 access. Thus, we have adopted a heating method to cause the partial disassembly of Co2+ and 2-MIM from ZIF-67 in solvent (Scheme 1, stage 1) (Fig. S2†). The process can open the window23,24 of the ZIF-67 cage, thus allowing PMo12 access (stage 2). The interaction of PMo12 with 2-MIM on the cage is favorable for its stabilization.25 Dynamic disassembly and reassembly processes are occurring, just like a precipitation–dissolution equilibrium in solid dispersions.26 The reassembly of Co2+ and 2-MIM, especially during the cooling process, can encapsulate the trapped PMo12 in the cage (stage 3). The amount of PMo12 trapped can be well tuned. During calcination, MoxCoxC particles with small sizes (mainly below 20 nm) accompanied with Co nanoparticles (NPs) (the Co can be removed using H2SO4 to give MoxCoxC@C) confined in uniform carbon polyhedrons (MoxCoxC–Co@C) can be formed, benefiting from the effective contact of the Co and Mo sources, and the protective role of carbon derived from 2-MIM (stage 4). MoxCoxC–Co@C can be used as an active catalyst for the hydrogen evolution reaction (HER) and oxygen evolution reaction (OER), with superior performance to catalysts derived from ZIF-67 and the precursor from the simultaneous assembly of PMo12, 2-MIM and Co2+. The trapping-based route largely extends to the kinds of POM and MOF that are not suitable to be effectively combined via traditional POMOF-based routes, and thus expands the applications of POMs and MOFs in materials fields. Typically, here, the trapping route provides a robust solution to issues presented in the traditional synthesis of BTMCs, although there are several studies about the synthesis of MoxC, WC (tungsten carbide) using MOFs as hosts.19,27,28
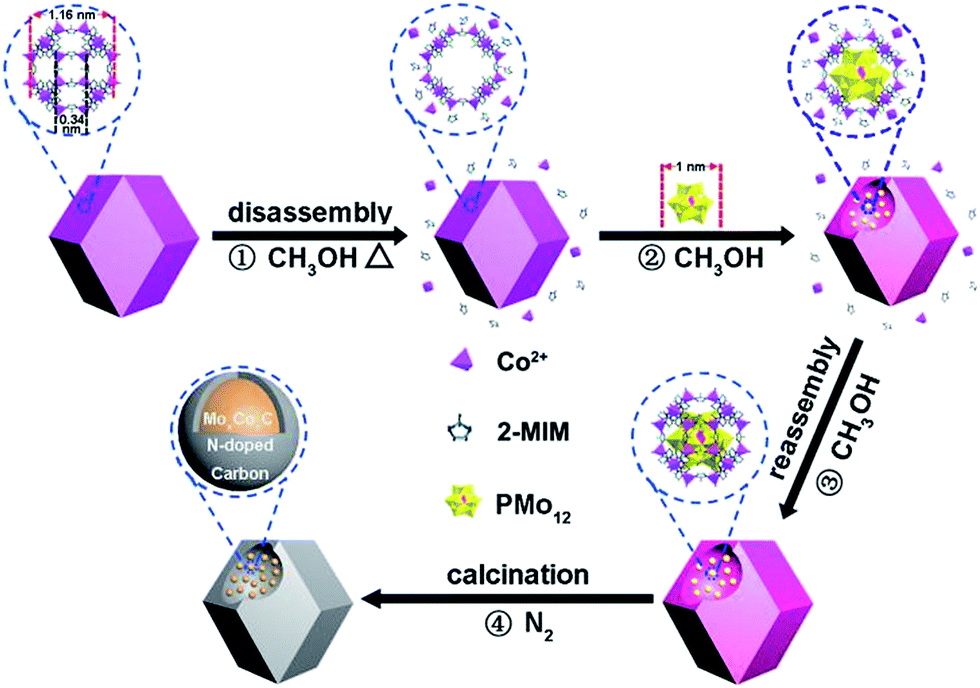 | ||
| Scheme 1 Schematic of the procedure for the synthesis of MoxCoxC confined into uniform carbon polyhedrons. | ||
Results and discussion
MoxCoxC@C is synthesized based on (1) “opening” the windows of the cages in ZIF-67 under heating, (2) the access of PMo12 into the opened cage, (3) the encapsulation of PMo12 in the cage, (4) the formation of MoxCoxC–Co@C through calcinating PMo/ZIF-67 under a N2 atmosphere and (5) the removal of Co using H2SO4 can give MoxCoxC@C. ZIF-67 has large cages with sizes of 1.16 nm. The size of PMo12 is about 1 nm. So, in principle, one cage of ZIF-67 can accommodate one PMo12. However, the window aperture (0.34 nm) of a cage is too small to allow access of PMo12 into pre-synthesized ZIF-67. Thus, the opening of the windows of ZIF-67 cages is key to allow access of PMo12 into the ZIF-67 cage. There is a precipitation–dissolution equilibrium in the dispersion of the solids.26 For MOFs, the process should also exist, and is called a disassembly–reassembly equilibrium. If the disassembly process occurs, Co2+ and 2-MIM will be detected in solution. Based on UV-vis tests, we found that a methanol solution of Co(NO3)2 and 2-MIM showed obvious adsorption peaks in the range 200–250 nm (Fig. S2a and b†). The peak intensity increases with increasing concentration of Co2+ and 2-MIM. So, we analyzed the disassembly degree based on a UV-vis method. To this end, a dispersion of ZIF-67 in methanol was heated for certain time. After cooling, the supernatant was separated from the methanol solution of ZIF-67. The supernatant showed obvious absorbance at ∼220 nm, demonstrating the presence of Co2+ and 2-MIM disassembled from ZIF-67. Also, the supernatant directly separated from the hot reaction solution showed higher absorbance than that from the cooling solution, implying that the disassembly process can be accelerated at elevated temperature (Fig. S2†). This also implies the accelerated reassembly process of Co2+ and 2-MIM during the cooling process. The disassembly process will give defects23,24 in ZIF-67 (open the window of the cage). The concentration of Co2+ and 2-MIM in solution is found to be about 0.5 mmol L−1 by comparing with the UV-vis spectra of the Co2+ (Fig. S2a†) and 2-MIM (Fig. S2b†) solutions. The UV-vis test indicates the partial disassembly of Co2+ and 2-MIM from ZIF-67. The removal of a number of linker or metal nodes can not cause the collapse of the framework structure due to the high degree of connectivity of MOFs. The disassembly process can open the window of ZIF-67, thus allowing access of PMo12 into the ZIF-67 cage. PMo12 can be stabilized in the cage due to its interaction with 2-MIM.25 The reassembly process of Co and 2-MIM, especially during the cooling process, on ZIF-67 can cause the effective encapsulation of PMo12 in ZIF-67 cages (Scheme S1†).The boiling point of methanol is about 64.7 °C in an open system under ambient pressure. We performed the trapping process under solvothermal conditions at 100 °C to promote the disassembly of Co2+ and 2-MIM in ZIF-67, thus realizing more effective trapping of PMo12. The UV-vis spectra indicate that the peaks of PMo12 in solution gradually decrease with prolonging the solvothermal time, implying it is being trapped in ZIF-67 cages (Fig. S2d†). One typical sample from 6 h trapping (PMo/ZIF-67-6, Table S1†) was characterized using a series of methods to verify the access of PMo12 into the ZIF-67 cage. Thermogravimetric (TG) testing shows that the weight loss in the range 30–700 °C is 46.5% for PMo/ZIF-67-6, which is between the 66.5% for ZIF-67 and 22.5% for PMo12 in air, indicating the access of PMo12 into ZIF-67 (Fig. 1a). In the infrared (IR) spectrum of PMo/ZIF-67-6, a new peak indexing to νas (Mo–Ob–Mo) in PMo12 can be observed, which is absent for ZIF-67. The peak has a positive shift of 13 cm−1 in comparison with that of PMo12, implying the interaction of PMo12 with 2-MIM in the cages. Notably, the nitrogen adsorption/desorption curves show that both ZIF-67 and PMo/ZIF-67-6 show the same type I isotherms, indicating the intactness of the ordered structure of ZIF-67.29 The SBET values and pore volumes are 1755 m2 g−1 and 0.643 cm3 g−1 for ZIF-67, and 711 m2 g−1 and 0.262 cm3 g−1 for PMo/ZIF-67-6 (Fig. 1c) with the same pore diameters (Fig. 1c). The results are consistent with the encapsulation of guests in porous materials.30 The smaller surface area of PMo/ZIF-67-6 compared to ZIF-67 provides convincing evidence of successful encapsulation.31 The XRD patterns of PMo/ZIF-67-6 are identical with those of ZIF-67 (Fig. 1d), illustrating that PMo12 is encapsulated into the ZIF-67 cages as separated clusters without altering the crystal parameters of ZIF-67.28,31 An XPS survey spectrum shows the presence of Co, Mo, C, N, O and P in PMo/ZIF-67-6, further implying a combination of PMo12 and ZIF-67. In the high-resolution spectrum of the samples, Mo 3d shows two peaks at 231.8 eV (3d5/2) and 234.8 eV (3d53/2) (Fig. S3†). The peaks have shifted to a lower energy region in comparison with those in PMo12,32 and should be relative to the partial electronic interaction of PMo12 with the ZIF-67 host. Notably, the SEM image shows the uniform polyhedron morphology of PMo/ZIF-67-6 (Fig. 2a), being similar to that of ZIF-67 (Fig. S4†). Based on ICP tests, the amount of PMo12 in PMo/ZIF-67-6 is about 34.1% (the calculation details can be seen in the ESI†). The tests indicate the effectiveness of the “trapping” route to realize the encapsulation of PMo12 into ZIF-67 cages with regular morphology.
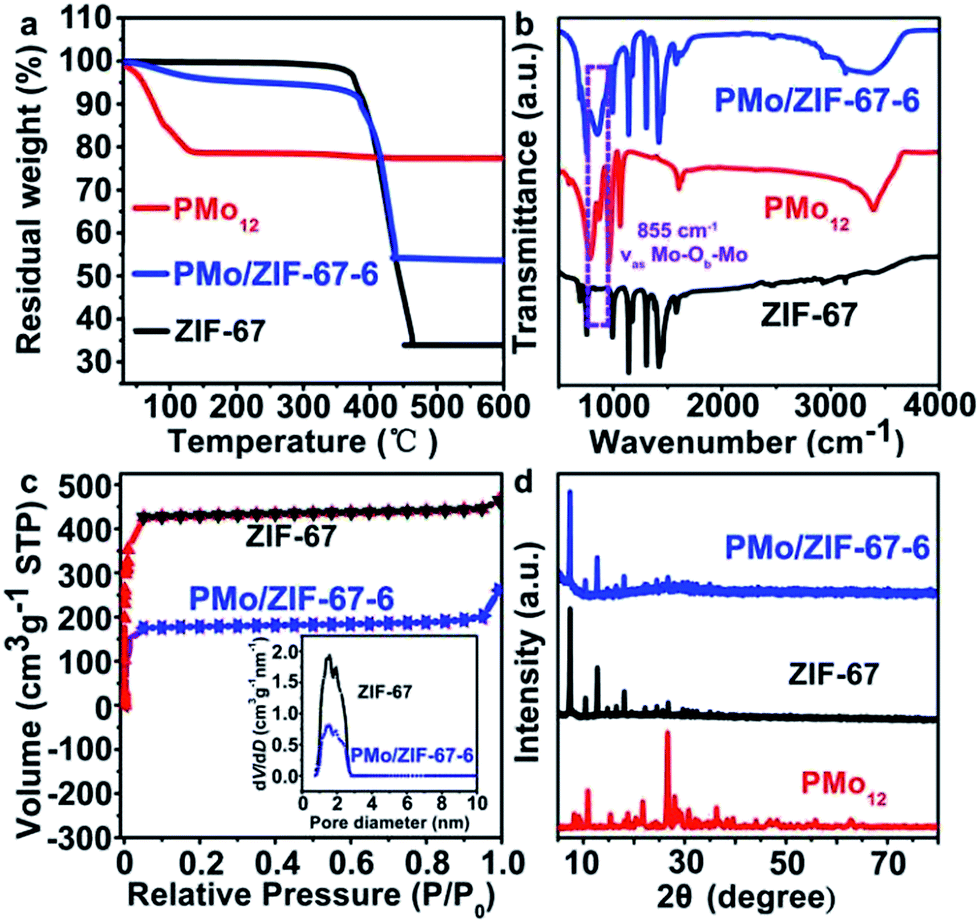 | ||
| Fig. 1 (a) TG curves, (b) IR spectra, (c) N2 adsorption–desorption isotherms of PMo/ZIF-67-6 and ZIF-67, and (d) XRD patterns of PMo12, ZIF-67 and PMo/ZIF-67-6. | ||
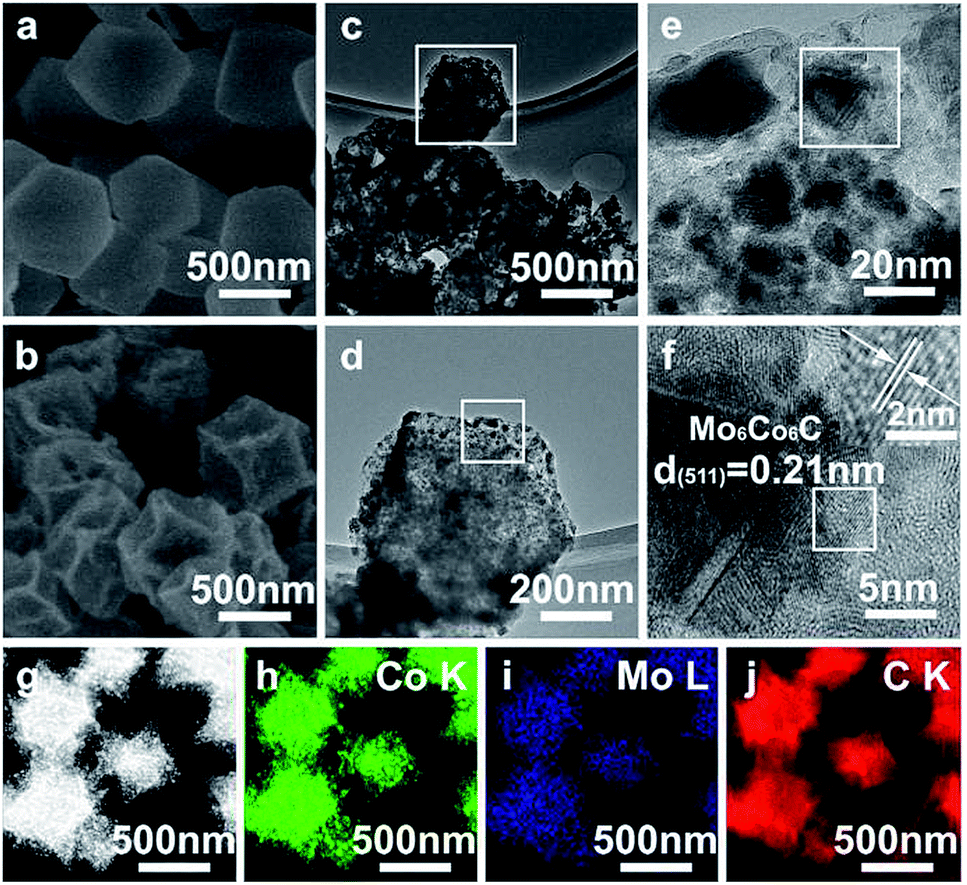 | ||
| Fig. 2 (a) SEM image of PMo/ZIF-67-6, (b) SEM image, (c–f) TEM images, and (g–j) EDS mapping of PMo/ZIF-67-6-6N. | ||
The above analyses indicate the successful encapsulation of PMo12 into ZIF-67 cages. The size of PMo12 being matched with that of the cage causes a close distance (effective contact) between the Co and Mo sources, which is crucial to give BTMCs under suitable conditions. During heating under a N2 atmosphere, 2-MIM can be converted into carbon and release the reducing gas. In other words, the carbon source is also adjacent to the Mo source and Co source, providing a further chance for the easy formation of BTMCs. The carbon can also protect the particles from aggregation. Here, PMo/ZIF-67-6 was calcinated under N2 at 600 °C for 4 h with no use of additional carbon sources (PMo/ZIF-67-6-6N). In the XRD pattern, the characteristic peaks indexing to Mo6Co6C (JCPDS 65-8115)5,9 can be seen (Fig. S5†) but with low intensity. Peaks corresponding to metal Co (JCPDS 15-0806) can also be observed. To solidly prove the existence of Co6Mo6C, we performed XRD tests using an X-ray powder diffractometer with high power. We can see the obvious diffraction peaks of Co6Mo6C in the pattern (Fig. S6†). The peaks located at 2θ = 43.1°, 40.5°, 35.8°, 32.8°, 47.2° and 73.7° can be indexed to the (511), (422), (331), (400), (440) and (822) planes of Co6Mo6C. The peaks located at 2θ = 44.2°, 51.5° and 75.8° should be indexed to the (111), (200) and (220) planes of metal Co. The SEM image of PMo/ZIF-67-6-6N shows a similar polyhedron morphology (Fig. 2b) to ZIF-67-6N (Fig. S7†). TEM images also show the regular polyhedral morphology of PMo/ZIF-67-6-6N (Fig. 2c and d). A magnified image shows the presence of small particles with sizes mainly below 20 nm (Fig. 2d and e). The high-resolution TEM (HRTEM) shows an interplanar distance of 0.21 nm (Fig. 2f), corresponding to the (511) plane of Mo6Co6C.33 Notably, there is a graphitized carbon (GC) coating on Mo6Co6C, which can protect Mo6Co6C from aggregation and benefits fast electron transfer.34 Energy-dispersive X-ray spectroscopy (EDS) elemental mapping confirms the uniform distribution of C, Co, Mo (Fig. 2g–j), P and N (Fig. S8†) through the polyhedrons. The above results verify the formation of Mo6Co6C and Co confined in uniform polyhedral carbon (Co6Mo6C–Co@C). The sizes of the Mo6Co6C particles are smaller than those obtained from carbothermic reduction (up to micrometers)6 and the anion-exchange method (about 50 nm).5 The formation of Mo6Co6C and Co from PMo/ZIF-67-6 can be explained as follows. In PMo/ZIF-67, one cage can only encapsulate one PMo12 due to the matched size of PMo12 and the ZIF-67 cage, thus giving a close distance between the Mo and Co sources in the nano-range. During the calcination under N2, the carbon source (2-MIM) can react with the adjacent Mo and Co to form Mo6Co6C. In addition, the number of Co atoms is more than that of Mo atoms in one cage unit, assuming that all cages of ZIF-67 were filled by PMo12 (using our trapping route, it is inevitable that there exists a portion of un-filled cages). So, the Co is in excess over Mo. The excessive Co can be reduced to form Co NPs. Under heating, carbon derived from 2-MIM can be simultaneously formed. Thus, Mo6Co6C and Co encapsulated into carbon can be formed during the calcination of PMo/ZIF-67 under N2 at lower temperatures. Based on ICP analysis, the content of Co is about 26% in PMo/ZIF-67-6. TG testing shows that the amount of carbon in PMo12/ZIF-67-6-6N is about 9.4% (Fig. S9†). Our “trapping” route is different from POMOF-based routes in the synthesis of carbides. NENU-5, formed from the simultaneous assembly of Cu2+, BTC and PMo12, is a suitable precursor for MoxC@C but not BTMCs@C,19 which should be related to the fact that Cu can not form the stable carbides. BTMCs confined in regular carbon polyhedrons are obtained using our route, while irregular carbon contained separated MTMCs were formed using the POMOF-based route.20 The ratio of late and early TMs is easy to control by adjusting the “trapping” parameters in our syntheses. Also, N-doped carbon can be formed through carbonizing 2-MIM, which is favourable for providing the active sites for catalysis.34
X-ray photoelectron spectroscopy (XPS) was carried out to further analyze the components of PMo/ZIF-67-6-6N. The peaks of Co, Mo, C, N and P elements are observed at 779 eV, 231 eV, 284 eV, 398 eV, and 134 eV (Fig. 3a). In the high-resolution XPS of the Mo 3d region (Fig. 3c), the peaks located at 232.2 and 228.7 eV are assigned to Mo 3d3/2 and Mo 3d5/2 of the Mo–C bond in Mo6Co6C,33 while the peaks at 235.8 eV and 232.7 eV are related to Mo6+ from the slight surface oxidation of carbides.34,35 This result is consistent with the Mo 3d peaks in Co6Mo6C nanoframe/graphene reported by He et al., for which Mo4+ and Mo6+ can be observed at 232.3 eV and 233.1 eV for 3d5/2, and 235.6 and 237.2 eV for 3d3/2. The peak for Mo–C (Mo2+) can be observed at 228.5 eV.33 The Co 2p3/2 core level spectrum can be fitted with four components corresponding to Co0, Co2+, Co3+ and satellites peaks. The Co2+ and Co3+ peaks are located at 781.5 eV and 780.2 eV for 2p3/2, and 798.3 eV and 796.4 eV for Co 2p1/2, respectively. The peaks corresponding to Co2+ are well consistent with those in Mo6Co6C. The presence of Co3+ should be ascribed to slight surface oxidation. The peaks at 777.6 and 792.0 eV are assigned to Co metal (Co0).36 The XPS analyses suggest the formation of cobalt molybdenum carbides and Co metal in PMo/ZIF-67-6-6N.33,36 The C 1s peak can be divided into seven sub-units, including C–P (285.31 eV), C–N (285.90 eV), C–C (284.62 eV), C–O (287.03 eV), C![[double bond, length as m-dash]](https://www.rsc.org/images/entities/char_e001.gif) O (288.23 eV), O–CO (290.13 eV), and π–π (291.90 eV).13 The peak of C-metal (Mo or Co) can not be observed because it has a low content of carbon components. In comparison with the previous reports,7,33 the C 1s peaks for O–CO, CO and C–O in PMo/ZIF-67-6-6N are much higher, which may be due to the surface oxidation of carbon and adsorption of oxygen-containing species during storage. The high-resolution N 1s peaks can be divided into three peaks, indexing to pyridinic-N (398.7 eV), pyrrolic-N (399.3 eV) and graphitic-N (402.3 eV) (Fig. S10a†).13 The N-doped carbon (N-carbon) should be from the pyrolysis of 2-MIM in PMo/ZIF-67-6. The XPS spectrum of P is shown in Fig. S10b.† After deconvolution, we can see the sub-peaks associated with P–O (13.4.2 eV), and P–C (133.2 eV).37 The peaks at 130.4 eV should be ascribed to P–Mo or P–Co.38,39 Based on the PMo12 structure, the P is surround by Mo, thus it can easily combine with Mo in the products due to the close distance between Mo and P. The presence of N and P doped carbon is favourable for providing active sites for catalysis. The XPS results indicate the formation of Mo6Co6C and Co, and their encapsulation by N-doped carbon. A comparison of cobalt carbide40 and molybdenum carbide41 shows a positive shift of the Co 2p and Mo 3d peaks of Mo6Co6C@C, indicating the presence of more electrons of Mo and Co in Mo6Co6C. The abundant electrons on the metal sites should be favourable for improving the catalytic activity.
O (288.23 eV), O–CO (290.13 eV), and π–π (291.90 eV).13 The peak of C-metal (Mo or Co) can not be observed because it has a low content of carbon components. In comparison with the previous reports,7,33 the C 1s peaks for O–CO, CO and C–O in PMo/ZIF-67-6-6N are much higher, which may be due to the surface oxidation of carbon and adsorption of oxygen-containing species during storage. The high-resolution N 1s peaks can be divided into three peaks, indexing to pyridinic-N (398.7 eV), pyrrolic-N (399.3 eV) and graphitic-N (402.3 eV) (Fig. S10a†).13 The N-doped carbon (N-carbon) should be from the pyrolysis of 2-MIM in PMo/ZIF-67-6. The XPS spectrum of P is shown in Fig. S10b.† After deconvolution, we can see the sub-peaks associated with P–O (13.4.2 eV), and P–C (133.2 eV).37 The peaks at 130.4 eV should be ascribed to P–Mo or P–Co.38,39 Based on the PMo12 structure, the P is surround by Mo, thus it can easily combine with Mo in the products due to the close distance between Mo and P. The presence of N and P doped carbon is favourable for providing active sites for catalysis. The XPS results indicate the formation of Mo6Co6C and Co, and their encapsulation by N-doped carbon. A comparison of cobalt carbide40 and molybdenum carbide41 shows a positive shift of the Co 2p and Mo 3d peaks of Mo6Co6C@C, indicating the presence of more electrons of Mo and Co in Mo6Co6C. The abundant electrons on the metal sites should be favourable for improving the catalytic activity.
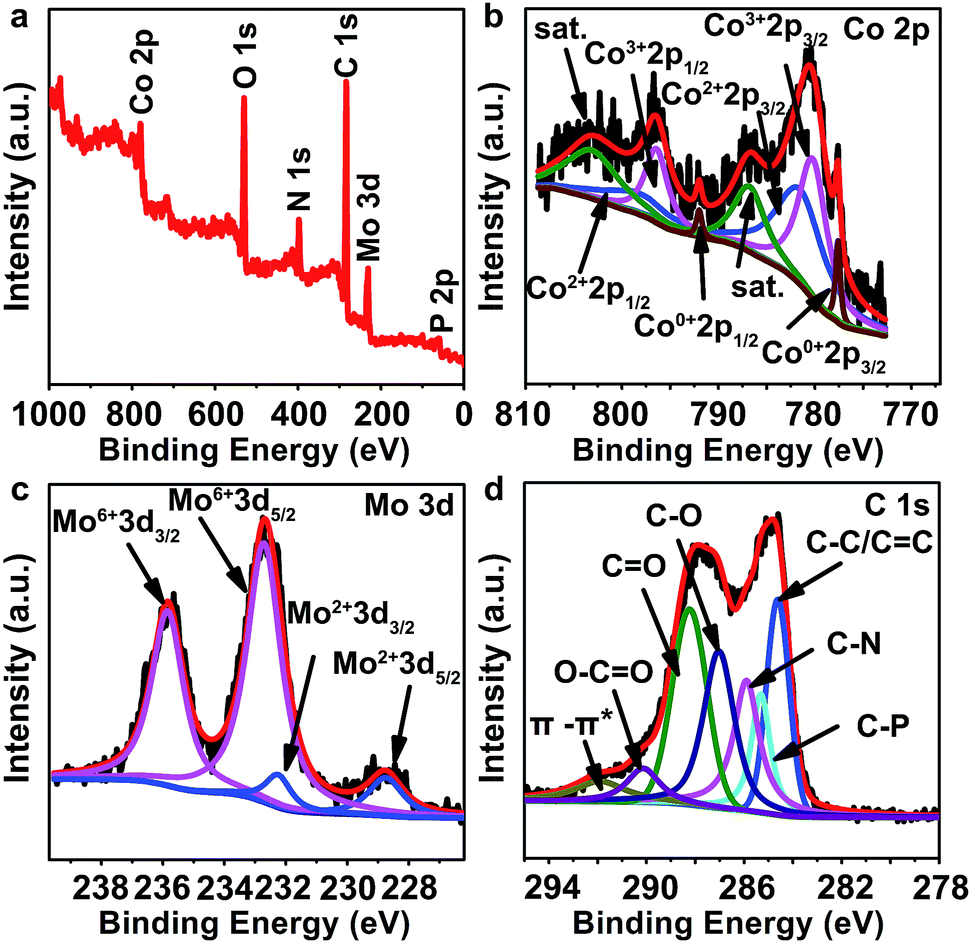 | ||
| Fig. 3 (a) XPS survey spectra and high-resolution spectra of (b) Co 2p, (c) Mo 3d, and (d) C 1s of PMo/ZIF-67-6-6N. | ||
The Co in PMo/ZIF-67-6-6N can be etched away in H2SO4 (denoted PMo/ZIF-67-6-6N-E or Co6Mo6C@C), as shown by XRD (Fig. S11†). The sample was analyzed using ICP, TEM, EDX and XPS. Based on the ICP test, the molar ratio of Co and Mo is about 1.08![[thin space (1/6-em)]](https://www.rsc.org/images/entities/char_2009.gif) :1, which is close to the theoretical value of 1:1 in Co6Mo6C. The value is lower than 2.98 (Co/Mo) for PMo/ZIF-67-6-6N, implying the removal of Co NPs. The ratio of Co/Mo from TEM-EDX is about 1.64 (Fig. S12†). The XPS test shows the ratio of Mo/Co is about 1.83 (Fig. S13†). The values from XPS and EDS are different to the theoretical value due to their surface analysis characteristics (for example, the intensity of photoelectrons is related to the concentration of the atoms, the average free path of the photoelectron, and the thickness of the carbon shell surrounding the particles). The TEM test of Co6Mo6C@C shows a uniform distribution of small particles encapsulated in carbon polyhedrons, which is similar to that of PMo/ZIF-67-6-6N. The HRTEM of one particle shows an interplanar distance of 0.21 nm, which is indexed to the (511) plane of Mo6Co6C (Fig. S12b–d†).33 The EDS mapping indicates a uniform distribution of small particles on the carbon polyhedrons (Fig. S12†). After removing Co NPs, the XPS spectra of Co 2p and Mo 3d are consistent with that of Mo6Co6C33 (Fig. S13†).
:1, which is close to the theoretical value of 1:1 in Co6Mo6C. The value is lower than 2.98 (Co/Mo) for PMo/ZIF-67-6-6N, implying the removal of Co NPs. The ratio of Co/Mo from TEM-EDX is about 1.64 (Fig. S12†). The XPS test shows the ratio of Mo/Co is about 1.83 (Fig. S13†). The values from XPS and EDS are different to the theoretical value due to their surface analysis characteristics (for example, the intensity of photoelectrons is related to the concentration of the atoms, the average free path of the photoelectron, and the thickness of the carbon shell surrounding the particles). The TEM test of Co6Mo6C@C shows a uniform distribution of small particles encapsulated in carbon polyhedrons, which is similar to that of PMo/ZIF-67-6-6N. The HRTEM of one particle shows an interplanar distance of 0.21 nm, which is indexed to the (511) plane of Mo6Co6C (Fig. S12b–d†).33 The EDS mapping indicates a uniform distribution of small particles on the carbon polyhedrons (Fig. S12†). After removing Co NPs, the XPS spectra of Co 2p and Mo 3d are consistent with that of Mo6Co6C33 (Fig. S13†).
By tuning the calcination temperature, the components can be tuned for Mo6Co6C–Co@C, Mo3Co3C–Co@C and Co@C (Fig. S14†). We found that a higher temperature is favourable for forming BTMCs with improved crystallinity. Specifically, the intensive diffraction of Mo3Co3C can be observed in PMo/ZIF-67-6-7N and PMo/ZIF-67-6-8N. The temperatures for the formation of Mo6Co6C and Mo3Co3C are much lower than in the carbothermic reduction route9 and other routes.5 The formation temperature of Mo(W)-based carbides is relative to the kind of carbon source and its contact degree (distance) with the metal source, according to previous reports. In general, the use of a carbon source that is in close contact with the metal source is favourable to give carbides at lower temperatures. For example, Mo6Co6C can be obtained via heating a mixture of carbon black and CoMoO4 under a N2 atmosphere at a higher temperature (about 1000 °C).9 We think that carbon black can not be in effective contact with CoMoO4 due to their larger sizes, thus resulting in the need for high synthetic temperatures. In another case, the carbon-containing molecules (F127 (ref. 42) and dicyandiamide43) were first combined with the Mo and Co sources. These carbon sources can be in effective contact with the metal precursor due to their polymer characteristics. As a result, BTMCs (Fe3W3C,42 Co6W6C43) can be formed at lower temperatures (below 800 °C). So, it is proposed that effective contact of the carbon source with the metal precursor should be key to forming carbides at lower temperatures. In our synthesis, 2-MIM in the ZIF-67 cages plays the role of the carbon source. PMo12 was confined into the cage. The Co source is coordinated with 2-MIM. So, the carbon source can be in effective contact with both the Mo and Co sources in the nano-range. Therefore, MoxCoxC can be obtained at a low temperature in our synthesis. A series of experiments demonstrate that the amount of PMo12 trapped in ZIF-67 increases with the increase of solvothermal time. Trapping too much PMo12 can result in damage to the structure of ZIF-67 (Fig. S15†), just like the blast of a balloon after filling it with too much gas. Also, the use of Na2MoO4 as a Mo source can result in damage to the ZIF-67 morphology (Fig. S16†), and formation of a mixture of MoC, Co2C and Mo3Co3C after calcination (Fig. S17†). These results are related to the weak interaction of Na2MoO4 with 2-MIM and its size which is not matched with that of the ZIF-67 cage.
The small size of BTMCs and their protection by carbon are favorable for their application as electrocatalysts. The activity for the HER was evaluated in a three-electrode system in 1 M KOH with IR correction. As shown in Fig. 4a, all samples exhibit obvious activity towards the HER, and the Pt/C shows outstanding behavior. As a comparison, the Co@carbon samples are also prepared via calcination of ZIF-67 at 600 (ZIF-67-6N). It is shown that the ZIF-67-6N needs an overpotential (η10) of 169 mV, whereas PMo/ZIF-67-6-6N only requires an η10 of 83 mV. At a current density of 100 mA cm−2, the overpotentials (η100) of ZIF-67-6N and PMo/ZIF-67-6-6N are 303 mV and 202 mV, respectively. It is obvious that PMo/ZIF-67-6-6N can greatly promote the HER activity. The activity of PMo/ZIF-67-6-6N is lower than that of noble metal-based catalysts (such as Ru/C44), but is comparable and even higher than that of most Mo- and Co-based catalysts at a high current density (Table S2†). The Tafel slope for PMo/ZIF-67-6-6N is about 50 mV dec−1, which is much lower than that of ZIF-67-6N (88 mV dec−1) (Fig. 4b), suggesting the Volmer–Heyrovsky mechanism of the HER on the catalyst.45 In an accelerated degradation test, there is no obvious loss of current density after 1000 cycles (Fig. 4c). In the chronoamperometry (CA) test (inset in Fig. 4c), the current density shows negligible change after operation for 22 h. The good stability is associated with protection by N-doped carbon. We further measured the electrochemical surface area (ECSA) of the catalysts based on the electrochemical double layer capacitance (EDLC, Cdl) (Fig. S18†). The Cdl value of PMo/ZIF-67-600 is 27.32 mF cm−2, which is higher than 15.58 mF cm−2 of ZIF-67-6N. The higher ECSA of PMo/ZIF-67-6-6N leads to its large exchange current density (0.67 mA cm−2). The HER activity of the catalysts in alkaline medium is related to their structure.46,47 Here, the synthetic parameters have a large effect on the structure, and, consequently, on the activity of the catalysts (Fig. S19, Tables S3–S6†). For example, a low trapping amount of PMo12 and low calcination temperature can result in a low amount of BTMC in the catalysts, thus decreasing the catalytic activity. In contrast, a high trapping amount of PMo12 and/or high calcination temperature causes an increase of the particle size of the carbides, thus giving low activity. The good activity of PMo/ZIF-67-6-6N should be ascribed to (1) the small size of BTMCs favoring the exposure of abundant available active sites,48 (2) the N-doped carbon coating for stabilizing the carbides,34 (3) the synergistic electronic effects between them,49 and (4) the porous structure facilitating the transfer of reagents (Fig. S20†). Also, PMo/ZIF-67-6-6N shows a work function (WF) of 5.68 eV (Fig. S21a†). The WF of ZIF-67-6N is about 5.78 eV (Fig. S21c†). PMo/ZIF-67-6-6N gives a work function closer to that of Pt (Fig. S21b†), which implies the enhanced trapping ability for electrons after surface activation.
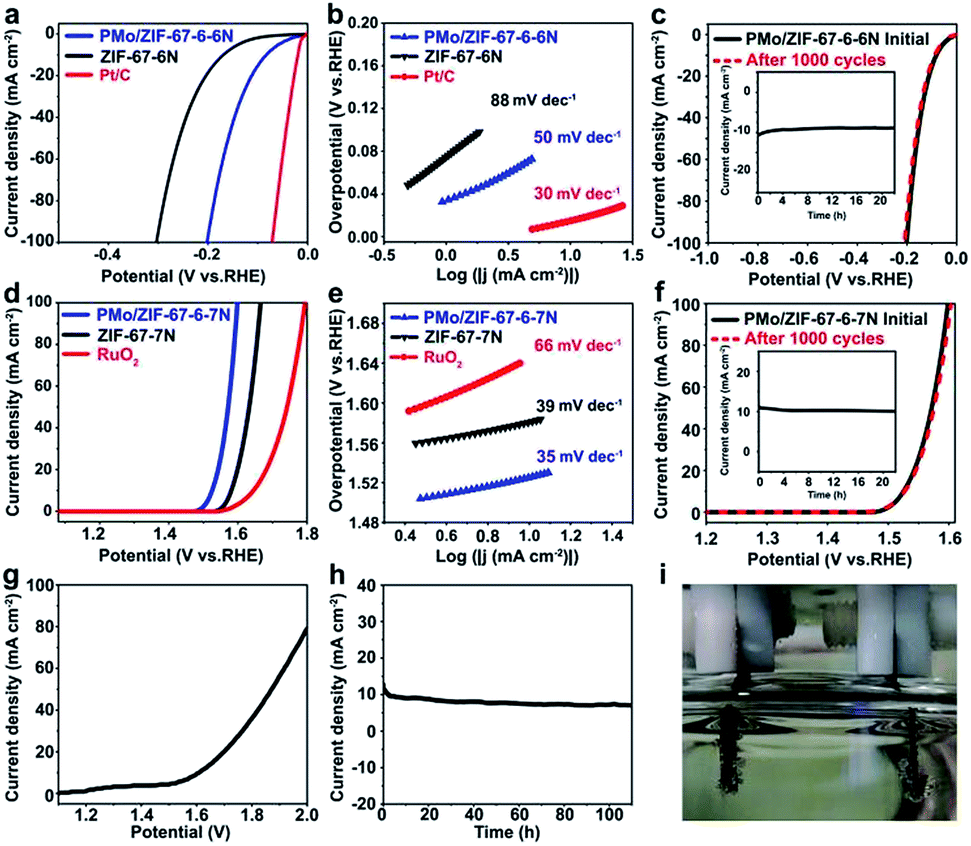 | ||
| Fig. 4 (a) Polarization curves and (b) Tafel plots of PMo/ZIF-67-6-6N, ZIF-67-6N and Pt/C in 1 M KOH for the HER at a scan rate of 5 mV s−1. (d) Polarization curves and (e) Tafel plots of PMo/ZIF-67-6-7N, ZIF-67-7N and RuO2 in 1 M KOH for the OER. (c) and (f) Polarization curves of PMo/ZIF-67-6-6N (HER) and PMo/ZIF-67-6-7N (OER) initially and after 1000 cycles of CV sweeping, respectively. Insets in (c) and (f) i–t curves for PMo/ZIF-67-6-6N and PMo/ZIF-67-6-7N over 22 h. (g) Polarization curve of PMo/ZIF-67-6-6N as the HER electrode and PMo/ZIF-67-6-7N as the OER electrode for overall water splitting in 1.0 M KOH. (h) The catalytic stability for overall water splitting at 1.67 V for 100 h. (i) A photograph of the overall water splitting cell. | ||
The HER catalysts need to match with the OER catalysts for overall water splitting. We further evaluated the OER activity of different catalysts. In this case, PMo/ZIF-67-6-7N from calcination of PMo/ZIF-67-6 at 700 °C exhibits superior activity to other catalysts for the OER (Fig. 4d and S22†). Co@carbon, prepared via calcination of ZIF-67 at 600 (ZIF-67-7N), and RuO2 are used as comparisons. The η10 and η100 for PMo/ZIF-67-6-7N are 295 and 370 mV, respectively, and are lower than 350 and 440 mV for ZIF-67-7N. The performance is also superior to that of RuO2, which has η10 of 324 mV and η100 of 564 mV. The Tafel plot of PMo/ZIF-67-6-7N is about 35 mV dec−1, while it is 39 mV dec−1 and 66 mV dec−1 for ZIF-67-7N and RuO2, respectively. PMo/ZIF-67-6-7N shows better performance than catalysts made using other synthetic parameters (Tables S8–S10†), and an activity that is better than or comparable to most OER catalysts (Table S11†). The Cdl value of PMo/ZIF-67-6-7N (47.4 mF cm−2) is larger than that of ZIF-67-7N (9.0 mF cm−2) (Fig. S23†). After 1000 CV cycles, there is no obvious change in the LSV (Fig. 4f). The i–t curve obtained with a stationary potential of 1.53 V for 22 h further identifies the good stability of PMo/ZIF-67-6-7N (inset in Fig. 4f). The activity of PMo/ZIF-67-6-7N (Mo3Co3C–Co@C) should be relative to the surface activation via surface oxidation and its specific structure.50 The faradaic efficiency (FE) values are about 100% for the HER and 93% for the OER at 60 min of electrolysis (Fig. S24†), and are close to the values in previous reports.14,51
The superiority of PMo/ZIF-67-6-6N for the HER and PMo/ZIF-67-6-7N for the OER is noteworthy. For the HER, carbides are considered as active components and the activity is relative to their type (structure). Tao et al. indicated that Mo6Co6C is more active than Mo3Co3C.33 The main carbide phase is Mo6Co6C in PMo/ZIF-67-6-6N and Mo3Co3C in PMo/ZIF-67-6-7N. So, PMo/ZIF-67-6-6N can show better activity than PMo/ZIF-67-6-7N. After etching away Co NPs, the catalytic performance of PMo/ZIF-67-6-6N for the HER shows no obvious change, verifying the main role of Mo6Co6C for the HER (Fig. S25†). While for the OER, the containing-oxygen species formed during the initial OER test are considered active components for the OER.52 For example, Xu et al. indicated that the NiOOH layer formed on nickel nitride during the OER test should be the active species.53 Similar phenomena can also be observed for Ni2P/Fe2P and Co4N systems.50,54 The difference in components of PMo/ZIF-67-6-6N and PMo/ZIF-67-6-7N (the kind of bi-metal carbides and content of Co etc.) will effect the formation and micro-structure of the containing-oxygen species, thus resulting in different catalytic abilities. In our catalyst, Co in the catalyst can easily be oxidized in KOH under the OER conditions to form CoOx species, which are verified to be active for the OER reaction.55 We performed XPS and XRD analyses for the catalyst after 40 CV cycles of OER testing. The XRD and XPS analyses show the existence of Co(OH)2 accompanied with the low peaks of the Co metal, indicating the oxidation of Co in PMo/ZIF-67-6-7N (Fig. S26 and S27†). Co(OH)2 can be oxidized during the OER to form CoOx species that are active species for the OER.56 Although the peaks corresponding to Mo species can not be seen in the XRD after OER testing, the XPS shows the presence of amorphous MoOx species (Fig. S28†).57 The presence of Mo species is important for enhanced OER activity. Typically, after etching away Co NPs from PMo/ZIF-67-6-7N, the catalytic activity of the materials (Mo3Co3C@carbon) decreases for the OER, indicating the contribution of Co NPs in PMo/ZIF-67-6-7N on the OER (Fig. S29†). In addition, the samples from calcination of ZIF-67-7N (Co@carbon) also show worse OER activity than PMo/ZIF-67-6-7N (Fig. 4). Zhang et al. indicated that the presence of W species is important to enhance the OER activity.58 Our study shows that Mo species are also important for the OER. The PMo/ZIF-67-6-7N composed of Co and Mo3Co3C shows better OER performance than Mo3Co3C@carbon and Co@carbon. The enhanced OER activity should be ascribed to the synergetic effect of Co and MoxCoxC on the formation of active species during OER testing.
A two-electrode system was assembled using PMo/ZIF-67-6-7N as the anode and PMo/ZIF-67-6-6N as the cathode in 1.0 M KOH for overall water splitting. As shown in Fig. 4g, to reach a current density of 10 mA cm−2, a potential of about 1.61 V is needed. This performance is comparable to most non-precious metal catalysts, for example, Ni/Mo2C-PC59 (Table S12†). The i–t curves also show the good stability of the electrodes after continual testing for 100 h (Fig. 4h). The bubbles are generated on both electrodes at this potential (Fig. 4i and S30†).
Conclusions
We have developed a trapping-based, non-POMOF strategy to combine PMo12 and ZIF-67 effectively. The size match of PMo12 and ZIF-67 enables effective contact between them, thus resulting in the formation of BTMCs under calcination. The N-doped carbon derived from 2-MIM ligands in the cages can protect particles from severe aggregation, thus obtaining MoxCoxC particles with much smaller sizes than those obtained from previous routes. Benefiting from the small size of the MoxCoxC particles and their protection by N-carbon, the materials could be used as superior catalysts for overall water splitting. The “trapping” route has superiority over POMOF-based routes in terms of acquiring MoxCoxC confined in uniform carbon with improved catalytic performance (Fig. S31–34†). The trapping-based route extends to the kinds of POM and MOF that can not be effectively combined via POMOF-based routes. It provides a new avenue to combine POMs and MOFs effectively, thus expanding their application in materials fields.Experimental procedures
Chemicals and the preparation of catalysts
Cobalt nitrate hexahydrate (Co(NO3)2·6H2O, 99 wt%) and 2-methylimidazole (C4H6N2, 98%) were obtained from Aladdin Ltd. Phosphomolybdic acid hydrate (H3Mo12O40P·xH2O, ≥99.9 wt%) was purchased from Sinopharm Chemical Reagent Co. Ltd. Methanol anhydrous (CH3OH, ≥99.5 wt%) was purchased from Tianjin Guangfu Fine Chemical Research Institute. Pt/C (20%) was obtained from Shanghai Hesen Electric Corporation. Sodium molybdate dihydrate (Na2MoO4·2H2O, ≥99 wt%) was obtained from Tianjin Kermel Chemical Reagent Co. Ltd. RuO2 was purchased from Alfa Aesar. There was no further purification of all the reagents and solvents.Synthesis of ZIF-67
The ZIF-67 polyhedrons were synthesized according to the previous report with tiny variations.60 Typically, 12 mmol of Co(NO3)2·6H2O was first dissolved in 300 mL of methanol. 2-MIM (48 mmol) was added into another 300 mL of methanol. The former solution was poured into the latter and then stirred for 6 h at room temperature (∼25 °C). The purple precipitate was collected via filtration and washed with methanol repeatedly. The as-prepared purple solids were dried at 60 °C in a vacuum oven for 12 h to give the final product ZIF-67.Synthesis of PMo/ZIF-67-6
The trapping of PMo12 into ZIF-67 was performed in methanol solvent under solvothermal conditions, and the corresponding samples were denoted PMo/ZIF-67-X (X represents the solvothermal time). A typical sample, PMo/ZIF-67-6, was obtained through the following procedure. 0.452 mmol of ZIF-67 (0.1 g) was dispersed in 30 mL of methanol and this was stirred at 30 °C for 12 h (solution A). Stirring for long time at this temperance can cause the partial disassembly of Co2+ and 2-MIM from ZIF-67, thus giving defects to open the windows of the pores. H3PMo12O40 (0.05 g, 0.330 mmol) was dissolved in 30 mL of methanol (solution B). Solution B was poured into solution A quickly under constant stirring. The mixture was stirred for 30 min and then transferred into a 100 mL Teflon-lined autoclave, and this was treated at 100 °C for 6 h. The resulting solid was isolated via filtration, and was washed with methanol at least three times. The solid was dried at 60 °C in a vacuum oven for 12 h (denoted PMo/ZIF-67-6, where the 6 represents the solvothermal time). The synthesis procedure for the other control samples is given in the ESI.†Synthesis of PMo/ZIF-67-6-yN
In a typical procedure, PMo/ZIF-67-6 (50 mg) was placed in a porcelain boat. The boat was heated from room temperature to 600 °C at a rate of 2 °C min−1 and held at 600 °C for 4 hours under a N2 atmosphere. After cooling down to room temperature naturally, a black power could form, which was denoted PMo/ZIF-67-6-6N (6N representing calcination at 600 °C under N2). PMo/ZIF-67-6 was also calcined at 500, 700, and 800 °C under a N2 atmosphere to tune the components and micro-structures of the samples. The samples were named PMo/ZIF-67-6-5N, PMo/ZIF-67-6-7N, and PMo/ZIF-67-6-8N, respectively.Characterization of the products
Scanning electron microscopy (SEM) tests were carried out using a Hitachi S-4800 instrument at an accelerating voltage of 5 kV. The transmission electron microscopy (TEM) and high-resolution TEM (HRTEM) was performed using a JEM-2100 electron microscope (JEOL, Japan) with an acceleration voltage of 200 kV. The EDS mapping was recorded using EM-F200 (TF-HR) equipped with JED-2300T Large Angle Dual windowless SDD-EDS, and FEI TF20 equipped with an Oxford energy spectrometer. X-ray diffraction (XRD) patterns were recorded using a Bruke D8 equipped with Cu-Kα radiation (λ = 1.5406 Å), and a Rigaku D/max-2600/PC X-ray diffractometer (XRD, Cu-Kα radiation). X-ray photon spectroscopy (XPS) analysis was performed using a VG ESCALABMK II with Mg-Kα radiation (1253.6 eV). A PE Spectrum One B IR spectrometer was used to record the fourier transform infrared spectra (FT-IR) of the samples in the region 400–4000 cm−1 with KBr pellets. Thermogravimetric (TG) analysis was performed using a TA Q600 thermal analyzer under a stream of air with a heating rate of 10 °C min−1. Nitrogen adsorption–desorption isotherms were measured at 77 K on a Quantachrome autosorb iQ/ASiQwin. The Brunauer–Emmett–Teller (BET) method was used to calculate the specific surface area and the Density-Functional-Theory (DFT) model was used to calculate the pore size distribution. Ahead of the experiment, samples were degassed at 150 °C for 6 h under vacuum. UV-vis absorption spectra were recorded using UV-1600/1800B at room temperature. The ICP test was performed using an ICP-OES8000 analyzer.The work function was calculated based on the Scanning Kelvin Probe (SKP) test (SKP5050 system, Scotland), which was performed under normal laboratory conditions (in an ambient atmosphere). The reference electrode used in the test was a gold electrode. The work function (ϕ) was calculated using the following formula:
Electrochemical measurements
The electrochemical experiments for the HER and OER were conducted using a BAS100B electrochemical workstation at room temperature. The measurements were taken using a standard three electrode system in 1 M KOH. A glassy carbon electrode (GCE, 1 mm in diameter) was used as the working electrode, an Ag/AgCl electrode (filled with saturated KCl) and a graphite rod were used as the reference electrode and counter electrodes, respectively. Prior to the measurements, three kinds of alumina powder (1.5 μm, 0.5 μm and 0.05 μm) were used to polish the GCE. To obtain the catalyst ink, 5 mg of catalyst was dispersed in 1 mL water/ethanol mixture (v/v = 1:4). Then 20 μL Nafion (5 wt%) was added into the mixture. A homogeneous catalyst ink was formed after ultrasonication. The well-dispersed ink (10 μL) was pipetted onto the GCE and dried under a heating lamp. The loading of the catalyst was 0.708 mg cm−2. A commercial 20% Pt/C catalyst was chosen as a reference. Linear sweep voltammetry (LSV) was performed on the GCE coated with catalyst under 1600 rpm at a rate of 5 mV s−1 with IR compensation. The Tafel data were fitted according to the Tafel equation η = blog(j) + α (j: current density, and b: Tafel slope). The electrochemical active surface areas (ESCAs) of the modified electrodes were calculated based on the double-layer capacitor in a potential window 0.1–0.2 V (HER) and 1.2–1.3 V (OER) vs. RHE. The scan rates of the cyclic voltammograms (CVs) were varied from 40 to 220 mV s−1. Chronoamperometry (CA) tests were carried out at −100 mV vs. RHE (HER) and 1.53 V (OER) vs. RHE. 1000 CV cycles at a scan rate of 100 mV s−1 were performed to evaluate the stability of the catalysts. There was no change in pH before and after the test. In order to convert the potential to the reversible hydrogen electrode (RHE), the Nernst equation was used: ERHE = EAg/AgCl + 0.059 pH + EθAg/AgCl. The pH of the electrolyte is 13.96.
The faradaic efficiency (FE) for HER and OER was calculated by comparing the experimentally determined and theoretically calculated amounts of H2 and O2. In the test, a certain amount of catalyst ink was dropped onto Ni foam (2.53 mg cm−2) and dried in air as the electrode. Potentiostatic electrolysis was performed at a current density of 100 mA cm2− for 60 minutes in a home-made airtight H-type electrolytic cell. The amount of gas generated was analyzed using gas chromatography (GC). The theoretical amount of H2 was calculated as follows:
 485 C mol−1), and Z is the number of electrons transferred during water splitting (for HER, Z is 2). The calculation of the theoretical amount of O2 is the same as that for H2 except Z = 4.
In overall water splitting tests, 6 mg of PMo/ZIF-67-6-6N, 1 mg carbon black and 40 μL Nafion (5 wt%) were dispersed in 1 mL of a mixture of water and ethanol (v/v = 1:4) and this was treated for 30 min under ultrasound to form a homogeneous ink. 0.5 mL of catalyst ink was smeared onto Ni foam (1 cm × 1 cm). The Ni foam covered with PMo/ZIF-67-6-6N was dried at 60 °C for 12 h in a vacuum oven and afterwards this worked as the cathode (mass loading: 2.53 mg cm−2). The anode was prepared in the same way through the replacement of PMo/ZIF-67-6-6N with PMo/ZIF-67-6-7N.
Conflicts of interest
There are no conflicts to declare.Acknowledgements
We gratefully acknowledge the support of this research by the National Natural Science Foundation of China (21631004 and 21571054).Notes and references
- S. Yao, X. Zhang, W. Zhou, R. Gao, W. Xu, Y. Ye, L. Lin, X. Wen, P. Liu, B. Chen, E. Crumlin, J. Guo, Z. Zuo, W. Li, J. Xie, L. Lu, C. J. Kiely, L. Gu, C. Shi, J. A. Rodriguez and D. Ma1, Science, 2017, 357, 389–393 CrossRef CAS PubMed.
- L. Lin, W. Zhou, R. Gao, S. Yao, X. Zhang, W. Xu, S. Zheng, Z. Jiang, Q. Yu, Y.-W. Li, C. Shi, X.-D. Wen and D. Ma, Nature, 2017, 544, 80–83 CrossRef CAS PubMed.
- L. Zhong, F. Yu, Y. An, Y. Zhao, Y. Sun, Z. Li, T. Lin, Y. Lin, X. Qi, Y. Dai, L. Gu, J. Hu, S. Jin, Q. Shen and H. Wang, Nature, 2016, 538, 84–87 CrossRef CAS PubMed.
- M. Y. Zu, P. F. Liu, C. Wang, Y. Wang, L. R. Zheng, B. Zhang, H. Zhao and H. G. Yang, ACS Energy Lett., 2018, 3, 78–84 CrossRef CAS.
- X. Ma, H. Meng, M. Cai and P. K. Shen, J. Am. Chem. Soc., 2012, 134, 1954–1957 CrossRef CAS PubMed.
- A. A. Smirnov, Z. Geng, S. A. Khromova, S. G. Zavarukhin, O. A. Bulavchenko, A. A. Saraev, V. V. Kaichev, D. Y. Ermakov and V. A. Yakovlev, J. Catal., 2017, 354, 61–77 CrossRef CAS.
- L. Zhao, K. Fang, D. Jiang, D. Li and Y. Sun, Catal. Today, 2010, 158, 490–495 CrossRef CAS.
- Z. Cui, Y. Li, G. Fu, X. Li and J. B. Goodenough, Adv. Mater., 2017, 29, 1702385 CrossRef PubMed.
- Y. N. Regmi and B. M. Leonard, Chem. Mater., 2014, 26, 2609–2616 CrossRef CAS.
- J. F. Keggin, Nature, 1993, 131, 908–909 CrossRef.
- M. T. Pope and A. Müller, Angew. Chem., Int. Ed., 1991, 30, 34–48 ( Angew. Chem. , 1991 , 103 , 56 ) CrossRef.
- H. Yan, C. Tian, L. Sun, B. Wang, L. Wang, J. Yin, A. Wu and H. Fu, Energy Environ. Sci., 2014, 7, 1939–1949 CAS.
- H. Yan, C. Tian, L. Wang, A. Wu, M. Meng, L. Zhao and H. Fu, Angew. Chem., Int. Ed., 2015, 54, 6325–6329 CrossRef CAS PubMed.
- H. Yan, Y. Xie, Y. Jiao, A. Wu, C. Tian, X. Zhang, L. Wang and H. Fu, Adv. Mater., 2017, 30, 1704156 CrossRef PubMed.
- (a) H.-C. Zhou, J. R. Long and O. M. Yaghi, Chem. Rev., 2012, 112, 673–674 CrossRef CAS PubMed; (b) L. Jiao, Y.-X. Zhou and H.-L. Jiang, Chem. Sci., 2016, 7, 1690–1695 RSC.
- (a) S. Dang, Q.-L. Zhu and Q. Xu, Nat. Rev. Mater., 2017, 3, 17075 CrossRef; (b) M. Carboni, C. W. Abney, S. Liu and W. Lin, Chem. Sci., 2013, 4, 2396–2402 RSC; (c) C. X. Yu, Z. C. Shao and H. W. Hou, Chem. Sci., 2017, 8, 7611–7619 RSC.
- P.-Q. Liao, N.-Y. Huang, W.-X. Zhang, J.-P. Zhang and X.-M. Chen, Science, 2017, 356, 1193–1196 CrossRef CAS PubMed.
- C. R. Kim, T. Uemura and S. Kitagawa, Chem. Soc. Rev., 2016, 45, 3828–3845 RSC.
- H. B. Wu, B. Y. Xia, L. Yu, X. Y. Yu and X. W. Lou, Nat. Commun., 2015, 6, 6512 CrossRef CAS PubMed.
- J.-S. Li, Y.-J. Tang, C.-H. Liu, S.-L. Li, R.-H. Li, L.-Z. Dong, Z.-H. Dai, J.-C. Bao and Y.-Q. Lan, J. Mater. Chem. A, 2016, 4, 1202–1207 CAS.
- K. S. Park, Z. Ni, A. P. Côté, J. Y. Choi, R. Huang, F. J. U. Romo, H. K. Chae, M. O’Keeffe and O. M. Yaghi, Proc. Natl. Acad. Sci. U. S. A., 2006, 103, 10186–10191 CrossRef CAS PubMed.
- J. J. Walsh, A. M. Bond, R. J. Forster and T. E. Keyes, Coord. Chem. Rev., 2016, 306, 217–234 CrossRef CAS.
- S. Ling and B. Slater, Chem. Sci., 2016, 7, 4706–4712 RSC.
- P. Ghosh, Y. J. Colón and R. Q. Snurr, Chem. Commun., 2014, 50, 11329–11331 RSC.
- M. Meng, H. Yan, Y. Jiao, A. Wu, X. Zhang, R. Wang and C. Tian, RSC Adv., 2016, 6, 29303–29307 RSC.
- E. Nakouzi and O. Steinbock, Mater. Sci., 2016, 2, 1601144 Search PubMed.
- J. Yang, F. Zhang, X. Wang, D. He, G. Wu, Q. Yang, X. Hong, Y. Wu and Y. Li, Angew. Chem., Int. Ed., 2016, 55, 12854–12858 CrossRef CAS PubMed.
- Y.-T. Xu, X. Xiao, Z.-M. Ye, S. Zhao, R. Shen, C.-T. He, J.-P. Zhang, Y. Li and X.-M. Chen, J. Am. Chem. Soc., 2017, 139, 5285–5288 CrossRef CAS PubMed.
- G. Lu, S. Li, Z. Guo, O. K. Farha, B. G. Hauser, X. Qi, Y. Wang, X. Wang, S. Han, X. Liu, J. S. DuChene, H. Zhang, Q. Zhang, X. Chen, J. Ma, S. C. J. Loo, W. D. Wei, Y. Yang, J. T. Hupp and F. Huo, Nat. Chem., 2012, 4, 310–316 CrossRef CAS PubMed.
- H.-C. Wu, T.-C. Chen, N.-C. Lai, C.-M. Yang, J.-H. Wu, Y.-C. Chen, J.-F. Lee and C.-S. Chen, Nanoscale, 2015, 7, 16848–16859 RSC.
- S. Mukhopadhyay, J. Debgupta, C. Singh, A. Kar and S. K. Das, Angew. Chem., 2018, 130, 1936–1941 CrossRef.
- S. Gao, X. Yang, M.-J. Wei, S. Liang, H.-Y. Zang, H.-Q. Tan, Y.-H. Wang and Y.-G. Li, New J. Chem., 2018, 42, 198–203 RSC.
- C. He and J. Tao, J. Catal., 2017, 347, 63–71 CrossRef CAS.
- Y. Liu, G. Yu, G.-D. Li, Y. Sun, T. Asefa, W. Chen and X. Zou, Angew. Chem., Int. Ed., 2015, 54, 10752–10757 CrossRef CAS PubMed.
- Y.-J. Tang, Y. Wang, X.-L. Wang, S.-L. Li, W. Huang, L.-Z. Dong, C.-H. Liu, Y.-F. Li and Y.-Q. Lan, Adv. Energy Mater., 2016, 6, 1600116 CrossRef.
- M. Kuang, Q. H. Wang, P. Han and G. F. Zheng, Adv. Energy Mater., 2017, 1700193 CrossRef.
- Y.-J. Tang, M.-R. Gao, C.-H. Liu, S.-L. Li, H.-L. Jiang, Y.-Q. Lan, M. Han and S.-H. Yu, Angew. Chem., Int. Ed., 2015, 54, 12928–12932 CrossRef CAS PubMed.
- Y.-Y. Ma, C.-X. Wu, X.-J. Feng, H.-Q. Tan, L.-K. Yan, Y. Liu, Z.-H. Kang, E.-B. Wang and Y.-G. Li, Energy Environ. Sci., 2017, 10, 788–798 CAS.
- H. J. Yan, Y. Q. Jiao, A. P. Wu, C. G. Tian, X. M. Zhang, L. Wang, Z. Y. Ren and H. G. Fu, Chem. Commun., 2016, 52, 9530–9533 RSC.
- X. Fan, Z. Peng, R. Ye, H. Zhou and X. Guo, ACS Nano, 2015, 9, 7407–7418 CrossRef CAS PubMed.
- W. Cui, N. Cheng, Q. Liu, C. Ge, A. M. Asiri and X. Sun, ACS Catal., 2014, 4, 2658–2661 CrossRef CAS.
- L. Song, T. Wang, Y. L. Wang, H. R. Xue, X. L. Fan, H. Guo, W. Xia, H. Gong and J. P. He, ACS Appl. Mater. Interfaces, 2017, 9, 3713–3722 CAS.
- Y. P. Liu, G.-D. Li, L. Yuan, L. Ge, H. Ding, D. J. Wang and X. X. Zou, Nanoscale, 2015, 7, 3130–3136 RSC.
- Y. Zheng, Y. Jiao, Y. Zhu, L. H. Li, Y. Han, Y. Chen, M. Jaroniec and S.-Z. Qiao, J. Am. Chem. Soc., 2016, 138, 16174–16181 CrossRef CAS PubMed.
- P. Jiang, Q. Liu, Y. Liang, J. Tian, A. M. Asiri and X. Sun, Angew. Chem., Int. Ed., 2014, 53, 12855–12859 CrossRef CAS PubMed.
- Y. Zheng, Y. Jiao, S. Z. Qiao and A. Vasileff, Angew. Chem., Int. Ed., 2018, 57 DOI:10.1002/anie.201710556.
- T. Ling, D.-Y. Yan, H. Wang, Y. Jiao, Z. P. Hu, Y. Zheng, L. Zheng, J. Mao, H. Liu, X.-W. Du, M. Jaroniec and S.-Z. Qiao, Nat. Commun., 2017, 8, 1509 CrossRef PubMed.
- J.-S. Li, Y. Wang, C.-H. Liu, S.-L. Li, Y.-G. Wang, L.-Z. Dong, Z.-H. Dai, Y.-F. Li and Y.-Q. Lan, Nat. Commun., 2016, 7, 11204 CrossRef CAS PubMed.
- J. Deng, P. Ren, D. Deng and X. Bao, Angew. Chem., Int. Ed., 2015, 54, 2100–2104 CrossRef CAS PubMed.
- P. Chen, K. Xu, Z. Fang, Y. Tong, J. Wu, X. Lu, X. Peng, H. Ding, C. Wu and Y. Xie, Angew. Chem., Int. Ed., 2015, 54, 14710–14714 CrossRef CAS PubMed.
- Y. P. Zhu, Y. Jing, A. Vasileff, T. Heine and S.-Z. Qiao, Adv. Energy Mater., 2017, 1602928 CrossRef.
- S. Jin, Are Metal Chalcogenides, ACS Energy Lett., 2017, 2, 1937–1938 CrossRef.
- K. Xu, P. Z. Chen, X. L. Li, Y. Tong, H. Ding, X. J. Wu, W. S. Chu, Z. M. Peng, C. Z. Wu and Y. Xie, J. Am. Chem. Soc., 2015, 137, 4119–4125 CrossRef CAS PubMed.
- P. F. Liu, X. Li, S. Yang, M. Y. Zu, P. Liu, B. Zhang, L. R. Zheng, H. J. Zhao and H. G. Yang, ACS Energy Lett., 2017, 2, 2257–2263 CrossRef CAS.
- K. L. Liu, F. M. Wang, P. He, T. A. Shifa, Z. X. Wang, Z. Z. Cheng, X. Y. Zhan and J. He, Adv. Energy Mater., 2018, 1703290 CrossRef.
- C. X. Guo, Y. Zheng, J. Y. Ran, F. X. Xie, M. Jaroniec and S.-Z. Qiao, Angew. Chem., Int. Ed., 2017, 56, 8539–8543 CrossRef CAS PubMed.
- M. Anwar, C. A. Hogarth and R. Bulpett, J. Mater. Sci., 1989, 24, 3087–3090 CrossRef CAS.
- B. Zhang, X. Zheng, O. Voznyy, R. Comin, M. Bajdich, M. García-Melchor, L. Han, J. Xu, M. Liu, L. Zheng, F. P. G. de Arquer, C. T. Dinh, F. Fan, M. Yuan, E. Yassitepe, N. Chen, T. Regier, P. Liu, Y. Li, P. D. Luna, A. Janmohamed, H. L. Xin, H. Yang, A. Vojvodic and E. H. Sargent, Science, 2006, 352, 333–337 CrossRef PubMed.
- Z.-Y. Yu, Y. Duan, M.-R. Gao, C.-C. Lang, Y.-R. Zheng and S.-H. Yu, Chem. Sci., 2017, 8, 968–973 RSC.
- K.-Y. A. Lin and H.-A. Chang, J. Taiwan Inst. Chem. Eng., 2015, 53, 40–45 CrossRef CAS.
Footnote |
| † Electronic supplementary information (ESI) available. See DOI: 10.1039/c8sc01454j |
| This journal is © The Royal Society of Chemistry 2018 |