
 Open Access Article
 This Open Access Article is licensed under a
 Creative Commons Attribution 3.0 Unported Licence
Tricarbocyanine N-triazoles: the scaffold-of-choice for long-term near-infrared imaging of immune cells in vivo†
Richard J.
Mellanby‡
*ab,
Jamie I.
Scott‡
a,
Iris
Mair
a,
Antonio
Fernandez
 a,
Louise
Saul
b,
Jochen
Arlt
c,
Monica
Moral
d and
Marc
Vendrell
*a
a,
Louise
Saul
b,
Jochen
Arlt
c,
Monica
Moral
d and
Marc
Vendrell
*a
aMedical Research Council Centre for Inflammation Research, The University of Edinburgh, 47 Little France Crescent, EH16 4TJ Edinburgh, UK. E-mail: marc.vendrell@ed.ac.uk
bRoyal (Dick) School of Veterinary Studies, The Roslin Institute, Division of Veterinary Clinical Studies, The University of Edinburgh, Hospital for Small Animals, Easter Bush Veterinary Centre, EH25 9RG Roslin, UK. E-mail: richard.mellanby@ed.ac.uk
cSchool of Physics and Astronomy, The University of Edinburgh, James Clerk Maxwell Building, Peter Guthrie Tait Road, EH9 3FD Edinburgh, UK
dRenewable Energy Research Institute, University of Castilla-La Mancha, 02071 Albacete, Spain
First published on 8th August 2018
Abstract
Herein tricarbocyanine N-triazoles are first described as a rationally-designed near-infrared (NIR) structure overcoming the brightness and photostability limitations of tricarbocyanines for long-term in vivo imaging. The straightforward synthetic approach and the wide availability of alkynes makes this strategy a versatile methodology for the preparation of highly stable N-substituted tricarbocyanines. Furthermore, we validated CIR38M as a non-transferable marker to monitor the fate of therapeutic T cells non-invasively in vivo, showing enhanced performance over conventional NIR fluorophores (i.e.DiR, IR800CW and indocyanine green) as well as compatibility with human cells for translational studies. CIR38M is able to track over time smaller numbers of T cells than current NIR agents, and to visualise antigen-driven accumulation of immune cells at specific sites in vivo. This chemical technology will improve longitudinal imaging studies to assess the efficacy of cell-based immunotherapies in preclinical models and in human samples.
Introduction
In vivo optical imaging has revolutionised our ability to visualise biological processes with high resolution in intact organisms. Most in vivo imaging fluorophores rely on near-infrared (NIR) chemical scaffolds as they allow deep penetration with minimal photodamage and low tissue autofluorescence.1,2 Many NIR fluorophores have been described for bioimaging applications, ranging from analyte detection to image-guided surgery.3–10 Choi, Henary and Frangioni among others recently exploited the diversification of NIR cyanine fluorophores for structure-inherent targeting of different tissues.11–13 Zwitterionic heptamethine cyanine analogues have also been recently described as NIR agents with enhanced capabilities for cell, tissue and in vivo imaging.14–16 Among these structures, the sulfonated heptamethine cyanine dye Indocyanine Green (ICG) is the only clinically-approved NIR dye for studies in humans.17 The structurally-related IR800CW fluorophores have recently entered clinical trials as biomarker-labelling molecules for fluorescence-assisted surgery.18 In both ICG and IR800CW, the potential aggregation of the heptamethine cyanine scaffold is minimised by the incorporation of negatively-charged groups (i.e. sulfonates); however, these preclude cell uptake and impede long-term tracking of small populations of cells in vivo. As an alternative, tricarbocyanine N-amines have been reported as cell-permeable NIR fluorophores, and they can be prepared via nucleophilic substitution of the IR780 tricarbocyanine core with amines (1, Fig. 1).19–22 Their straightforward chemistry has enabled their adaptation to diversity-oriented studies,23–26 but most tricarbocyanines N-amines show low quantum yields and rapid photodegradation, which compromise their application for long-term NIR fluorescence imaging. We addressed these shortcomings by rationally designing tricarbocyanine N-triazoles as a new family of bright, photostable and cell-permeable NIR fluorophores containing neutral triazole groups. We envisaged that the electron delocalization in the triazole ring would reduce the electron density of N-substituted groups, thus minimizing intramolecular quenching and photodegradation of the tricarbocyanine core. To date, tricarbocyanine N-triazoles had not been isolated because of the lack of synthetic approaches that were compatible with the relatively unstable intermediate tricarbocyanine azide. Herein we describe a synthetic approach for the isolation of tricarbocyanine N-triazoles in reasonable yields and high purities.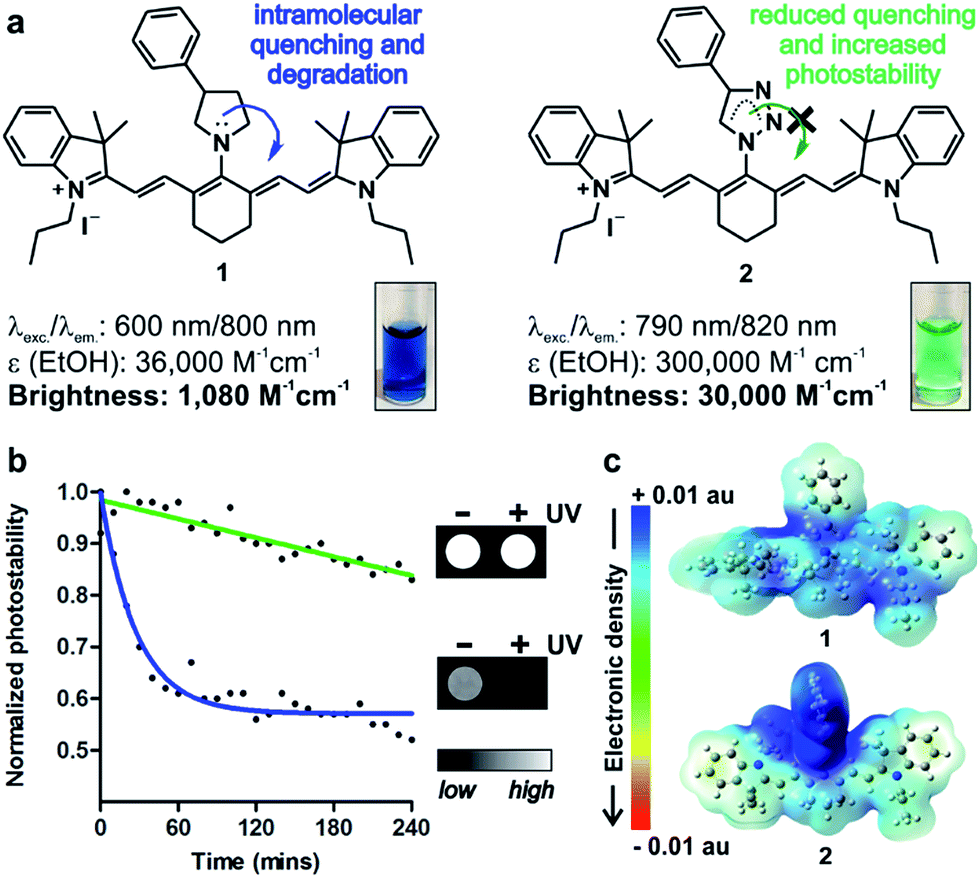 | ||
| Fig. 1 (a) Chemical structures and properties of isosteric tricarbocyanine N-amines (1) and N-triazoles (2) in EtOH. (Inset) Absorbance pictograms of compounds 1 and 2 (10 μM). (b) Photostability analysis of compounds 1 (blue) and 2 (green) (both at 50 μM in PBS) under continuous light irradiation. Solid lines correspond to one phase exponential decay regressions for both sets of values. (Inset) NIR fluorescence pictograms of compounds 1 and 2 (10 μM in PBS) before and after UV light irradiation. (c) Pseudo-coloured electronic distribution maps for compounds 1 (top) and 2 (bottom) in their fundamental state. | ||
Results and discussion
Design and synthesis of tricarbocyanine N-triazoles
Nucleophilic substitution of IR780 with sodium azide in DMF![[thin space (1/6-em)]](https://www.rsc.org/images/entities/char_2009.gif) :H2O (1:1) followed by rapid DCM extraction and 1,3-Huisgen copper-catalysed cycloaddition rendered tricarbocyanine N-triazoles (2, Fig. 1 and 2). Triazole derivatives display superior spectral properties when compared to their isosteric tricarbocyanine N-amines, despite only differing in two nitrogen atoms being replaced by methylene groups. In addition to red-shifted excitation and emission wavelengths, tricarbocyanine N-triazoles exhibit higher extinction coefficients and quantum yields (i.e. 3% for 1, 10% for 2) with 30-fold increase in brightness and remarkably enhanced photostability (Fig. 1). To analyse the differential behaviour of isosteric amine (1) and triazole (2) fluorophores, we determined their electron density distributions and transitions with Gaussian 09 (Fig. 1 and S1†).27
:H2O (1:1) followed by rapid DCM extraction and 1,3-Huisgen copper-catalysed cycloaddition rendered tricarbocyanine N-triazoles (2, Fig. 1 and 2). Triazole derivatives display superior spectral properties when compared to their isosteric tricarbocyanine N-amines, despite only differing in two nitrogen atoms being replaced by methylene groups. In addition to red-shifted excitation and emission wavelengths, tricarbocyanine N-triazoles exhibit higher extinction coefficients and quantum yields (i.e. 3% for 1, 10% for 2) with 30-fold increase in brightness and remarkably enhanced photostability (Fig. 1). To analyse the differential behaviour of isosteric amine (1) and triazole (2) fluorophores, we determined their electron density distributions and transitions with Gaussian 09 (Fig. 1 and S1†).27
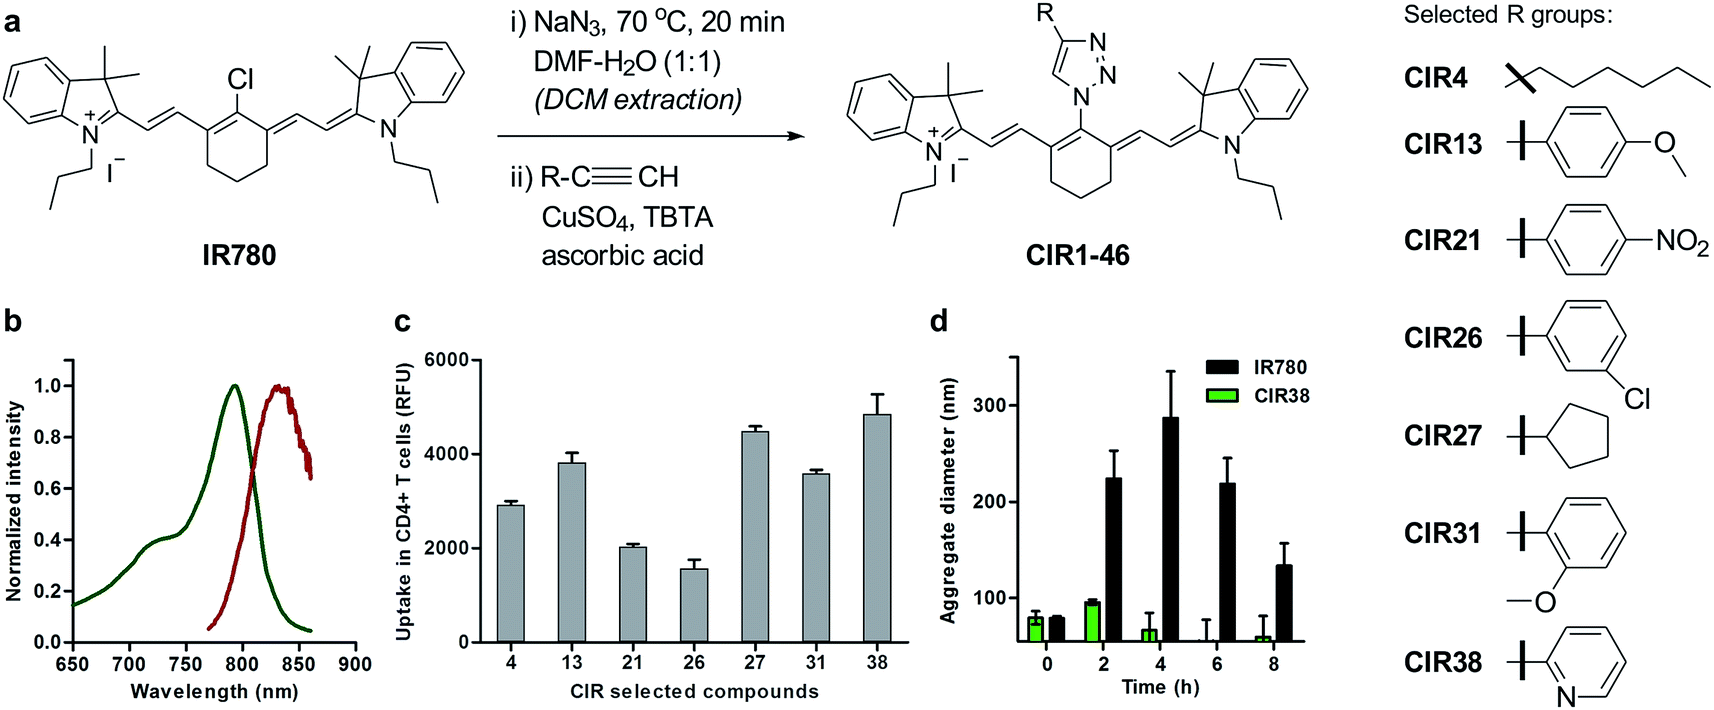 | ||
| Fig. 2 Chemical synthesis of CIR fluorophores. (a) Structures of selected CIR fluorophores (see Table S2†). (b) Absorbance (green) and emission (red) spectra of CIR38 as a representative CIR fluorophore. (c) Fluorescence NIR intensity of selected CIR fluorophores upon incubation with CD4+ T cells (5 × 10⁵ cells, 10 μM PBS, λexc.: 790 nm; λem.: 820 nm). Values are represented as means ± s.e.m (n = 3). (d) Time-course analysis of the mean aggregate size of IR780 and CIR38 in aqueous media (100 μM PBS) determined by dynamic light scattering at r.t. for up to 8 h. Values are represented as means ± s.e.m (n = 3). | ||
These studies highlight the phenyltriazole group as the most electron-deficient region within 2 (Fig. 1c), minimising any intramolecular quenching. Electronic transitions for both tricarbocyanines 1 and 2 involve charge transfer processes from the heptamethine core to the phenylpyrrolidine in compound 1 (i.e. α-HOMO to α-LUMO and β-HOMO to β-SOMO) or to the phenyltriazole in compound 2 (i.e. β-HOMO to β-SOMO) (Table S1†). However, the bridgehead nitrogen atom of the pyrrolidine ring in compound 1 shows significantly higher contribution to α-LUMO (6%) and β-SOMO (6%) than the corresponding nitrogen atom of the triazole ring in compound 2 (2% to its β-SOMO) (Fig. S1†). This observation confirms our hypothesis that the reduced electron density at the bridgehead nitrogen atom in tricarbocyanine N-triazoles results in enhanced photostability upon photoexcitation. Altogether, the properties of the tricarbocyanine N-triazole scaffold as a bright, cell-permeable and photostable NIR structure encouraged us to explore its potential to produce new fluorophores able to track small populations of cells in vivo for longer periods of time than currently available NIR dyes.
Chemical optimisation of a photostable NIR fluorophore for labelling CD4+ T cells
Cellular immunotherapies represent promising strategies for treating disorders driven by malfunctioning immune responses, including cancer, chronic infections and autoimmune diseases.28–34 Among these, T cell immunotherapies have shown great potential, in both experimental models and human patients.35–39 For instance, in cancer immunotherapy, tumour-responsive T cells are isolated from the peripheral blood of patients, expanded ex vivo and then transferred back to elicit anti-tumour immune responses. One important obstacle in the clinical translation of T cell immunotherapies is the lack of chemical agents to track post-transferred therapeutic cells in vivo.40Longitudinal imaging allows researchers to evaluate whether T cells reach and accumulate at the site of disease, particularly shortly after the transfusion of the cells, when adverse events may occur. Despite the utility of magnetic resonance imaging (MRI) and radionuclide-based imaging for cell tracking,41–43 their respective limited sensitivity and safety concerns hamper their utility to detect small numbers of therapeutic T cells (e.g. <10000 cells) in vivo and at multiple time points. Using the above mentioned synthetic approach, we prepared a collection of ‘click’ infrared (CIR) fluorophores by modifying IR780 with 46 structurally-diverse alkynes (Fig. 2a). CIR fluorophores were isolated by semi-preparative HPLC in very high purities (>95%), and, unlike amino-derivatised tricarbocyanines,44 all CIR fluorophores showed excitation and emission wavelengths in the NIR window (λexc. ∼ 780–800 nm, λem. ∼ 805–840 nm) (Fig. 2b and Tables S2 and S3†). Given the broad availability of alkyne building blocks and versatility of the synthetic approach, this route might become the methodology-of-choice to produce bright and photostable NIR dyes via functionalisation of tricarbocyanines with N-substituted groups.
Next, we evaluated the fluorescence emission of the 46 CIR fluorophores upon incubation with murine T cells, and CIR38 showed the brightest fluorescence emission (Fig. 2c). Since the derivatisation of fluorescent sulfonamides with 1,2,3-triazole groups has been recently reported to produce water-soluble carbonic anhydrase inhibitors with optimal properties for in vivo studies,45 we envisaged that the neutral uncharged character of CIR38 would also enhance the solubility of the tricarbocyanine core and form less non-fluorescent aggregates in aqueous media. We compared water solutions of CIR38 and the generic heptamethine structure IR780 by dynamic light scattering, and observed that CIR38 formed less insoluble aggregates in water (Fig. 2d), highlighting the pyridinyl-triazole moiety as an effective chemical group to enhance the solubility of heptamethine dyes. Furthermore, CIR38 showed excellent photostability, retaining full chemical integrity even after 12 h of continuous UV light irradiation (Fig. S2†). Based on these results, we synthesized both maleimide (CIR38M) and succinimidyl ester (CIR38SE) analogues to increase its intracellular retention (Fig. 3a and Scheme S1†). The derivatisation of CIR38 with reactive groups did not affect the NIR spectral properties nor the uptake in murine CD4+ T cells (Fig. S3†). We selected CIR38M as a fluorophore with similar spectral properties to NIR commercially available dyes (Table S4†) and optimal features for intracellular labelling of CD4+ T cells under physiological conditions.
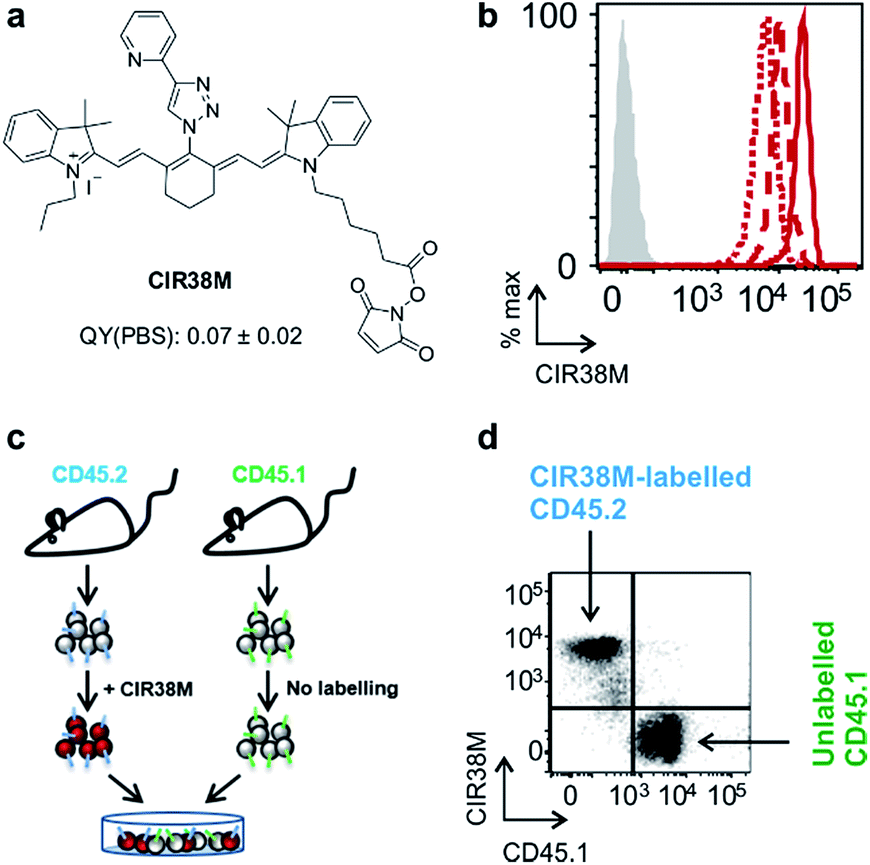 | ||
| Fig. 3 CIR38M brightly labels CD4+ T cells with no leaking to neighbouring cells. (a) Chemical structure of CIR38M and fluorescence quantum yield in PBS (relative to ICG). (b) Murine CD4+ T cells were labelled with CIR38M (10 μM, 2 min) and cultured on anti-CD3 and anti-CD28 coated plates. NIR fluorescence emission was measured by flow cytometry on day 0 (solid), day 1 (dashed) and day 3 (dotted), compared to unlabelled cells (shaded). (c, d) CD4+ T cells expressing the congenic marker CD45.2 were labelled with CIR38M and co-cultured with equal numbers of unlabelled CD4+ T cells expressing the congenic marker CD45.1. After 3 days of in vitro culture, fluorescence emission of CD45.1+ and CD45.2+ cells were assessed by flow cytometry. | ||
In vitro characterisation of CIR38M for murine T cell imaging
First, we examined the staining of CD4+ T cells following rapid 2 min incubation with different concentrations of CIR38M, and observed that the incubation of CD4+ T cells with 10 μM CIR38M provided very bright fluorescence signals, close to saturation levels (Fig. S4†). Next, we assessed the intensity of CIR38M after several cell divisions by stimulating CD4+ T cells with plate-bound anti-CD3/CD28 antibodies and measuring the NIR fluorescence emission for several days. As shown in Fig. S5,† a smaller decline in fluorescence emission was observed after 3 days of in vitro stimulation in CIR38M-labelled CD4+ T cells when compared to CFSE, a standard fluorescent marker of cell proliferation. CIR38M therefore demonstrated the utility to label T cells for multiple rounds of proliferation without a major loss of fluorescence intensity.We then analysed the stability of CIR38M labelling and evaluated whether the probe leaked to neighbouring cells, which would lead to the misinterpretation of in vivo imaging data. We employed CIR38M to label CD4+ T cells expressing the CD45.2 cell marker (i.e. CD45.2+ CD4+ T cells), and co-cultured them with the same number of unlabelled CD4+ T cells expressing the CD45.1 cell marker (i.e. CD45.1+ CD4+ T cells) (Fig. 3c). The expression of two different CD45 congenic markers allowed us to distinguish between CIR38M-labelled and unlabelled cells in the co-culture. Flow cytometry analysis after 3 days under stimulatory conditions confirmed the intracellular retention of CIR38M, as labelled cells expressed the CD45.2 marker but not the CD45.1 marker (Fig. 3d). The fluorescence characterisation of CIR38M-labelled CD4+ T cell lysates also showed that CIR38M was retained inside cells by forming covalent bonds with intracellular proteins (Fig. S6†), preventing leakage to neighbouring cells. In addition, we did not observe significant differences in the viability of CD4+ T cells after CIR38M treatment nor reduction in proliferation after culture for 3 days in stimulatory conditions (Fig. S7a and b†). The non-invasive character of CIR38M was also corroborated by measuring the production of key pro-inflammatory cytokines (e.g. TNF-α, GM-CSF) of stimulated labelled CD4+ T cells, which remained unaltered after treatment with CIR38M (Fig. S7c and d†).
Fluorescence microscopy of murine CD4+ T cells
Given the features of CIR38M as a NIR fluorophore for non-invasive labelling of CD4+ T cells, we performed in vitro fluorescence microscopy experiments to compare its imaging capabilities to other fluorophores emitting in the far NIR region (i.e. 800–900 nm). We compared the fluorescence staining of CIR38M to the commercially available IR800CW-SE, a gold standard in NIR fluorescence labelling,46,47 by treating CD4+ T cells with both fluorophores under the same conditions and visualising them under a fluorescence microscope. Counter-staining with the green fluorophore CellTracker Green was used to confirm CD4+ T cell labelling. As shown in Fig. 4a and b, the lack of charges and enhanced permeability of CIR38M led to much brighter staining of CD4+ T cells than IR800CW-SE. Direct comparison of CIR38M to IR780M, the maleimide analogue of IR780 (Scheme S2†), showed similar intensity but more photostable NIR signals with the former, highlighting the importance of the N-triazole group within the CIR38M structure (Fig. S8†). Notably, the strong fluorescence emission of CIR38M enabled imaging of labelled CD4+ T cells using both high and low-power excitation sources (i.e. Ti-sapphire laser and mercury lamps, respectively) (Fig. S9†) as well as low magnification objectives (Fig. S10†), expanding the scope of applications for CIR fluorophores to various optical imaging modalities. High-magnification images were analysed by plot profiling (Fig. 4c) and confirmed that CIR38M, like CellTracker Green, localised mainly in the cytosol of CD4+ T cells with preferential accumulation in mitochondria compared to other organelles (e.g. lysosomes) (Fig. S11†). Flow cytometry analysis also corroborated over 12-fold higher CD4+ T cell staining of CIR38M when compared to IR800CW-SE (Fig. S12†), and its intracellular retention was confirmed by lack of fluorescence quenching in an exclusion assay with the impermeant dye trypan blue48 (Fig. 4d).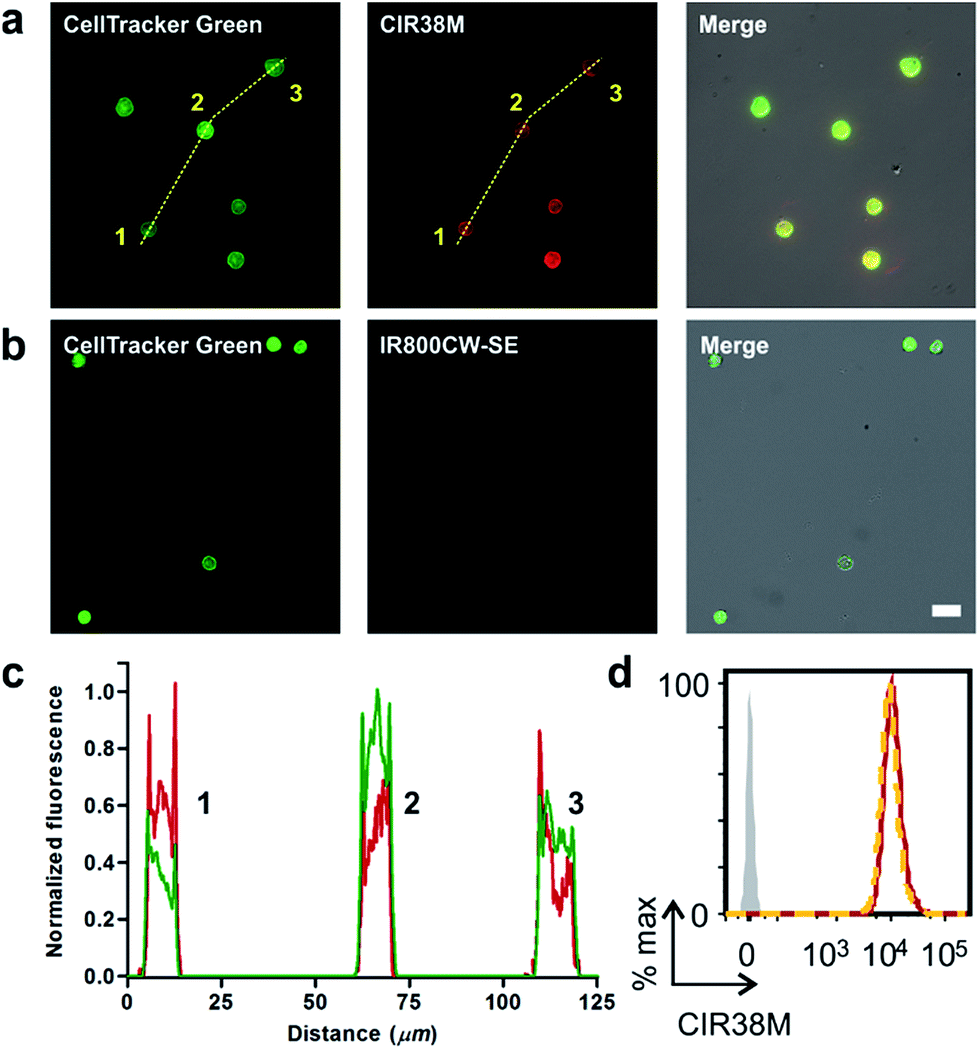 | ||
| Fig. 4 Fluorescence cell imaging of CIR38M-labelled T cells. (a) Brightfield, fluorescence and merged microscope images of CD4+ T cells after labelling with CIR38M and CellTracker Green. (b) Brightfield, fluorescence and merged microscope images of CD4+ T cells after labelling with IR800CW-SE and CellTracker Green. Scale bar: 10 μm. (c) Plot profile analysis of the fluorescence intracellular staining of CellTracker Green (green) and CIR38M (red) shown images in (a) (dashed yellow lines). (d) Intracellular staining of CIR38M confirmed by comparison of CIR38M-labelled CD4+ T cells (red) to CIR38M-labelled CD4+ T cells treated with 0.1% trypan blue (orange). | ||
Altogether, these results validate the applicability of CIR38M as a bright and non-toxic NIR agent to track the recruitment, expansion and mobility of CD4+ T cells without affecting their physiology and with enhanced capabilities over commercially available NIR dyes (e.g.IR800CW-SE).
In vivo long-term tracking of labelled T cells
Next, we examined the properties of CIR38M for tracking CD4+ T cells in vivo using whole-body NIR fluorescence imaging. To assess the capabilities of CIR38M for detecting small populations of therapeutic T cells, CD4+ T cells were labelled with CIR38M and sequential dilutions were prepared before being directly imaged using whole-body imaging acquisition settings. The limit of detection of CIR38M was around 4000 cells, 3-fold lower than the conventional NIR cell tracer DiR,49,50 highlighting the utility of CIR38M for monitoring small numbers of T cells that could not be detected by other methods (Fig. 5). We then applied CIR38M in a model of T cell activation, whereby an antigen was injected subcutaneously together with complete Freund's adjuvant (CFA), to monitor the dynamics of T cell activation in vivo. The co-administration of autoantigens and CFA is one of the most used approaches to induce experimental disease and to examine T cell activation in vivo. Numerous models have been described using this approach.51–55 With these experiments, we examined whether: (1) CIR38M could be used to image the antigen-specific accumulation of T cells in vivo, and (2) CIR38M could be used to track T cells longitudinally during the whole process of in vivo activation. To address the first question, we transferred CIR38M-labelled CD45.1+ CD4+ OT-II T cells, which express a T cell receptor that responds to ovalbumin peptide (pOVA), into CD45.2+ CD45.1− host mice. Host mice were administered a subcutaneous injection of CFA and pOVA antigen on the left hind leg to recruit the labelled OT-II T cells into the antigen-containing site, and CFA and PBS on the right hind leg as a negative control. We acquired whole-body fluorescence images of the mice 48 h post-injection and observed that CIR38M-labelled CD4+ T cells preferentially accumulated in the lymph nodes close to where the pOVA antigen had been injected (Fig. 6a). The CD45.1+ expression on OT-II cells allowed the transferred cells to be identified ex vivo by flow cytometry analysis, and we confirmed over 2-fold higher CIR38M-labelled cells in the lymph nodes draining the side immunised with CFA and pOVA when compared to the lymph nodes draining the side immunised with CFA and PBS (Fig. 6b).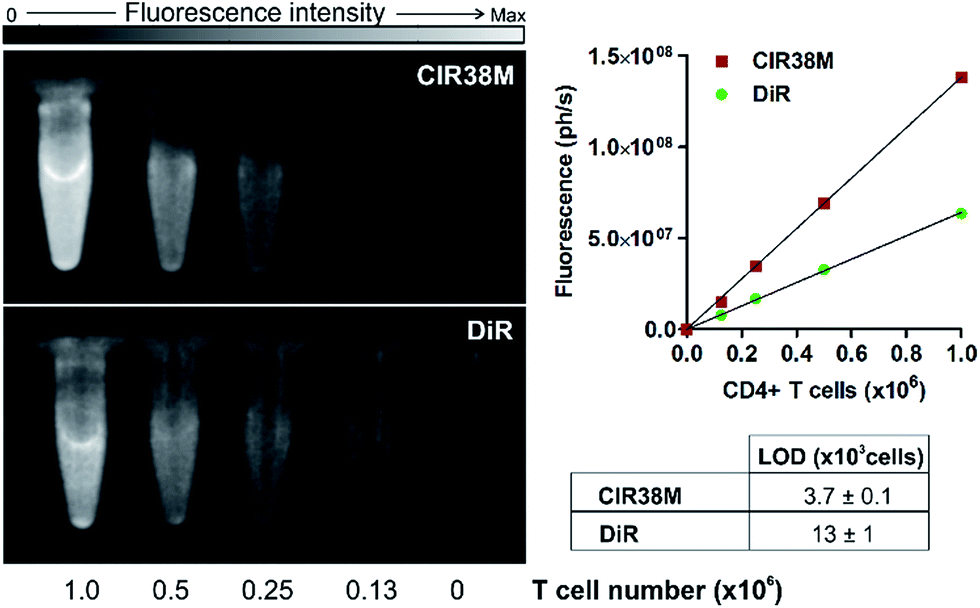 | ||
| Fig. 5 Determination of the limit of detection in suspensions of CIR38M-labelled and DiR-labelled (both at 10 μM) CD4+ T cells by NIR fluorescence imaging. Values shown as means ± s.e.m. Images acquired in PhotonImager™ (λexc. ∼ 760 nm; λem. ∼ 800–900 nm). Max: 2 × 10⁸ photons per s. | ||
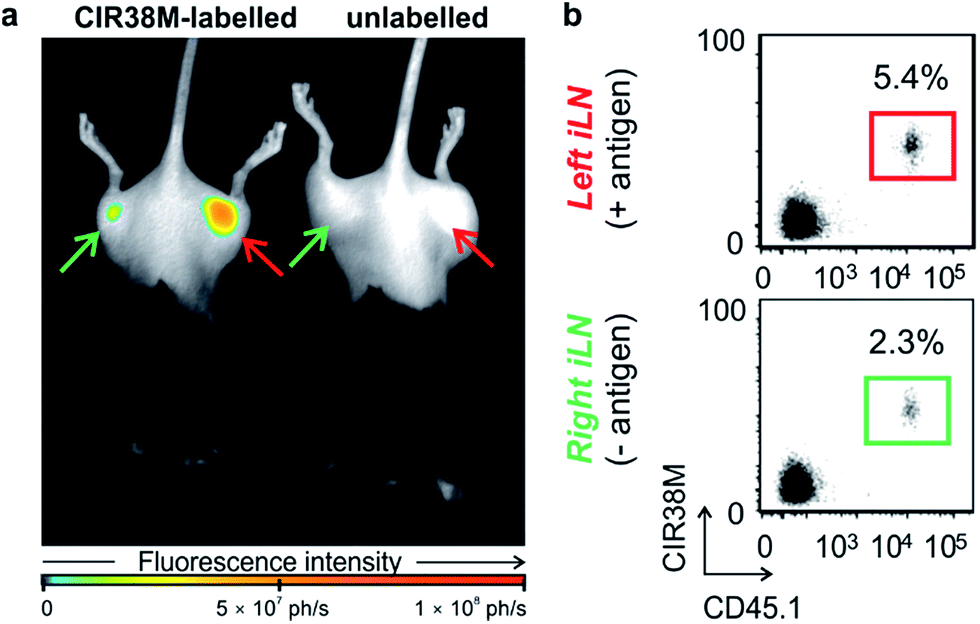 | ||
| Fig. 6 Site-specific accumulation of CIR38M-labelled cells in a model of T cell activation. (a) Whole-body fluorescence images (λexc. ∼ 760 nm; λem. ∼ 800–900 nm) of C57BL/6 mice (3 per group) 2 days after the tail vein i.v. injection of CIR38M-labelled (left) or unlabelled CD45.1+ CD4+ OT-II T cells (right). Right hind legs (green arrows) were injected with PBS emulsified in CFA whereas left hind legs (red arrows) were injected with 10 μg pOVA emulsified in CFA. (b) Flow cytometric ex vivo analysis of inguinal lymph nodes (iLNs) from both left and right hind limbs of mice that had been injected with CIR38M-labelled CD4+ T cells. Percentages indicate the proportion of CD45.1+ donor cells within the CD4+ T cell compartment. | ||
Ex vivo analysis of the lymph nodes confirmed that CIR38M was only present in CD45.1+ donor cells and had not transferred onto host CD45.1− cells, confirming that no leakage of CIR38M to other subpopulations of T cells occurred in vivo. These results corroborate that the fluorescence emission of CIR38M directly correlated to the antigen-specific accumulation of CD4+ T cells in mice.
To address the second question, we examined CIR38M for long-term imaging of T cell activation in vivo. CIR38M-labelled CD45.1+ CD4+ OT-II T cells were transferred into C57BL/6 hairless mice, followed by immunisation with CFA and pOVA at both hind limbs. Whole-body fluorescence images were acquired at 2, 4 and 7 days after immunisation. As shown in Fig. 7a–c, CIR38M-labelled T cells were clearly visible in the draining lymph nodes for the entirety of the in vivo activation process. Despite the highly proliferative environment which occurs when T cells interact with antigen in draining lymph nodes, quantitative analysis confirmed that ∼40% of the transferred T cells still retained CIR38M at day 4 and over 15% at day 7 (Fig. 7d). CIR38M-stained T cells were detected in the spleen ex vivo, but were difficult to image in whole bodies due to its deep location in vivo. The lack of NIR fluorescence emission in other immune cells, most importantly CD11b+ phagocytic myeloid cells, corroborated the applicability of CIR38M to faithfully identify the originally labelled T cells (Fig. S13†). Furthermore, we confirmed the presence of CIR38M-labelled cells by ex vivo analysis using flow cytometry and NIR tissue imaging (Fig. S14†).
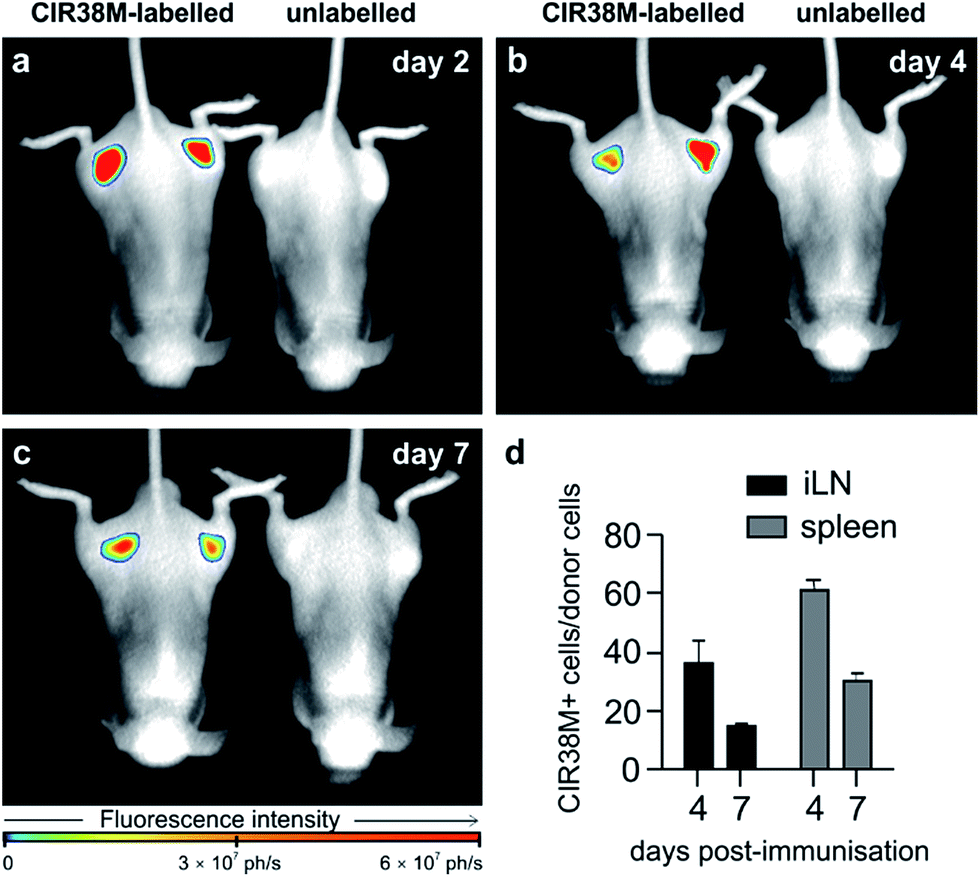 | ||
| Fig. 7 Long-term longitudinal tracking of CIR38M-labelled CD4+ T cells in vivo. C57BL/6 (B6.Cg-Tyrc-2J Hrhr/J) mice were injected i.v. (tail vein) with CIR38M-labelled or unlabelled pOVA-reactive CD45.1+ CD4+ OT-II T cells and immunised by injection of pOVA and CFA into each limb. Whole-body in vivo fluorescence images (λexc. ∼ 760 nm; λem. ∼ 800–900 nm) of representative mice (3 per group) injected with CIR38M-labelled or unlabelled T cells were acquired on (a) day 2 (b) day 4 and (c) day 7, prior to organ harvest and flow cytometry. (d) Proportion of donor cells retaining NIR fluorescence in the inguinal lymph nodes (iLN) draining the immunisation site and the spleen on days 4 and 7. Values as means ± s.e.m (n = 3 per group). | ||
Furthermore, we compared the sensitivity of CIR38M and DiR for detecting post-transferred cells in mice. We injected small numbers of CIR38M or DiR-labelled Tg4 CD4+ T cells, which express a transgenic T cell receptor that responds to myelin basic protein (MBP), into mice that were immunised with MBP peptide, and monitored their accumulation in antigen-treated lymph nodes by whole-body imaging. Brighter signals were detected for CIR38M-labelled cells (Fig. S15†), confirming its suitability for NIR imaging of activated CD4+ T cells even when low numbers of cells are recruited. Finally, to assess any potential effects of CIR38M-labelled cells on T cell physiology upon in vivo activation, we compared the recruitment of T cells to the lymph nodes in mice that had either received labelled or unlabelled CD45.1+ CD4+ OT-II T cells. We found no significant differences between the absolute numbers nor the proportions of CD45.1+ CD4+ OT-II T cells at any of the time points, which confirms the non-perturbative character of CIR38M for non-invasive in vivo imaging of cellular localisation and proliferation (Fig. S16†). We also examined any potential systemic toxicity derived from the injection of CIR38M-labelled CD4+ T cells. We analysed the biochemical profile of serum from mice that had been immunised with pOVA and CFA and injected the same amounts of either CIR38M-labelled or non-labelled CD45.1+ CD4+ OT-II T cells. Serum biochemistry was performed from mice that had been administered either CIR38M-labelled or unlabelled cells, and no significant differences were observed between the two groups in any of the analytes measured (Table S5†). Furthermore, H&E staining of formalin-fixed livers and kidney sections revealed no tissue pathology after administration of CIR38M-labelled cells (Fig. S17†).
Ex vivo staining of human CD4+ T cells
With the aim of assessing the translational potential of CIR38M in adoptive T cell transfer clinical studies, we labelled human CD4+ T cells from the peripheral blood of healthy volunteers. We observed that 2 min treatments with 10 μM CIR38M effectively stained human CD4+ T cells, with the cells remaining clearly labelled after 3 days of stimulation (Fig. 8a).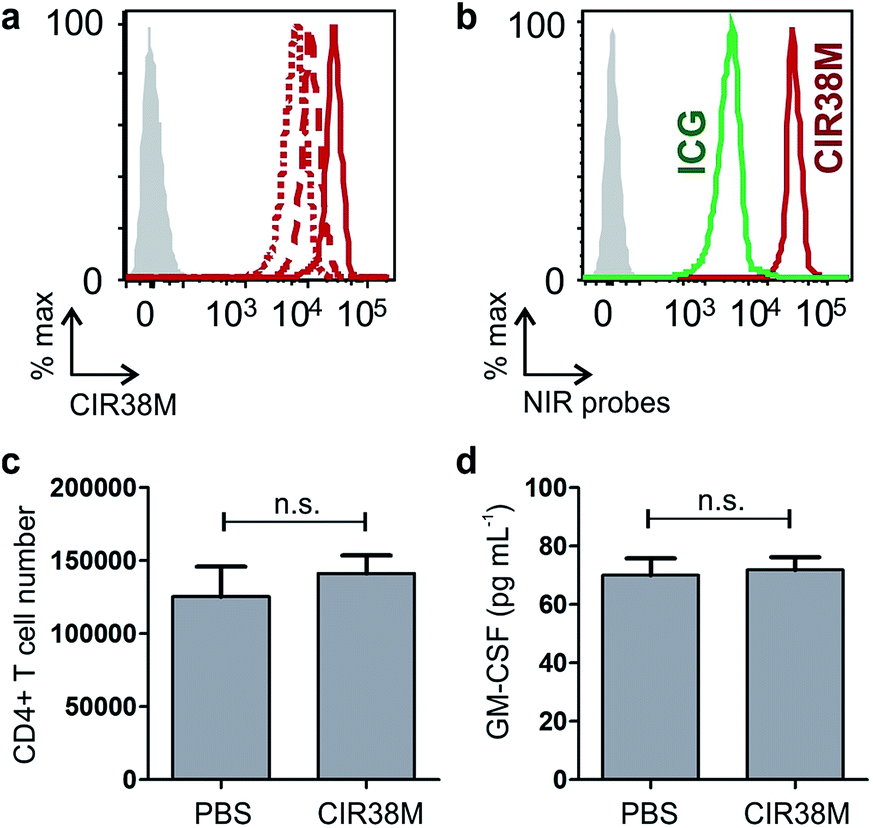 | ||
| Fig. 8 Ex vivo staining of human T cells with CIR38M. (a) Flow cytometric analysis of human CD4+ T cells from peripheral blood after labelling with CIR38M and culture with equal amounts of antigen-presenting cells and 2 μg mL−1 soluble anti-CD3. NIR fluorescence on day 0 (solid), day 1 (dashed) and day 3 (dotted) in comparison to unlabelled cells (shade). (b) Analysis of human CD4+ T cells labelled with CIR38M (red) or ICG (green) under the same conditions. (c) Equal numbers of human CD4+ T cells were incubated with CIR38M or PBS, incubated overnight at 37 °C and viable cells were counted 24 h later. Values represented as means ± s.e.m (n = 3); p > 0.05 for n.s. (d) Human CD4+ T cells were incubated with CIR38M or PBS and co-cultured with antigen-presenting cells in the presence of 2 μg mL−1 soluble anti-CD3. GM-CSF concentrations in the supernatant were determined by ELISA 72 h later. Values represented as means ± s.e.m (n = 3); p > 0.05 for n.s. | ||
We also compared the fluorescence staining of human CD4+ T cells with CIR38M to the FDA-approved ICG, and observed that CIR38M-labelled cells were over an order of magnitude brighter than ICG-labelled cells under the same conditions (Fig. 8b). Subsequent culture and analysis of the CIR38M-labelled cells showed that the probe did not induce significant cytotoxicity in resting human CD4+ T cells after 24 h (Fig. 8c) or affected the cytokine expression (e.g. GM-CSF) of activated T cells cultured for 3 days under stimulatory conditions (Fig. 8d). The high stability and neutral character of CIR38M asserts its utility for longitudinal imaging studies of murine and human T cell mobility in both preclinical imaging as well as clinical research.
Conclusions
This is the first report of tricarbocyanine N-triazoles as a new family of NIR dyes overcoming the limitations of tricarbocyanines for long-term in vivo fluorescence cell tracking. We rationally designed tricarbocyanine N-triazoles as a NIR structure with brighter fluorescence emission and minimal photodegradation by theoretical calculations of electron density at the bridgehead nitrogen atoms of the tricarbocyanine core. We have also developed a one-pot synthetic methodology compatible with a broad range of alkyne building blocks, making this strategy an optimal approach for the preparation of highly photostable NIR agents. We further optimised the tricarbocyanine N-triazole CIR38M as a non-transferable marker of therapeutic immune cells, both from mouse and human origin. We demonstrated that CIR38M can track post-transferred T cells in vivo at multiple time points as well as detect antigen-driven accumulation of T cells at specific sites. CIR38M can label small populations of T cells with high sensitivity (i.e. around 4000 cells) and with cells being detectable in vivo over 7 days post-transfer. Tricarbocyanine N-triazoles open multiple opportunities for in situ NIR imaging of therapy efficacy and disease progression in preclinical and clinical research.Experimental section
General materials
Commercially available reagents were used without further purification. Thin-layer chromatography was conducted on Merck silica gel 60 F254 sheets and visualised by UV (254 and 365 nm). Silica gel (particle size 35–70 μm) was used for column chromatography. 1H and 13C spectra were recorded in a Bruker Avance 500 spectrometer (at 500 and 125 MHz, respectively). Data for 1H NMR spectra reported as chemical shift δ (ppm), multiplicity, coupling constant (Hz) and integration. Data for 13C NMR spectra reported as chemical shifts relative to the solvent peak. HPLC-MS analysis was performed on a Waters Alliance 2695 separation module connected to a Waters PDA2996 photodiode array detector and a ZQ Micromass mass spectrometer (ESI-MS) with a Phenomenex® column (C18, 5 μm, 4.6 × 150 mm). Compounds were purified using a Waters semi-preparative HPLC system using a Phenomenex® column (C18 Axial, 10 μm, 21.2 × 150 mm) and UV detection. HRMS (ESI positive) were obtained in a LTQ-FT Ultra (Thermo Scientific) mass spectrometer.Chemical synthesis
Compound 1 was synthesized following previously reported procedures.441H NMR (500 MHz, MeOD) δ 7.42–7.21 (m, 12H), 7.05–6.94 (m, 4H), 5.61 (d, J = 12.7 Hz, 2H), 4.64–4.57 (m, 1H), 4.46–4.36 (m, 1H), 4.28–4.18 (m, 1H), 4.18–4.10 (m, 1H), 3.84 (t, J = 7.3 Hz, 4H), 3.64–3.56 (m, 1H), 2.68 (s, 4H), 2.39–2.31 (m, 1H), 1.91–1.75 (m, 6H), 1.60 (d, J = 7.1 Hz, 12H), 1.03 (t, J = 7.4 Hz, 6H). 13C NMR (126 MHz, MeOD) δ 128.5, 127.8, 126.9, 126.6, 121.5, 121.4, 121.1, 107.9, 91.9, 73.9, 62.5, 55.3, 46.6, 42.4, 31.4, 28.2, 28.1, 28.0, 19.4, 10.4.General synthesis of CIR fluorophores
To a solution of IR780 (300 mg, 0.44 mmol, 1 eq.) in DMF (2 mL), was added sodium azide (145 mg, 2.2 mmol, 5 eq.) in H2O (2 mL). The resulting mixture was stirred at 70 °C for 20 min. The reaction was then cooled down, diluted with CH2Cl2 (20 mL) and washed with H2O (×1). Combined organic layers containing the IR780-azide intermediate (confirmed by HPLC-MS; m/z: 546) were evaporated and used without further purification. IR780-azide was dissolved in 15 mL CH2Cl2 and aliquoted to react with different alkynes (typically, in batches of 10 different alkynes). To each aliquot, we added CuSO4 (14 mg, 0.08 mmol, 2 eq.), tris[(1-benzyl-1H-1,2,3-triazol-4-yl)methyl]amine (TBTA) (42 mg, 0.08 mmol, 2 eq.) and sodium ascorbate (16 mg, 0.08 mmol, 2 eq.) pre-dissolved in DMF:H2O (1:1, 0.2 mL), and the alkynes (0.44 mmol, 10 eq.). The resulting mixtures were stirred at r.t. typically for 2 h (longer reaction times depending on the alkynes). The crude reaction mixtures were diluted in CH2Cl2 (10–20 mL), and the organic phases were washed with H2O (3 × 10 mL). The organic extracts were dried over MgSO4, filtered and evaporated under reduced pressure. The resulting crudes were then purified by semi-preparative HPLC to yield CIR fluorophores (full characterisation data in Tables S2 and S3†).
1H NMR (500 MHz, MeOD) δ 8.85 (s, 1H), 8.67 (d, J = 4.9 Hz, 1H), 8.30 (d, J = 7.9 Hz, 1H), 8.06 (t, J = 7.8 Hz, 1H), 7.50 (d, J = 4.9 Hz, 1H), 7.42–7.36 (m, 3H), 7.35–7.31 (m, 2H), 7.27–7.21 (m, 2H), 6.92 (dd, J = 14.1, 4.8 Hz, 2H), 6.82 (s, 1H), 6.37 (d, J = 14.1 Hz, 2H), 4.22–4.09 (m, 4H), 3.62 (dt, J = 750.8, 5.8, 4.1 Hz, 3H), 3.39–3.34 (m, 3H), 2.88 (s, 4H), 2.66 (d, J = 9.4 Hz, 1H), 2.14 (t, J = 7.3 Hz, 3H), 1.92–1.78 (m, 4H), 1.69–1.60 (m, 4H), 1.35 (s, 6H), 1.27 (s, 6H), 1.04 (t, J = 7.4 Hz, 3H). 13C NMR (126 MHz, MeOD) δ 174.7, 173.1, 172.9, 171.1, 149.6, 148.9, 148.0, 147.3, 142.1, 142.0, 141.5, 141.4, 141.2, 141.1, 137.7, 134.1, 128.5, 126.5, 125.4, 125.4, 123.7, 122.1, 120.4, 111.1, 111.1, 101.6, 101.5, 49.1, 49.1, 48.2, 45.4, 43.8, 37.5, 37.1, 35.1, 26.8, 26.6, 26.5, 25.9, 24.8, 24.1, 24.1, 20.6, 20.4, 10.2. HRMS: m/z [M+] calcd for C52H59N8O3: 843.4705; found: 843.4660.
In vitro spectral measurements
Spectroscopic and quantum yield data were recorded on a Synergy HT spectrophotometer (Biotek). Compounds were dissolved at the indicated concentrations and spectra were recorded at r.t. Spectra are represented as means from at least two independent experiments with n = 3. Relative quantum yields were calculated by measuring the integrated emission area of the fluorescence spectra and comparing it to the area measured for the standard56 (e.g. for CIR fluorophores, ICG was used as the reference).Calculations
All quantum chemical calculations were performed with Gaussian 09 (Revision D.01).27 Ground state geometries of compounds 1 and 2 were optimised using the density function theory (DFT) with B3LYP57,58 M06-2X,59 PBE0 (ref. 60) and wB97xd61 functionals together with the Pople's basis set 6-31G*. Geometry optimisations were performed both in the gas phase and in EtOH, where the solvent was described by the Polarizable Continuum Model (PCM).62 The nature of the excitation energies, oscillator strengths and contributions of the different orbitals involved in the electronic transitions were calculated using time-dependent density functional theory (TD-DFT) at the selected levels of theory, both in gas phase and in EtOH.Particle size analysis
The mean size of aggregates in aqueous media were determined by dynamic light scattering using a PS90 Particle Size Analyser (Brookhaven Instrument Corporation). IR780 and CIR38 were dissolved in PBS (100 μM) and kept at r.t. to measure the size of aggregates every 2 h for a total of 8 h. Data is represented as means ± s.e.m from two independent experiments with n = 3.In vitro labelling and characterisation of CD4+ T cells
Single cell suspensions were made from the spleen after which red blood cells were lysed using NH4Cl buffer. CD4+ T cells were purified by magnetic cell sorting as per manufacturer's instructions (Miltenyi Biotech). CD4+ T cells were re-suspended in PBS and then labelled with the probes for 2 min at the stated concentrations at 37 °C. Cells were washed twice with cell culture medium, after which they were re-suspended in FACS buffer (PBS, 2% FCS, 0.01% sodium azide) or appropriate cell culture medium. For flow cytometric analysis, cells were then incubated with antibodies for 20 min at 4 °C. The antibodies used were anti-CD4-e450 or anti-CD4-PE, anti-CD45.1-FITC or anti-CD45.1-PE, and anti-CD11b-APC (all from eBioscience). Samples were also stained with a fixable viability dye (conjugated with eFluor455, eBioscience) prior to surface staining. Flow cytometry data were collected using an LSR Fortessa (BD Biosciences) and analysed using FlowJo software.In vitro cell viability and proliferation assays
To study the primary activation of CIR38M-labelled CD4+ T cells, 2 × 10⁵ CD4+ Tg4. CD45.1+ T cells were added per well to 2 μg mL−1 anti-CD3 and 2 μg mL−1 anti-CD28 coated, flat-bottomed 96-well plates. After 48 h, cell proliferation was assessed by the addition of [3H]-thymidine at 0.5 μCi per well for the last 18 h of culture. [3H]-thymidine incorporation was measured using a scintillation β-counter (Wallac) as mean counts per minute (c.p.m). The production of cytokines was assessed in culture supernatants by ELISA using Ready-SET-Go ELISA kits according to manufacturer's instructions after 72 h of culture. In some experiments, CD45.1+ and CD45.2+ CD4+ T cells were co-cultured together to assess the extent of probe transfer between cells. In addition, in some instances, cells were double-labelled with 5 μM CFSE and 10 μM CIR38M for 2 min at 37 °C.Fluorescence microscopy of CD4+ T cells
Single cell suspensions were made from spleens of C57BL/6 mice and red blood cells lysed using NH4Cl buffer. CD4+ T cells were purified by magnetic cell sorting as per manufacturer's instructions, re-suspended in PBS and then labelled with CellTracker Green (10 μM), MitoTracker Red CMXRos (500 nM) or LysoTracker Red DND-99 (100 nM) at 37 °C, prior to addition of CIR38M or IR800CW-SE (10 μM) and incubation at 37 °C. Cells were washed twice with cell culture medium, twice in PBS, before re-suspension of the cell pellet in 1% PFA. T cells were mounted and imaged under a fluorescence microscope (Nikon Ti Eclipse) using a 60× oil immersion objective (NA 1.4) and a Hamamatsu Orca Flash 4.0 V2 camera for NIR detection. Excitation was achieved either by a Ti-sapphire laser (Coherent Mira 900, 740 nm CW) or a 100 W mercury lamp and a NIR epifluorescence filter cube (EX 747/33, DM 776LP, EM 776LP).Whole-body fluorescence in vivo imaging and ex vivo analysis
C57BL/6 (CD45.1− CD45.2+) and OT-II (CD45.1+ CD45.2−) mice were bred under specific pathogen-free conditions at the University of Edinburgh. Hair from C57BL/6 mice was removed using hair clippers followed by application of a coat of Nair and subsequent wiping with gauze sponges and water. Hairless albino C57BL/6 (B6.Cg-Tyrc-2J Hrhr/J) mice were purchased from The Jackson Laboratory. The housing facility was compliant with Federation of European Laboratory Animal Science Associations guidelines on screening mice for infectious diseases. All experiments had local ethical approval from the University of Edinburgh's Animal Welfare and Ethical Review Body and were performed in accordance with UK legislation. OT-II transgenic mice express an I-Ab-restricted T cell receptor, which is reactive toward ovalbumin peptide 323–339.63 The ovalbumin peptide (pOVA) was obtained from Cambridge Research Biochemicals. Tissue culture medium (RPMI 1640 medium) was supplemented with 2 mM L-glutamine, 100 U mL−1 penicillin, 100 μg mL−1 streptomycin, 5 × 10⁻⁵ M 2-ME (all from Invitrogen Life Technologies) and 10% FCS (Labtech).Albino hairless female C57BL/6 (CD45.2) mice were intravenously injected with 20 × 106 CD45.1+ CD4+ OT-II T cells which had been labelled or not with 10 μM CIR38M for 2 min. On the same day, mice received a 50 μL subcutaneous injection of 10 μg of pOVA peptide emulsified in 2 mg mL−1 CFA, or PBS and CFA into each hind leg flank. Whole-body in vivo fluorescence images (λexc. ∼ 760 nm; λem. ∼ 800–900 nm) of representative mice from both groups (i.e. injected with CIR38M-labelled cells or injected with unlabelled cells) were acquired on a PhotonImager™ (Biospace Lab) on days 2, 4 and 7. Mice were then culled to harvest the spleens and draining inguinal lymph nodes for ex vivo tissue imaging and analysis by flow cytometry as described above.
For CIR38Mvs.DiR comparative analysis, 106 CD4+ Tg4 T cells were transferred into B10.PLxC57BL/6 mice followed by subcutaneous immunisation with 10 μg of MBP Ac1-9(4Tyr) peptide emulsified in CFA containing 50 μg of heat-killed Mycobacterium tuberculosis H37Ra at a total final volume of 100 μL injected subcutaneously into the hind legs. Whole-body fluorescence images of representative mice from both groups (i.e. injected with CIR38M-labelled cells or DiR-labelled cells) were acquired on a PhotonImager™ (Biospace Lab) 48 h post-injection.
Ex vivo labelling of human CD4+ T cells
Ex vivo experiments with fresh human peripheral blood from healthy donors were approved by the Accredited Medical Regional Ethics Committee (AMREC, reference number 15-HV-013), as previously reported.64 Human CD4+ T cells were purified by magnetic cell sorting as per manufacturer's instructions (Miltenyi Biotech). CD4+ T cells were re-suspended in PBS and then labelled with CIR38M or ICG (10 μM) at 37 °C. Cells were washed twice with cell culture medium, after which they were re-suspended in FACS buffer or appropriate culture medium. Proliferation studies were undertaken by adding 2 × 10⁵ CD4+ T cells per well to equal amounts of antigen-presenting cells and 2 μg mL−1 soluble anti-CD3 in flat-bottomed 96-well plates. The production of cytokines was assessed in culture supernatants by ELISA using Ready-SET-Go ELISA kits according to manufacturer's instructions (eBioscience) after 72 h of culture.Conflicts of interest
The University of Edinburgh has submitted a priority file to protect the technology described in the study.Acknowledgements
R. J. M. was supported by a Wellcome Trust Intermediate Clinical Fellowship (098493/Z/12/Z). A. F. acknowledges a MSCA Individual Fellowship (704912) and funding from the Foundation Alfonso Martin Escudero (FAME, Spain). J. S. acknowledges funding from the EPSRC and MRC Centre for Doctoral Training in Optical Medical Imaging OPTIMA (EP/L016559/1) and Scottish Funding Council (H14052). M. V. acknowledges the support of the FP7 Marie Curie Integration Grant (333847), the Biotechnology and Biological Sciences Research Council (BB/M025160/1), The Royal Society (RG160289) and the ERC Consolidator Grant (771443). The authors thank the technical support from Dr Daniel Soong and the Confocal Advanced Light Microscopy (CALM) at the University of Edinburgh.Notes and references
- J. V. Frangioni, Curr. Opin. Chem. Biol., 2003, 7, 626–634 CrossRef PubMed.
- V. Ntziachristos, J. Ripoll and R. Weissleder, Opt. Lett., 2002, 27, 333–335 CrossRef PubMed.
- J. O. Escobedo, O. Rusin, S. Lim and R. M. Strongin, Curr. Opin. Chem. Biol., 2010, 14, 64–70 CrossRef PubMed.
- L. Yuan, W. Lin, K. Zheng, L. He and W. Huang, Chem. Soc. Rev., 2013, 42, 622–661 RSC.
- S. M. Pauff and S. C. Miller, Org. Lett., 2011, 13, 6196–6199 CrossRef PubMed.
- T. Hirayama, G. C. Van de Bittner, L. W. Gray, S. Lutsenko and C. J. Chang, Proc. Natl. Acad. Sci. U. S. A., 2012, 109, 2228–2232 CrossRef PubMed.
- F. De Moliner, N. Kielland, R. Lavilla and M. Vendrell, Angew. Chem., Int. Ed., 2017, 56, 3758–3769 CrossRef PubMed.
- J. Yin, Y. Kwon, D. Kim, D. Lee, G. Kim, Y. Hu, J. H. Ryu and J. Yoon, J. Am. Chem. Soc., 2014, 136, 5351–5358 CrossRef PubMed.
- H. Wu, S. C. Alexander, S. Jin and N. K. Devaraj, J. Am. Chem. Soc., 2016, 138, 11429–11432 CrossRef PubMed.
- H. Hyun, M. H. Park, E. A. Owens, H. Wada, M. Henary, H. J. M. Handgraaf, A. L. Vahrmeijer, J. V. Frangioni and H. S. Choi, Nat. Med., 2015, 21, 192–197 CrossRef PubMed.
- H. Hyun, E. A. Owens, H. Wada, A. Levitz, G. Park, M. H. Park, J. V. Frangioni, M. Henary and H. S. Choi, Angew. Chem., Int. Ed., 2015, 54, 8648–8652 CrossRef PubMed.
- H. Wada, H. Hyun, C. Vargas, J. Gravier, G. L. Park, S. Gioux, J. V. Frangioni, M. Henary and H. S. Choi, Theranostics, 2015, 5, 1–11 CrossRef PubMed.
- C. N. Njiojob, E. A. Owens, L. Narayana, H. Hyun, H. S. Choi and M. Henary, J. Med. Chem., 2015, 58, 2845–2854 CrossRef PubMed.
- H. S. Choi, S. L. Gibbs, J. H. Lee, S. H. Kim, Y. Ashitate, F. Liu, H. Hyun, G. Park, Y. Xie, S. Bae, M. Henary and J. V. Frangioni, Nat. Biotechnol., 2013, 31, 148–153 CrossRef PubMed.
- D. Su, C. L. Teoh, A. Samanta, N. Y. Kang, S. J. Park and Y. T. Chang, Chem. Commun., 2015, 51, 3989–3992 RSC.
- K. Sato, A. P. Gorka, T. Nagaya, M. S. Michie, R. R. Nani, Y. Nakamura, V. L. Coble, O. V. Vasalatiy, R. E. Swenson, P. L. Choyke, M. J. Schnermann and H. Kobayashi, Bioconjugate Chem., 2016, 27, 404–413 CrossRef PubMed.
- Y. Liu, Y. M. Zhao, W. Akers, Z. Y. Tang, J. Fan, H. C. Sun, Q. H. Ye, L. Wang and S. Achilefu, Transl. Res., 2013, 162, 324–331 CrossRef PubMed.
- J. T. Elliott, A. V. Dsouza, K. Marra, B. W. Pogue, D. W. Roberts and K. D. Paulsen, Biomed. Opt. Express, 2016, 7, 3280–3288 CrossRef PubMed.
- W. Sun, S. Guo, C. Hu, J. Fan and X. Peng, Chem. Rev., 2016, 116, 7768–7817 CrossRef PubMed.
- S. A. Hilderbrand and R. Weissleder, Curr. Opin. Chem. Biol., 2010, 14, 71–79 CrossRef PubMed.
- E. Sasaki, H. Kojima, H. Nishimatsu, Y. Urano, K. Kikuchi, Y. Hirata and T. Nagano, J. Am. Chem. Soc., 2005, 127, 3684–3685 CrossRef PubMed.
- K. Kiyose, H. Kojima, Y. Urano and T. Nagano, J. Am. Chem. Soc., 2006, 128, 6548–6549 CrossRef PubMed.
- A. Samanta, M. Vendrell, R. Das and Y. T. Chang, Chem. Commun., 2010, 46, 7406–7408 RSC.
- R. Das, A. Samanta, H. H. Ha and Y. T. Chang, RSC Adv., 2011, 1, 573–575 RSC.
- M. Vendrell, A. Samanta, S. W. Yun and Y. T. Chang, Org. Biomol. Chem., 2011, 9, 4760–4762 RSC.
- N. Y. Kang, S. J. Park, X. W. E. Ang, A. Samanta, W. H. P. Driessen, V. Ntziachristos, K. O. Vasquez, J. D. Peterson, S. W. Yun and Y. T. Chang, Chem. Commun., 2015, 50, 6589–6591 RSC.
- M. J. Frisch, G. W. Trucks, H. B. Schelegel, G. E. Scuseria, M. A. Robb, J. R. Cheeseman, G. Scalmani, V. Barone, B. Menuucci and G. A. Petersson, et al., Gaussian 09, Gaussian, Inc., Wallingford CT, 2009 Search PubMed.
- T. A. Fehniger and M. A. Cooper, Trends Immunol., 2016, 37, 877–888 CrossRef PubMed.
- T. N. Schumacher and R. D. Schreiber, Science, 2015, 348, 69–74 CrossRef PubMed.
- S. A. Rosenberg, J. Immunol., 2014, 192, 5451–5458 CrossRef PubMed.
- H. Waldmann, R. Hilbrands, D. Howie and S. Cobbold, J. Clin. Invest., 2014, 124, 1439–1445 CrossRef PubMed.
- N. Kielland, M. Vendrell, R. Lavilla and Y. T. Chang, Chem. Commun., 2012, 48, 7401–7403 RSC.
- S. J. Park, H. C. Yeo, N. Y. Kang, H. Kim, J. Lin, H. H. Ha, M. Vendrell, J. S. Lee, Y. Chandran, D. Y. Lee, S. W. Yun and Y. T. Chang, Stem Cell Res., 2014, 12, 730–741 CrossRef PubMed.
- G. Hong, S. Diao, A. L. Antaris and H. Dai, Chem. Rev., 2015, 115, 10816–10906 CrossRef PubMed.
- N. N. Hunder, H. Wallen, J. Cao, D. W. Hendricks, J. Z. Reilly, R. Rodmyre, A. Jungbluth, S. Gnjatic, J. A. Thompson and C. Yee, N. Engl. J. Med., 2008, 358, 2698–2703 CrossRef PubMed.
- C. Yee, Immunol. Rev., 2014, 257, 250–263 CrossRef PubMed.
- C. H. June, S. R. Riddell and T. N. Schumacher, Sci. Transl. Med., 2015, 7, 280–287 Search PubMed.
- K. Perruccio, A. Tosti, E. Burchielli, F. Topini, L. Ruggeri, A. Carotti, M. Capanni, E. Urbani, A. Mancusi, F. Aversa, M. F. Martelli, L. Romani and A. Velardi, Blood, 2005, 106, 4397–4406 CrossRef PubMed.
- S. A. Rosenberg, J. C. Yang, R. M. Sherry, U. S. Kammula, M. S. Hughes, G. Q. Phan, D. E. Citrin, N. P. Restifo, P. F. Robbins, J. R. Wunderlich, K. E. Morton, C. M. Laurencot, S. M. Steinberg, D. E. White and M. E. Dudley, Clin. Cancer Res., 2011, 17, 4550–4557 CrossRef PubMed.
- For a review, see M. L. James and S. S. Gambhir, Physiol. Rev., 2012, 92, 897–965 CrossRef PubMed.
- E. T. Ahrens, R. Flores, H. Xu and P. A. Morel, Nat. Biotechnol., 2005, 23, 983–987 CrossRef PubMed.
- E. T. Ahrens and J. W. Bulte, Nat. Rev. Immunol., 2013, 13, 755–763 CrossRef PubMed.
- R. Bar-Shalom, N. Yefremov, L. Guralnik, Z. Keidar, A. Engel, S. Nitecki and O. Israel, J. Nucl. Med., 2006, 47, 587–594 Search PubMed.
- K. Kiyose, S. Aizawa, E. Sasaki, H. Kojima, K. Hanaoka, T. Terai, Y. Urano and T. Nagano, Chem.–Eur. J., 2009, 15, 9191–9200 CrossRef PubMed.
- F. Carta, M. Ferraroni, A. Cozzafava and T. Supuran, Bioorg. Med. Chem., 2016, 24, 104–112 CrossRef PubMed.
- A. S. Cohen, R. Patek, S. A. Enkemann, J. O. Johnson, T. Chen, E. Toloza, J. Vagner and D. L. Morse, Bioconjugate Chem., 2016, 27, 427–438 CrossRef PubMed.
- H. J. Yang, Y. Kong, Y. Cheng, H. Janagama, H. Hassounah, H. Xie, J. Rao and J. D. Cirillo, J. Infect. Dis., 2017, 215, 405–414 Search PubMed.
- J. D. Loike and S. C. Silverstein, J. Immunol. Methods, 1983, 57, 373–379 CrossRef PubMed.
- X. Du, X. Wang, N. Ning, S. Xia, J. Liu, W. Liang, H. Sun and Y. Xu, Exp. Ther. Med., 2012, 4, 221–225 CrossRef PubMed.
- F. M. Youniss, G. Sundaresan, L. J. Graham, L. Wang, C. R. Berry, G. K. Dewkar, P. Jose, H. D. Bear and J. Zweit, PLoS One, 2014, 9, e109162 CrossRef PubMed.
- A. Billiau and P. Matthys, J. Leukocyte Biol., 2001, 70, 849–860 Search PubMed.
- D. D. Brand, K. A. Latham and E. F. Rosloniec, Nat. Protoc., 2007, 2, 1269–1275 CrossRef PubMed.
- R. R. Caspi, P. B. Silver, D. Luger, J. Tang, L. M. Cortes, G. Pennesi, M. J. Mattapallil and C. C. Chan, Ophthalmic Res., 2008, 40, 169–174 CrossRef PubMed.
- J. A. Fontes, J. G. Barin, M. V. Talor, N. Stickel, J. Schaub, N. R. Rose and D. Čiháková, Immun., Inflammation Dis., 2017, 5, 163–176 CrossRef PubMed.
- S. Kohno, J. A. Munoz, T. M. Williams, C. Teuscher, C. C. Bernard and K. S. Tung, J. Immunol., 1983, 130, 2675–2682 Search PubMed.
- L. Mendive-Tapia, C. Zhao, A. R. Akram, S. Preciado, F. Albericio, M. Lee, A. Serrels, N. Kielland, N. D. Read, R. Lavilla and M. Vendrell, Nat. Commun., 2016, 7, 10940–10948 CrossRef PubMed.
- A. D. Becke, J. Chem. Phys., 1993, 98, 5648–5652 CrossRef.
- C. Lee, W. Yang and R. G. Parr, Phys. Rev. B: Condens. Matter Mater. Phys., 1988, 37, 785–789 CrossRef.
- Y. Zhao and D. G. Truhlar, Theor. Chem. Acc., 2008, 120, 215–241 Search PubMed.
- J. P. Perdew, K. Burke and M. Ernzerhof, Phys. Rev. Lett., 1996, 77, 3865 CrossRef PubMed.
- J. D. Chai and M. Head-Gordon, Phys. Chem. Chem. Phys., 2008, 10, 6615–6620 RSC.
- M. Cossi, N. Rega, G. Scalmani and V. J. Barone, Comput. Chem., 2003, 24, 669–681 CrossRef PubMed.
- J. M. Robertson, P. E. Jensen and B. D. Evabold, J. Immunol., 2000, 164, 4706–4712 CrossRef.
- A. Fernandez, M. Vermeren, D. Humphries, R. Subiros-Funosas, N. Barth, L. Campana, A. MacKinnon, Y. Feng and M. Vendrell, ACS Cent. Sci., 2017, 3, 995–1005 CrossRef PubMed.
Footnotes |
| † Electronic supplementary information (ESI) available: Additional details for theoretical calculations, chemical synthesis and characterisation of all probes; supplementary figures and experimental procedures for all assays performed with murine and human CD4+ T cells. See DOI: 10.1039/c8sc00900g |
| ‡ These authors contributed equally to this work. |
| This journal is © The Royal Society of Chemistry 2018 |