 Open Access Article
Rapid, non-invasive characterization of the dispersity of emulsions via microwaves†
Yuqiang
Yan
 ab,
Sergio
Gonzalez-Cortes
 b,
Benzhen
Yao
 b,
Daniel R.
Slocombe
 c,
Adrian
Porch
 c,
Fahai
Cao
 *a,
Tiancun
Xiao
 b and
Peter P.
Edwards
 *b
*b
aSchool of Chemical Engineering, East China University of Science and Technology, Shanghai 200237, China. E-mail: fhcao@ecust.edu.cn
bKing Abdulaziz City for Science and Technology-Oxford Centre of Excellence for Petrochemicals(KOPRC), Inorganic Chemistry Laboratory, Department of Chemistry, University of Oxford, Oxford OX1 3QR, UK. E-mail: peter.edwards@chem.ox.ac.uk
cSchool of Engineering, Cardiff University, Queen's Buildings, The Parade, Cardiff CF24 3AA, UK
First published on 30th July 2018
Abstract
A rapid and non-invasive method to determine the dispersity of emulsions is developed based on the interrelationship between the droplet size distribution and the dielectric properties of emulsions. A range of water-in-oil emulsions with different water contents and droplet size distributions were analysed using a microwave cavity perturbation technique together with dynamic light scattering. The results demonstrate that the dielectric properties, as measured by non-invasive microwave cavity analysis, can be used to characterise the dispersity of emulsions, and is also capable of characterizing heavy oil emulsions. This technique has great potential for industrial applications to examine the sedimentation, creaming and hence the stability of emulsions.
Introduction
An emulsion is a mixture of two or more immiscible liquids with one liquid dispersed in the other. Water-in-oil (W/O) emulsions are widely used in polymerization,1 oil refinery,2,3 pharmaceuticals,4 cosmetic5 and food industries.6 As an emulsion is thermodynamically unstable, it is inevitably polydispersed to some degree.7 The important droplet size distribution describes the emulsion dispersity, which influences a range of important characteristics such as emulsion stability, viscosity and rheological behaviour.Common methods for determining the droplet size distribution of common emulsions include microscopy, ultrasonics and light scattering techniques,8,9 but these methods are limited to opaque samples like crude oil emulsions in oil refinery and petrochemical industries. The presence of gas bubbles and suspended solids also considerably restrict their applicability to such emulsion systems.10
Much effort has been made recently to explore alternative methods for determining the droplet size of emulsions, including Nuclear Magnetic Resonance (NMR),11,12 Raman spectroscopy13 and confocal laser scanning microscope.14 However, the measurement error of above techniques is challenged especially at low water content. Therefore, it is of considerable scientific and also industrial significance to develop an easy, rapid and more accurate way to assess the dispersity of emulsions.
An alternative rapid and non-invasive method to characterise the dispersity of emulsions is reported here based on the interrelationship between the droplet size distribution and the characteristic dielectric properties of emulsions. An effective mixing model is proposed to correlate the dielectric constant of the emulsion system with the emulsion dispersity. For this, we have investigated the dielectric properties of emulsified oil having different water contents and droplet size distributions using a microwave cavity perturbation technique. The applicability of this technique for heavy oil emulsions is also demonstrated.
Theoretical considerations
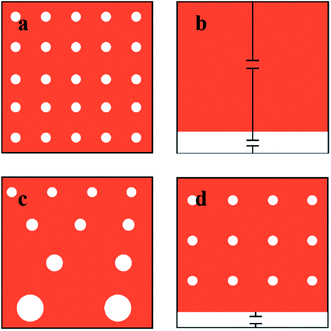
The dielectric properties of emulsions cannot be simply derived from the properties of the individual pure components due to the existence of interfacial polarization and local field corrections.15 Several theories, such as those of Maxwell,16 Wagner,17 Hanai15 and Lichtenecker,18 have been reported in the last century to estimate the dielectric properties of mixtures and thereafter used to predict or rationalise the dielectric properties of emulsions.19,20 However, these models are all based on the assumption that the dispersed phase is considered as assembly identical spheres in the continuous phase. In fact, a size distribution of dispersed droplets will always exist in a real emulsion system, and previous studies demonstrated that the size distribution of micelles influences the permittivity of the mixture.21 Therefore, it is essential to take carefully into account the dispersity of emulsion in any mixing model for dielectric properties.A monodispersed water-in-oil emulsion system, in which all the water droplets are assumed to be identical spheres, is illustrated in Fig. 1a. The dielectric constant of this system can be readily estimated by Lichtenecker theory18,22
ln![[thin space (1/6-em)]](https://www.rsc.org/images/entities/char_2009.gif) εm = φd εm = φd![[thin space (1/6-em)]](https://www.rsc.org/images/entities/char_2009.gif) ln ln![[thin space (1/6-em)]](https://www.rsc.org/images/entities/char_2009.gif) εd + (1 − φd)ln εd + (1 − φd)ln![[thin space (1/6-em)]](https://www.rsc.org/images/entities/char_2009.gif) εc εc |
When the two phases are fully phase-separated with the interface perpendicular to the orientation of the electric field, as is shown in Fig. 1b, this system can be considered as two serial capacitors, thus the dielectric constant in this case is given by
Here we have proposed an effective physical system which is equivalent to the real emulsion system (Fig. 1c), since a real emulsion could be regarded as a transition state from the monodispersed phase (Fig. 1a) to the separated phase (Fig. 1b). As illustrated in Fig. 1d, identical water drops are uniformly dispersed in the upper oil phase of this system, and the lower phase is water phase settled at the bottom. The dielectric constant of this system can be presented as
ln![[thin space (1/6-em)]](https://www.rsc.org/images/entities/char_2009.gif) εm = φw1 εm = φw1![[thin space (1/6-em)]](https://www.rsc.org/images/entities/char_2009.gif) ln ln![[thin space (1/6-em)]](https://www.rsc.org/images/entities/char_2009.gif) εd + (1 − φw1)ln εd + (1 − φw1)ln![[thin space (1/6-em)]](https://www.rsc.org/images/entities/char_2009.gif) εc εc |
Here a definition of dispersity factor D is given by
For a known emulsion composition, the dispersity factor D can be determined from the measured dielectric constants. The value of D is between 0 and 1, which can be understood as the degree of polydispersity of the water droplets. D = 1 denotes a monodispersed emulsion, while D = 0 suggests that the system has been fully separated into two phases. Hence, we can use the dispersity factor to describe the dispersity of real emulsion systems.
Results and discussion
Experimental setup
The dielectric properties of emulsions were measured via a microwave cavity perturbation measurement. The microwave cavity perturbation measurement system was fabricated in Inorganic Chemistry Laboratory at University of Oxford. The cavity (Fig. 2a) is made of aluminium and in a cylindrical shape. The cavity excitation is provided by two open-circuit SMA connectors coupled into the electric field at a frequency of 2.5 GHz. The TM010 mode is employed to establish a highly uniform E-field near the axis, resulting in a minimal depolarization of the sample in the measurement.23 The electric field distribution in this cavity simulated by COMSOL Multiphysics is shown in Fig. 2b. In the measurement, the sample was loaded into a quartz tube and placed in the centre of the cavity, since the inner tube radius (2 mm) is far smaller than the radius of cavity, the E-field applied to the sample can be regarded highly uniform.The measurements were performed using an Agilent E5071B network analyser by which the transmitted power |S21|2 was measured in the frequency domain, then we used non-linear least-square fitting to determine the resonant frequency f and the loaded quality factor Q. Loading the sample into the cavity causes a negative shift in the resonant frequency f (Fig. 2c) as a result of the sample polarization in response to the microwave electric field, thus we can derive the dielectric constant ε of emulsions from the variation in resonant frequency Δf using first order perturbation theory24
In this work, we measured the dielectric properties of emulsions using the microwave cavity perturbation technique. The attractive features of this approach are as follows: (1) it is a rapid measurement which takes only milliseconds, thus allowing this application to real time analysis and control; (2) instead of focusing on a single point, the microwaves penetrate the entire sample based on the sample holder dimension. Therefore, a reliable volumetric analysis of emulsions can be determined; (3) the microwave power level in the measurements is 0 dBm (i.e. 1 mW per rms), so there is negligible sample heating. We note that this technique is non-invasive and non-destructive, thereby providing a potential means of a rapid in situ industrial analysis.
Deviation from values predicted by theoretical models
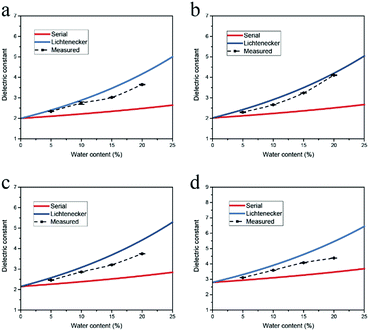
Initially we measured the dielectric properties of emulsions with different water contents (0–20.0 vol%) and compared the data with the values predicted by the mixing models. As shown in Fig. 3, the dielectric constant of water-in-oil emulsions increases rapidly with the water content, because the dielectric constant of water is much higher than the value of oil phase. The sensitivity to the water content offers potential applications of this technique for multiphase flow meters.25 MATLAB R2017a was employed to calculate the dielectric constant of emulsions from the mixing models. The results show that for a certain water content, the values predicted by Lichtenecker model are higher than the values calculated from serial capacitor model. The deviation between the measured dielectric constant and the two limiting predicted values arises from the polydispersity of the water phase, thus we can directly investigate the dispersity of emulsions through the variation of measured dielectric constant.Here we chose dodecane and hexadecane as model oils since their emulsions are transparent and can be accurately interrogated and analysed by the dynamic light scattering (DLS) technique. The dielectric constants as well as the droplet size distribution of water-in-dodecane emulsions for different emulsifying time were investigated using the microwave cavity analysis and DLS. As shown in Fig. 4a, the measured dielectric constant is near the value predicted by serial capacitor model at emulsifying time of 1 min, suggesting that the emulsion system is non-uniform. Then the dielectric constant has a rising trend with the emulsifying time, and correspondingly the dispersity factor increases from 0.04 at 1 min to 0.66 at 20 min (Fig. 4b).
The variation of dispersity factors is consistent with the DLS measurement results
The droplet size distributions obtained by DLS are illustrated in Fig. 4c. The multiple peaks at 1 min indicate a broad size distribution of water droplets. With an increase in the emulsifying time, the distribution peaks have a negative shift and a narrower bandwidth, demonstrating the emulsion system is more uniform. According to energy dissipation theory, the droplet size distribution for emulsification in the turbulent regime is determined by the energy density, dimensionally related to the residence time, the rotator speed and diameter.26,27 The average droplet size of dispersed phase should decrease with the increase of the emulsifying time, which is consistent with the measured DLS results.The measurements were also performed on a series of water-in-hexadecane emulsion samples which were prepared for different emulsifying time. As shown in Fig. 5a and b, though the water content of emulsions is rather low (2.0 vol%), the measured dielectric constant increases considerably with the emulsifying time increasing, and the dispersity factor rises from 0.03 at 5 min to 0.89 at 15 min. The size distribution determined by DLS verified that the polydispersity of samples reduces with the emulsifying time (Fig. 5c).
The droplet size distribution of emulsions is influenced significantly by the rotation speed during emulsion preparation. We conducted both the microwave cavity analysis and DLS on water-in-dodecane emulsions prepared with different rotation speeds, and the measured data and calculation results are shown in Fig. 6. The dielectric constant of emulsions slightly increases with the emulsifying rotation speed, and correspondingly the dispersity factor rises from 0.37 at 10![[thin space (1/6-em)]](https://www.rsc.org/images/entities/char_2009.gif) 000 rpm to 0.88 at 16
000 rpm to 0.88 at 16![[thin space (1/6-em)]](https://www.rsc.org/images/entities/char_2009.gif) 000 rpm. The energy density for emulsification increases with rotation speed, thus resulting in a smaller average droplet size. We note that the emulsions have a narrower distribution at a higher rotation speed, as illustrated in DLS size curves (Fig. 6c).
000 rpm. The energy density for emulsification increases with rotation speed, thus resulting in a smaller average droplet size. We note that the emulsions have a narrower distribution at a higher rotation speed, as illustrated in DLS size curves (Fig. 6c).
We also analysed a series of water-in-hexadecane emulsion samples prepared with various rotation speeds. As illustrated in Fig. 7, the dielectric constant as well as the dispersity factor rises with increasing rotation speed. The droplet distributions measured by DLS are consistent with the variation of the dielectric constant.
Therefore, we can verify that the dispersity factor most effectively describes the size distribution of dispersed droplets. A higher dispersity factor indicates a narrower droplet distribution and hence a more uniform emulsion. Importantly, the microwave cavity analysis is critically sensitive to the variation of droplet size distribution even at low water content due to the significant difference between the dielectric constant of water and oil. Although these measurements have been conducted at the ISM frequency of 2.45 GHz, it will also be possible to perform similar measurements on inhomogeneous mixtures of greater volume by increasing (proportionately) the size of the cavity, thus reducing the resonant frequency of the TM010 mode. One such frequency within an ISM band is around 900 MHz, for which the host cavity will have an internal diameter of around 25.5 cm. We have found in other work that it is possible to have a sample tube with an internal diameter of up to 5 cm, with a pair of axial chokes, thus maintaining a very high Q factor. For such a 900 MHz cylindrical cavity of aspect ratio diameter to height of 1![[thin space (1/6-em)]](https://www.rsc.org/images/entities/char_2009.gif) :
:![[thin space (1/6-em)]](https://www.rsc.org/images/entities/char_2009.gif) 1, this yields an active sample volume of up to 0.5 litres.
1, this yields an active sample volume of up to 0.5 litres.
Employed for emulsified heavy oil characterization
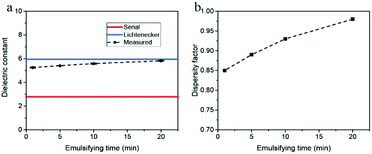
We also conducted the microwave cavity analysis on heavy fossil oil emulsions. Compared to paraffins, both the crude oil and tar oil have a rather complex composition, containing hundreds of compounds. Due to the opaqueness of emulsified oil, one cannot measure the droplet size distribution accurately using dynamic light scattering technique.10 Thus, it is of considerable value to examine if the microwave analysis could be applied to investigate the droplet size distribution of emulsified heavy oil.Water-in-crude oil emulsion samples with water content of 10.0 vol% were prepared for different emulsifying time, and a representative microscope image of these samples is shown in the ESI Fig. 2.† It can be observed that the water phase was extremely well dispersed in crude oil. The dielectric constants of these samples were investigated by the microwave cavity, and the measured data and calculation results are presented in Fig. 8. The dielectric constant of emulsions rises slightly with the emulsifying time, while the dispersity factor increases from 0.85 at 1 min to 0.98 at 20 min, indicating that the water-in-crude oil emulsions become more uniform as the emulsifying time increases.
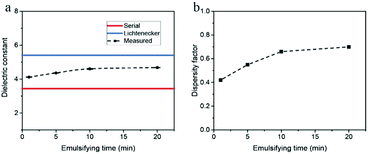
The microwave measurements were also performed on a series of water-in-tar oil emulsion samples which were prepared for various emulsifying time. As is shown in Fig. 9, the measured dielectric constant increases with the emulsifying time, and correspondingly the dispersity factor rises considerably from 0.42 at 1 min to 0.70 at 20 min. The variation of measured dielectric constant with the emulsifying time demonstrated that the microwave analysis is capable of characterizing heavy oil emulsions.
Conclusions
We hope to have illustrated the great utility and versatility of the microwave cavity perturbation technique to provide an accurate, non-invasive method for investigating the nature of emulsions, particularly the critically important dispersion properties in various stages of the emulsifying process. The systems investigated have ranged from model emulsions to fossil fuel emulsions, illustrating the great potential of this technique.Methods
Emulsion preparation
The emulsions were prepared utilizing a high shear homogenizer with a maximum rotation speed of 24![[thin space (1/6-em)]](https://www.rsc.org/images/entities/char_2009.gif) 000 rpm. A composite nonionic emulsifier was first dissolved in the oil phase, then a certain amount of deionized water was added, and shearing was performed at a fixed rotation speed. The emulsifier was a composite of Span 85 and Tween 85. In this study HLB (hydrophile-lipophile balance) = 4 gave stable water-in-oil emulsions. The volume fraction of emulsifier was 5 vol% in emulsion preparation. Dodecane (≥99%) and hexadecane (≥99%) were purchased from Sigma Aldrich and used without further purification. Light crude oil was provided by Saudi Aramco, and coal tar was purchased from Alfa Aesar. The physical properties of the crude oil sample are shown in the ESI Table 2.†
000 rpm. A composite nonionic emulsifier was first dissolved in the oil phase, then a certain amount of deionized water was added, and shearing was performed at a fixed rotation speed. The emulsifier was a composite of Span 85 and Tween 85. In this study HLB (hydrophile-lipophile balance) = 4 gave stable water-in-oil emulsions. The volume fraction of emulsifier was 5 vol% in emulsion preparation. Dodecane (≥99%) and hexadecane (≥99%) were purchased from Sigma Aldrich and used without further purification. Light crude oil was provided by Saudi Aramco, and coal tar was purchased from Alfa Aesar. The physical properties of the crude oil sample are shown in the ESI Table 2.†
Emulsion characterization
Dynamic Light Scattering (DLS) was also performed immediately after the emulsion preparation to measure the droplet size distribution using a Zetasizer Nano S (Malvern Instruments). We performed each test for three times and irreversible sedimentation was not detected in such short period of measurement. A detection angle of 173° was used and 10 runs were carried out in each measurement. A GXML3030 Trinocular Reflected and Transmitted Light Microscope (GT Vision) was used to observe the emulsified crude oil in this work.Conflicts of interest
There are no conflicts to declare.Acknowledgements
We are grateful for financial support from KACST, Saudi Arabia and EPSRC (EP/N009924/1). Yuqiang Yan thanks for a scholarship from the China Scholarship Council. We thank Professor Jason Davis for invaluable support in allowing access to the Dynamic Light Scattering equipment.References
- A. Lu, D. Moatsou, D. A. Longbottom and R. K. O'Reilly, Chem. Sci., 2013, 4, 965–969 RSC.
- S. Crossley, J. Faria, M. Shen and D. E. Resasco, Science, 2010, 327, 68–72 CrossRef PubMed.
- Y. Yan, L. Chen, J. Xu, M. Ren, J. Da and F. Cao, Chem. Eng. Process., 2016, 109, 90–96 CrossRef.
- N. Anton, J. P. Benoit and P. Saulnier, J. Controlled Release, 2008, 128, 185–199 CrossRef PubMed.
- L. D. Zarzar, V. Sresht, E. M. Sletten, J. A. Kalow, D. Blankschtein and T. M. Swager, Nature, 2015, 518, 520–524 CrossRef PubMed.
- E. Dickinson, Trends Food Sci. Technol., 2012, 24, 4–12 CrossRef.
- T. Tadros, Emulsion Formation and Stability, John Wiley & Sons, Incorporated, Weinheim, Germany, 2013 Search PubMed.
- P. K. Shivhare, A. Prabhakar and A. K. Sen, J. Micromech. Microeng., 2017, 27, 035003 CrossRef.
- R. Höhler, S. Cohen-Addad and D. J. Durian, Curr. Opin. Colloid Interface Sci., 2014, 19, 242–252 CrossRef.
- E. O. Fridjonsson, B. F. Graham, M. Akhfash, E. F. May and M. L. Johns, Energy Fuels, 2014, 28, 1756–1764 CrossRef.
- N. N. A. Ling, A. Haber, E. F. May, E. O. Fridjonsson and M. L. Johns, Colloids Surf., A, 2014, 462, 244–251 CrossRef.
- N. N. A. Ling, A. Haber, E. F. May, E. O. Fridjonsson and M. L. Johns, Chem. Eng. Sci., 2017, 160, 362–369 CrossRef.
- C. Houben, G. Nurumbetov, D. Haddleton and A. A. Lapkin, Ind. Eng. Chem. Res., 2015, 54, 12867–12876 CrossRef PubMed.
- S. Schuster, R. Bernewitz, G. Guthausen, J. Zapp, A. M. Greiner, K. Köhler and H. P. Schuchmann, Chem. Eng. Sci., 2012, 81, 84–90 CrossRef.
- T. Hanai, Kolloid-Z., 1960, 171, 23–31 CrossRef.
- J. C. Maxwell, A treatise on electricity and magnetism, Clarendon press, Oxford, 1881 Search PubMed.
- K. W. Wagner, Electrical Engineering (Archiv fur Elektrotechnik), 1914, vol. 2, pp. 371–387 Search PubMed.
- K. Lichtenecker, Phys. Z., 1931, 32, 255–260 Search PubMed.
- U. Erle, M. Regier, C. Persch and H. Schubert, J. Microwave Power, 2000, 35, 185–190 Search PubMed.
- B. R. Epstein, K. R. Foster and R. A. Mackay, J. Colloid Interface Sci., 1983, 95, 218–227 CrossRef.
- J. Greffe and C. Grosse, Prog. Electromagn. Res., 1992, 6, 41–100 Search PubMed.
- T. Zakri, J.-P. Laurent and M. Vauclin, J. Phys. D: Appl. Phys., 1998, 31, 1589 CrossRef.
- B. Liu, D. R. Slocombe, J. Wang, A. Aldawsari, S. Gonzalez-Cortes, J. Arden, V. L. Kuznetsov, H. AlMegren, M. AlKinany, T. Xiao and P. P. Edwards, Nat. Commun., 2017, 8, 514 CrossRef PubMed.
- O. Klein, S. Donovan, M. Dressel and G. Grüner, Int. J. Infrared Millimeter Waves, 1993, 14, 2423–2457 CrossRef.
- E. F. May, B. F. Graham, A. S. Chauhan and R. D. Trengove, Energy Fuels, 2008, 22, 3308–3316 CrossRef.
- S. Carrillo De Hert and T. L. Rodgers, Chem. Eng. Sci., 2017, 167, 265–277 CrossRef.
- J. A. Boxall, C. A. Koh, E. D. Sloan, A. K. Sum and D. T. Wu, Langmuir, 2012, 28, 104–110 CrossRef PubMed.
Footnote |
| † Electronic supplementary information (ESI) available. See DOI: 10.1039/c8sc00406d |
| This journal is © The Royal Society of Chemistry 2018 |


