
 Open Access Article
 This Open Access Article is licensed under a Creative Commons Attribution-Non Commercial 3.0 Unported Licence
Role of non-metallic atoms in enhancing the catalytic activity of nickel-based compounds for hydrogen evolution reaction†
Xingqun
Zheng‡
a,
Lishan
Peng‡
a,
Li
Li
*a,
Na
Yang
a,
Yanjun
Yang
a,
Jing
Li
a,
Jianchuan
Wang
ab and
Zidong
Wei
 *a
*a
aThe State Key Laboratory of Power Transmission Equipment & System Security and New Technology, Chongqing Key Laboratory of Chemical Process for Clean Energy and Resource Utilization, School of Chemistry and Chemical Engineering, Chongqing University, Shazhengjie 174, Chongqing 400044, P. R. China. E-mail: liliracial@cqu.edu.cn; zdwei@cqu.edu.cn; Tel: +86-2365678945
bKey Laboratory of Fuel Cell Technology of Hubei Province, Wuhan University of Technology, Wuhan 430070, P. R. China
First published on 4th January 2018
Abstract
The transition-metal compounds (MX) have gained wide attention as hydrogen evolution reaction (HER) electrocatalysts; however, the interaction between the non-metallic atom (X) and the metal atom (M) in MX, and the role of X in the enhanced catalytic activity of MX, are still ambiguous. In this work, we constructed a simple model [X/Ni(100)] to decipher the contribution of X towards enhancing the catalytic activity of NiX, which allows us to accurately predict the trend in HER catalytic activity of NiX based on the easily accessible physico-chemical characteristics of X. Theoretical calculations showed that the electronegativity (χX) and the principle quantum number (nX) of X are two important descriptors for evaluating and predicting the HER catalytic activity of NiX catalysts effectively. X atoms in the VIA group can enhance the HER activity of X/Ni(100) more significantly than those in the second period due to the large χX or nX. At a relatively low X coverage, the S/Ni(100) possesses the best HER activity among all of the discussed X/Ni(100) models, and the optimum surface S![[thin space (1/6-em)]](https://www.rsc.org/images/entities/char_2009.gif) :Ni atomic ratio is about 22–33%. Further experiments demonstrated that the Ni–Ni3S2 catalyst with a surface S:Ni atomic ratio of 28.9% exhibits the best catalytic activity and lowest charge transfer resistance. The trend in catalytic activity of NiX with differing X offers a new possible strategy to exploit MX materials and design new active catalysts rationally.
:Ni atomic ratio is about 22–33%. Further experiments demonstrated that the Ni–Ni3S2 catalyst with a surface S:Ni atomic ratio of 28.9% exhibits the best catalytic activity and lowest charge transfer resistance. The trend in catalytic activity of NiX with differing X offers a new possible strategy to exploit MX materials and design new active catalysts rationally.
1 Introduction
The hydrogen economy provides an efficient and environmentally friendly pathway to store and consume energy. Water electrolysis has become a promising pathway for sustainable hydrogen production.1–3 The electrocatalytic hydrogen evolution reaction (HER) from water typically incorporates noble metals such as Pt and Pd in catalysts because of their low overpotential and fast kinetics.4–6 However, the scarcity and high cost of those noble metals make their application in viable commercial processes unattractive. Recently, several non-noble metal materials,7–12 especially transition-metal compounds (MX) such as nitrides,13,14 oxides,15,16 borides,17 carbides,18–20 sulfides21–23 and selenides,24,25 have been found to have promising properties that make them potential substitutes for Pt-group metal catalysts for HER.MX catalysts with different composition elements, especially those with a non-metallic element X, exhibit different catalytic activities for HER. For example, WC and MoC are much more active as HER catalysts than other carbides,26,27 α-Mo2C is more active than γ-Mo2N in alkaline solution,28 and CoSe2 exhibits higher catalytic activity than CoS2 in acid solution.25 In addition to the composition elements, the HER activity and efficiency of these MX materials are also highly dependent on the M:X atomic ratio,29 crystal structure30 and surface structure31,32 of MX. Nan Jiang’s group23 reported three crystalline nickel sulfides, NiS, NiS2, and Ni3S2, and their intrinsic HER activities follow the order of Ni3S2 > NiS2 > NiS. Leonard’s group20 synthesized four different phases of MoC and revealed that their HER activities increase in the order of α-MoC1−x < η-MoC < γ-MoC < β-Mo2C.
Compared to the parent metal (M), the remarkable catalytic activity of MX can be attributed to the distinct electronic structure induced by the presence of X, for example carbon, nitrogen, or sulfur, in the metal lattice. DFT calculations33,34 have suggested that the hybridization between metal and carbon orbitals gives rise to a higher electron density of states at the Fermi level and a broad unoccupied d-band, affording characteristics that resemble those of the Pt-group metals. Similar phenomena also exist in metal nitrides, in which the smaller deficiency in the d-band occupation of the metal causes the nitride surface to exhibit an electron donating ability.33,35,36 However, for MX with differing X, the main reason for the catalytic activity of MX is still unclear and hard to distinguish due to the existence of a range of comprehensive factors, including X species, M:X ratio, crystal structure and surface structure. In order to further exploit MX materials and design new catalysts rationally, it is crucial to understand the specific role of the non-metallic element and the MX structure in determining the overall catalytic activity. Nevertheless, even with a comprehensive consideration of all mentioned crucial factors, it would be difficult to decipher the contributions of X or structure by means of either experiment or theoretical calculation. Thus, it is necessary to construct a simplified MX model with only a single variable to shed light on the different factors affecting catalytic activity.
In this work, we chose Ni(100) as the parent metal and several non-metallic atoms (X = B, C, N, O, S, Se and Te) as ad-atoms to construct a simple theoretical model [X/Ni(100)], and we explored the contribution of X towards enhancing the catalytic activity of MX. For each type of X, the geometric structure, electronic structure and HER catalytic activity of X/Ni(100) was calculated to assess the role of the physico-chemical characteristics of X, such as the electronegativity, atomic radius, and the electronic configuration. The H adsorption free energy (ΔGH*) of X/Ni(100) was determined as a function of X type, surface X:Ni atomic ratio and H coverage. Subsequently, the relationships between the physico-chemical characteristics of X and the catalytic activity of X/Ni(100) were constructed to evaluate and predict the catalytic activity of the NiX catalysts. Finally, a series of Ni-based catalysts with differing S content were synthesized to demonstrate the theoretical prediction.
2 Computational details
All spin-polarized periodic DFT calculations in this study were carried out using the Vienna Ab Initio Simulation Package (VASP) code.37 The ion–electron interaction was described with the projector augmented wave (PAW) method.38 Electron exchange-correlation was represented by the functional of Perdew, Burke, and Ernzerhof (PBE) of generalized gradient approximation (GGA).39 A cutoff energy of 450 eV was used for the plane-wave basis set. (3 × 3 × 1) and (5 × 5 × 1) Monkhorst–Pack k-point meshes were used for k-space integration in our structure relaxations and surface calculations respectively. In all of the calculations, the convergence criterion of the electronic structures was set to 10−5 eV, and the atomic positions were allowed to relax until the forces were less than 0.01 eV Å−1.A five layered Ni(100) slab model with a (3 × 3) unit cell was employed to simulate the catalyst surface. To separate the slab from its periodic images and to avoid spurious interactions, a vacuum height of 18 Å along the vertical direction was selected. In all of the structure optimization calculations, the bottom two layers were fixed, while the other atoms were fully relaxed. The X/Ni(100) was simulated simplistically by the adsorption of ad-atoms on the Ni(100) surface to ensure one variation and to distinguish the role of X in the catalytic activity.
The adsorption model of X on Ni(100) is displayed in Fig. 1, in which the four-fold hollow site on the Ni(100) surface is the most stable adsorption site for ad-atoms.40,41 The interface Ni atoms which are closest to X and the hydrogen adsorption site are marked using yellow and green circles respectively.
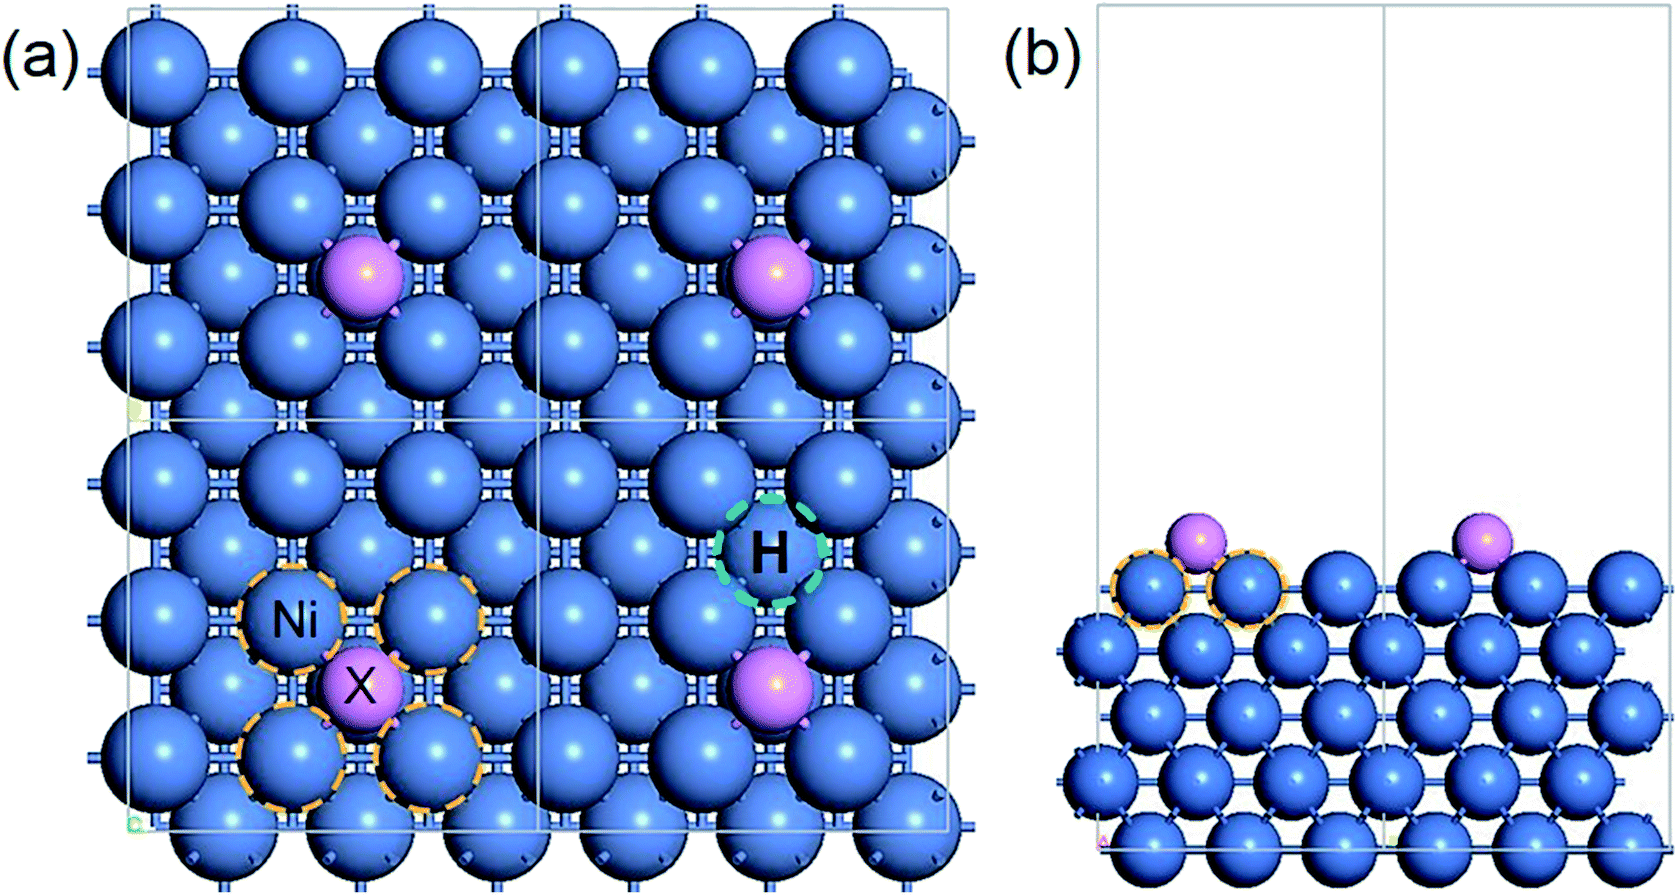 | ||
| Fig. 1 The periodic structure of X/Ni(100): (a) top view; (b) side view. Color code: blue, Ni atoms; purple, X atoms; yellow circle, interface Ni atoms; green circle, H adsorption site. | ||
The binding energies of X on the Ni(100) surface (ΔEX) and the hydrogen adsorption energies on the X/Ni(100) surface (ΔEH*) were calculated using the following expressions:
| ΔEX = EX/Ni − ENi − EX | (1) |
| ΔEH* = 1/n(EX/Ni+nH − EX/Ni − n/2EH2) | (2) |
The H adsorption free energy (ΔGH*) was calculated according to:
| ΔGH* = ΔEH* + ΔZPE − TΔSH* | (3) |
3 Results and discussion
3.1 The adsorption of X on Ni(100)
The stable geometric structures of X/Ni(100) illustrated in Fig. 2 and Fig. S1† show that the X atoms exhibit two kinds of adsorption structure on the Ni(100) surface. It can be seen that the B, C, and N atoms are nearly coplanar with the surface Ni atoms and bond with five Ni atoms (four top-layer Ni atoms and one sub-layer Ni atom), while the O, S, Se, and Te atoms are slightly above the Ni(100) surface plane and bond with four top-layer Ni atoms. This is because the X atoms in the VIA group have lone pair electrons,40 which by localizing block the binding of X atoms with the second layer of Ni atoms. Additionally, as shown in Fig. 2, for B, C, and N atoms with coplanar adsorption structures, the X–Ni bond length (dX–Ni) decreases with decreasing atomic radius of X (RX); for O, S, Se, and Te atoms, dX–Ni increases gradually with increasing RX. Although the O atom has the smallest atomic radius of the atoms in this period, the dO–Ni is the longest of all of the dX–Ni in the period due to the non-planar adsorption structure. Therefore, RX and adsorption structure jointly dominate the change of dX–Ni.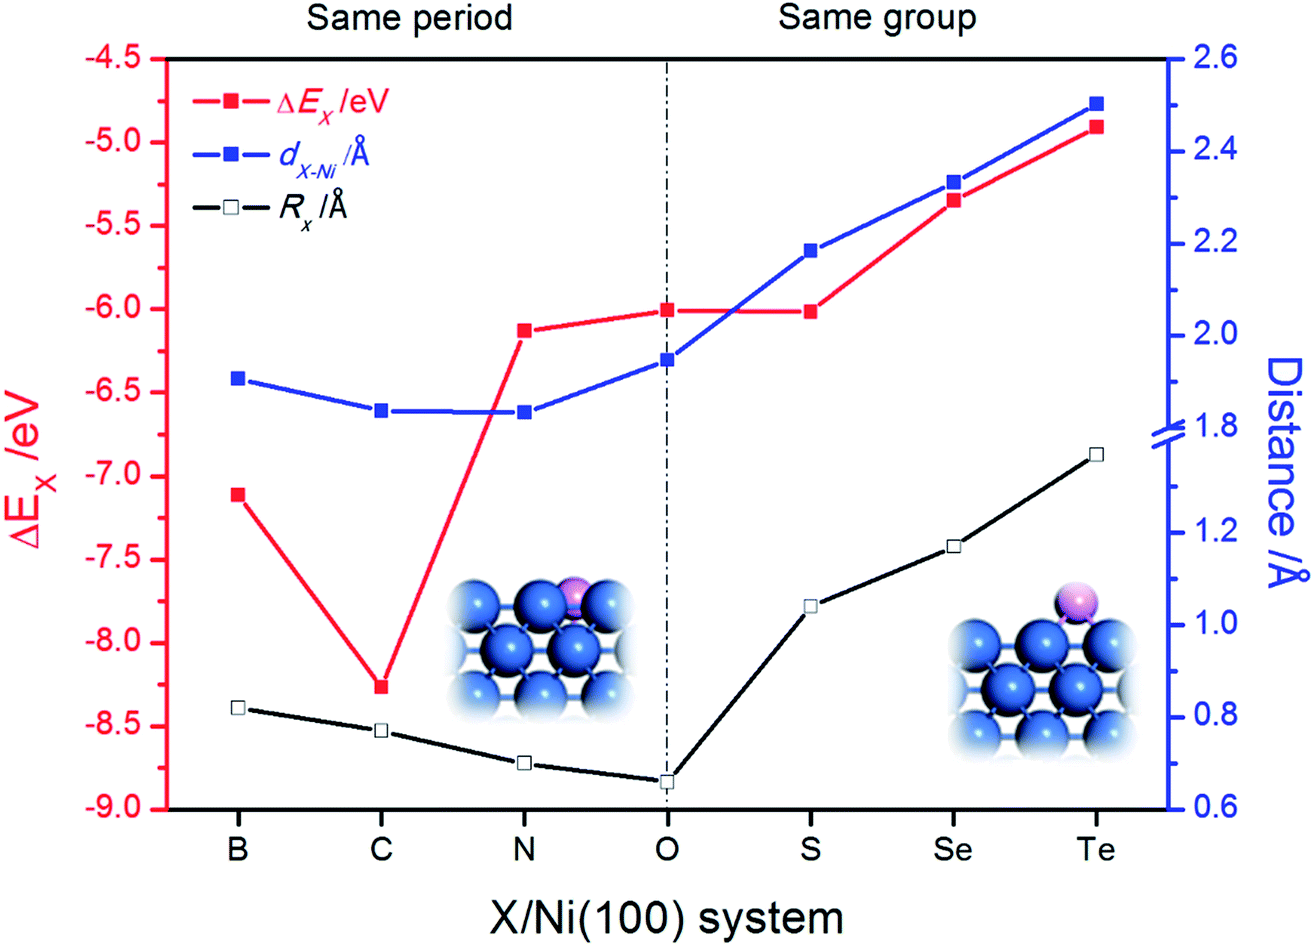 | ||
| Fig. 2 The change of binding energy of X on the Ni(100) surface (ΔEX), the X–Ni bond length (dX–Ni) and the atomic radius of X (RX). The insets are the side views of partial X/Ni(100) structures. | ||
Unlike dX–Ni, the binding energy of X on Ni(100) (ΔEX) displays a totally different change tendency. In the second period, the C atom exhibits the most negative ΔEX due to it having the strongest interaction with Ni(100). Then, ΔEX changes slightly from N to S, and increases gradually from S to Te, indicating that the X–Ni bonds of the VIA group are weaker than those of the second period. The partial density of states (PDOS) and projected crystal orbital Hamilton population (pCOHP) curves for the X–Ni interaction in each X/Ni(100) system, shown in Fig. 3, reveal that the electron configuration of the X atom greatly affects the interaction between X and Ni(100). In Fig. 3, the up peaks between −7 eV and −2 eV in the pCOHP curves, resulting from the interaction of X with the surface Ni shown in the PDOS, correspond to the strong bonding states of X–Ni bond, and the down peaks in the pCOHP curves represent the antibonding states. As shown in Fig. 3(a)–(d), the bonding states of B–Ni are partially filled with electrons, while those of C–Ni, N–Ni and O–Ni are all fully filled with electrons. Although the X–Ni bonding states are slightly shifted down in energy when X changes from B to N, the gradually increasing occupation of the antibonding states below the Fermi level weakens the X–Ni bond along the sequence from C to O. Notably, the nearly empty antibonding states of the C–Ni bond largely strengthen the C–Ni bond. This phenomenon can be attributed to the electron configuration of the C atom. In the second period, with increasing valence electrons, the shrinking of the electronic shells from B to O induces the slight down-shifting of the X–Ni bonding states in energy. At the same time, the valence electrons of X (2s22p1–4) and the Ni (3d84s2) fill into both bonding orbitals and antibonding orbitals, and only the valence electrons of the C atom (2s22p2) can exclusively fill up the bonding orbitals and keep the antibonding orbitals empty to stabilize the bond to the greatest extent. In Fig. 3(d)–(g), the antibonding states of X–Ni are all partially filled due to there being the same number of valence electrons of each X (ns2np4) in the VIA group. The bonding states of X–Ni shrink obviously in intensity and shift up gradually in energy with X varying from O to Te, indicating the gradually weakened X–Ni bond. This is mainly attributed to the effect of the principal quantum number of X (nX). As nX increases, the number of electronic shells increases, thus the electrons would stay at a higher potential energy. Correspondingly, the overlapping between the X-np orbital and the Ni-3d orbital becomes smaller and the energy shifts up steadily.
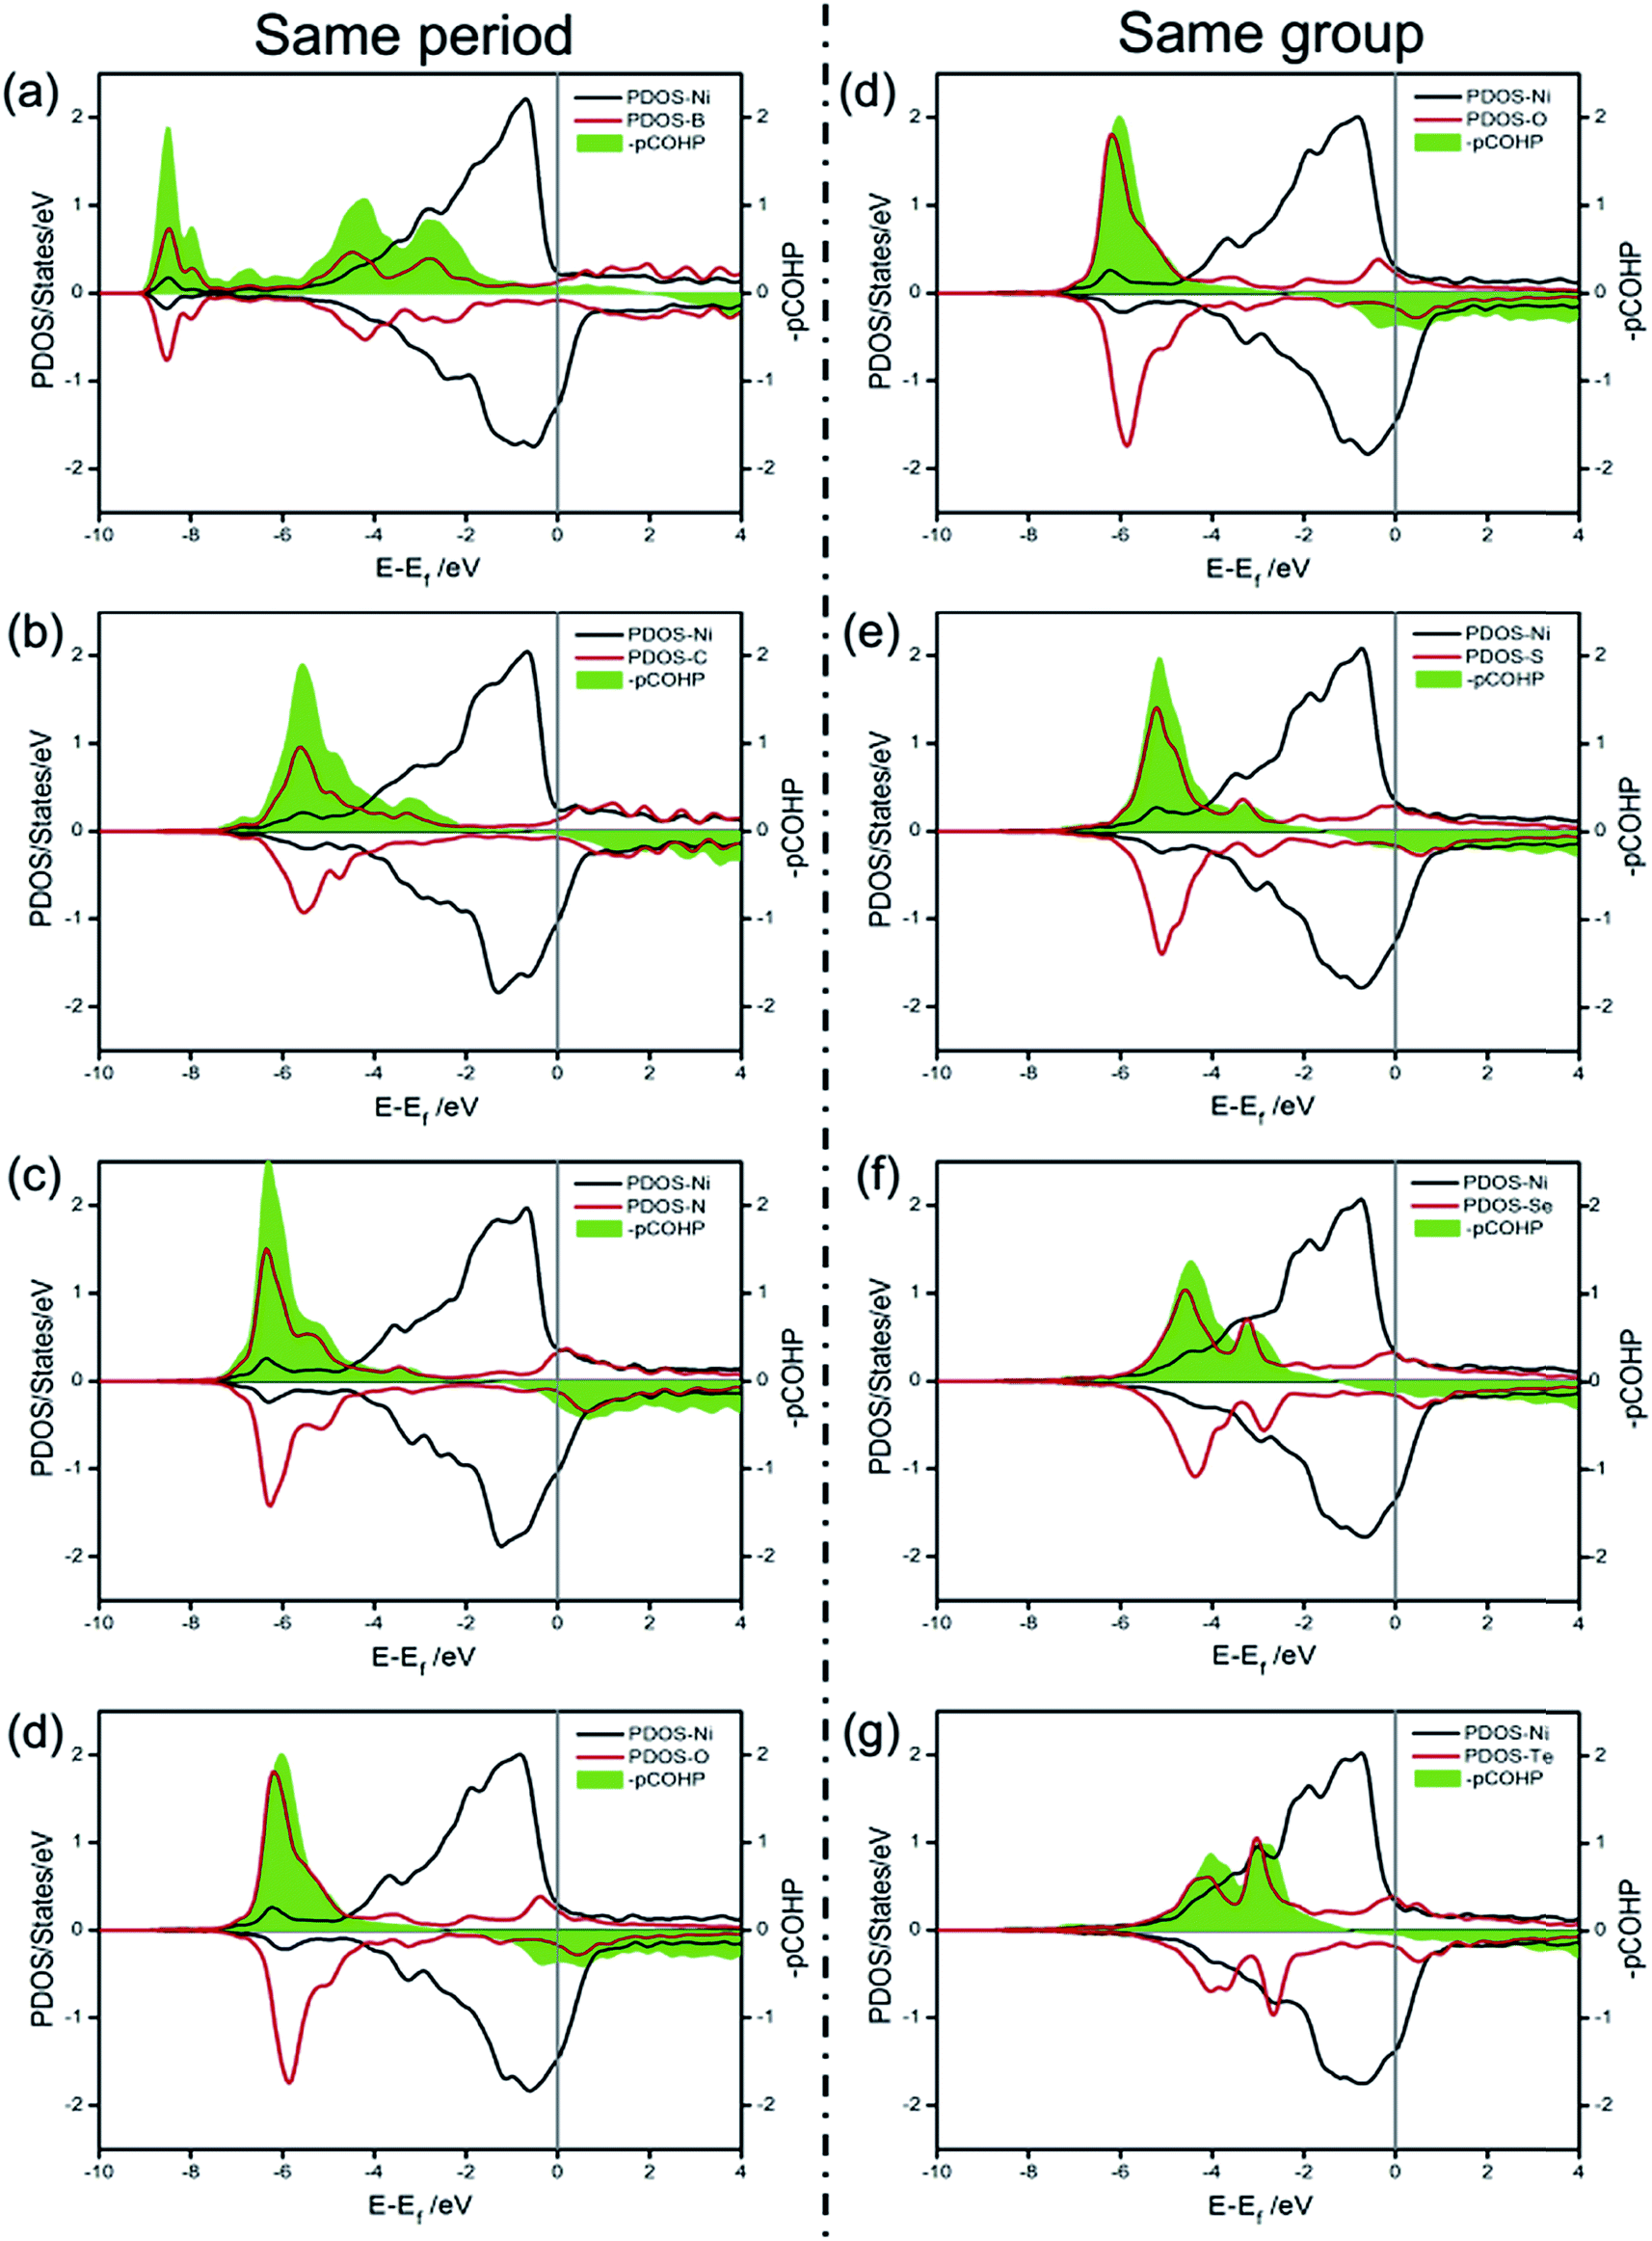 | ||
| Fig. 3 The partial density of states (PDOS) and projected crystal orbital Hamilton population (pCOHP) curves for the X–Ni interaction in each X/Ni(100) system: (a) B/Ni(100); (b) C/Ni(100); (c) N/Ni(100); (d) O/Ni(100); (e) S/Ni(100); (f) Se/Ni(100); (g) Te/Ni(100). | ||
Charge transfer and rearrangement would occur when the X–Ni bond is formed. The charge density difference, the Bader charges of X (QX) and the interface Ni (QNi) in the X/Ni(100) systems shown in Fig. 4 indicate the charge transfer from the interface Ni atoms to the X atom. The red regions between the X atom and the interface Ni atoms denote the electron accumulation, which becomes gradually more centralized on the X atom along the series from B to O, and more diffused from O to Te, indicating that the degree of charge transfer increases in the same period, and decreases in the same group. This trend is consistent with that observed on the Bader charge. As shown in Fig. 5, the interface Ni atoms possess the most positive charge in O/Ni(100), while they have the smallest charge value in B/Ni(100) and Te/Ni(100). This change of QNi is most likely due to the differences in electronegativity of X (χX). In addition, the Fermi level of the X/Ni(100) system (Ef) displayed in Fig. 5 also changes regularly with X. The Ef does not alter significantly in the same period, while it increases dramatically in the same group. The Ef of X/Ni(100) in the VIA group is higher than that of this in the second period. The variation of the Ef is mainly due to the different nX values. Thus, it can be seen that χX and nX are two important descriptors, which can characterize the surface electronic structure of X/Ni(100) straightforwardly. Then, the structure–activity relationship of X/Ni(100) for HER can be ascertained by connecting the physico-chemical characteristics of X with the HER activity of X/Ni(100) effectively.
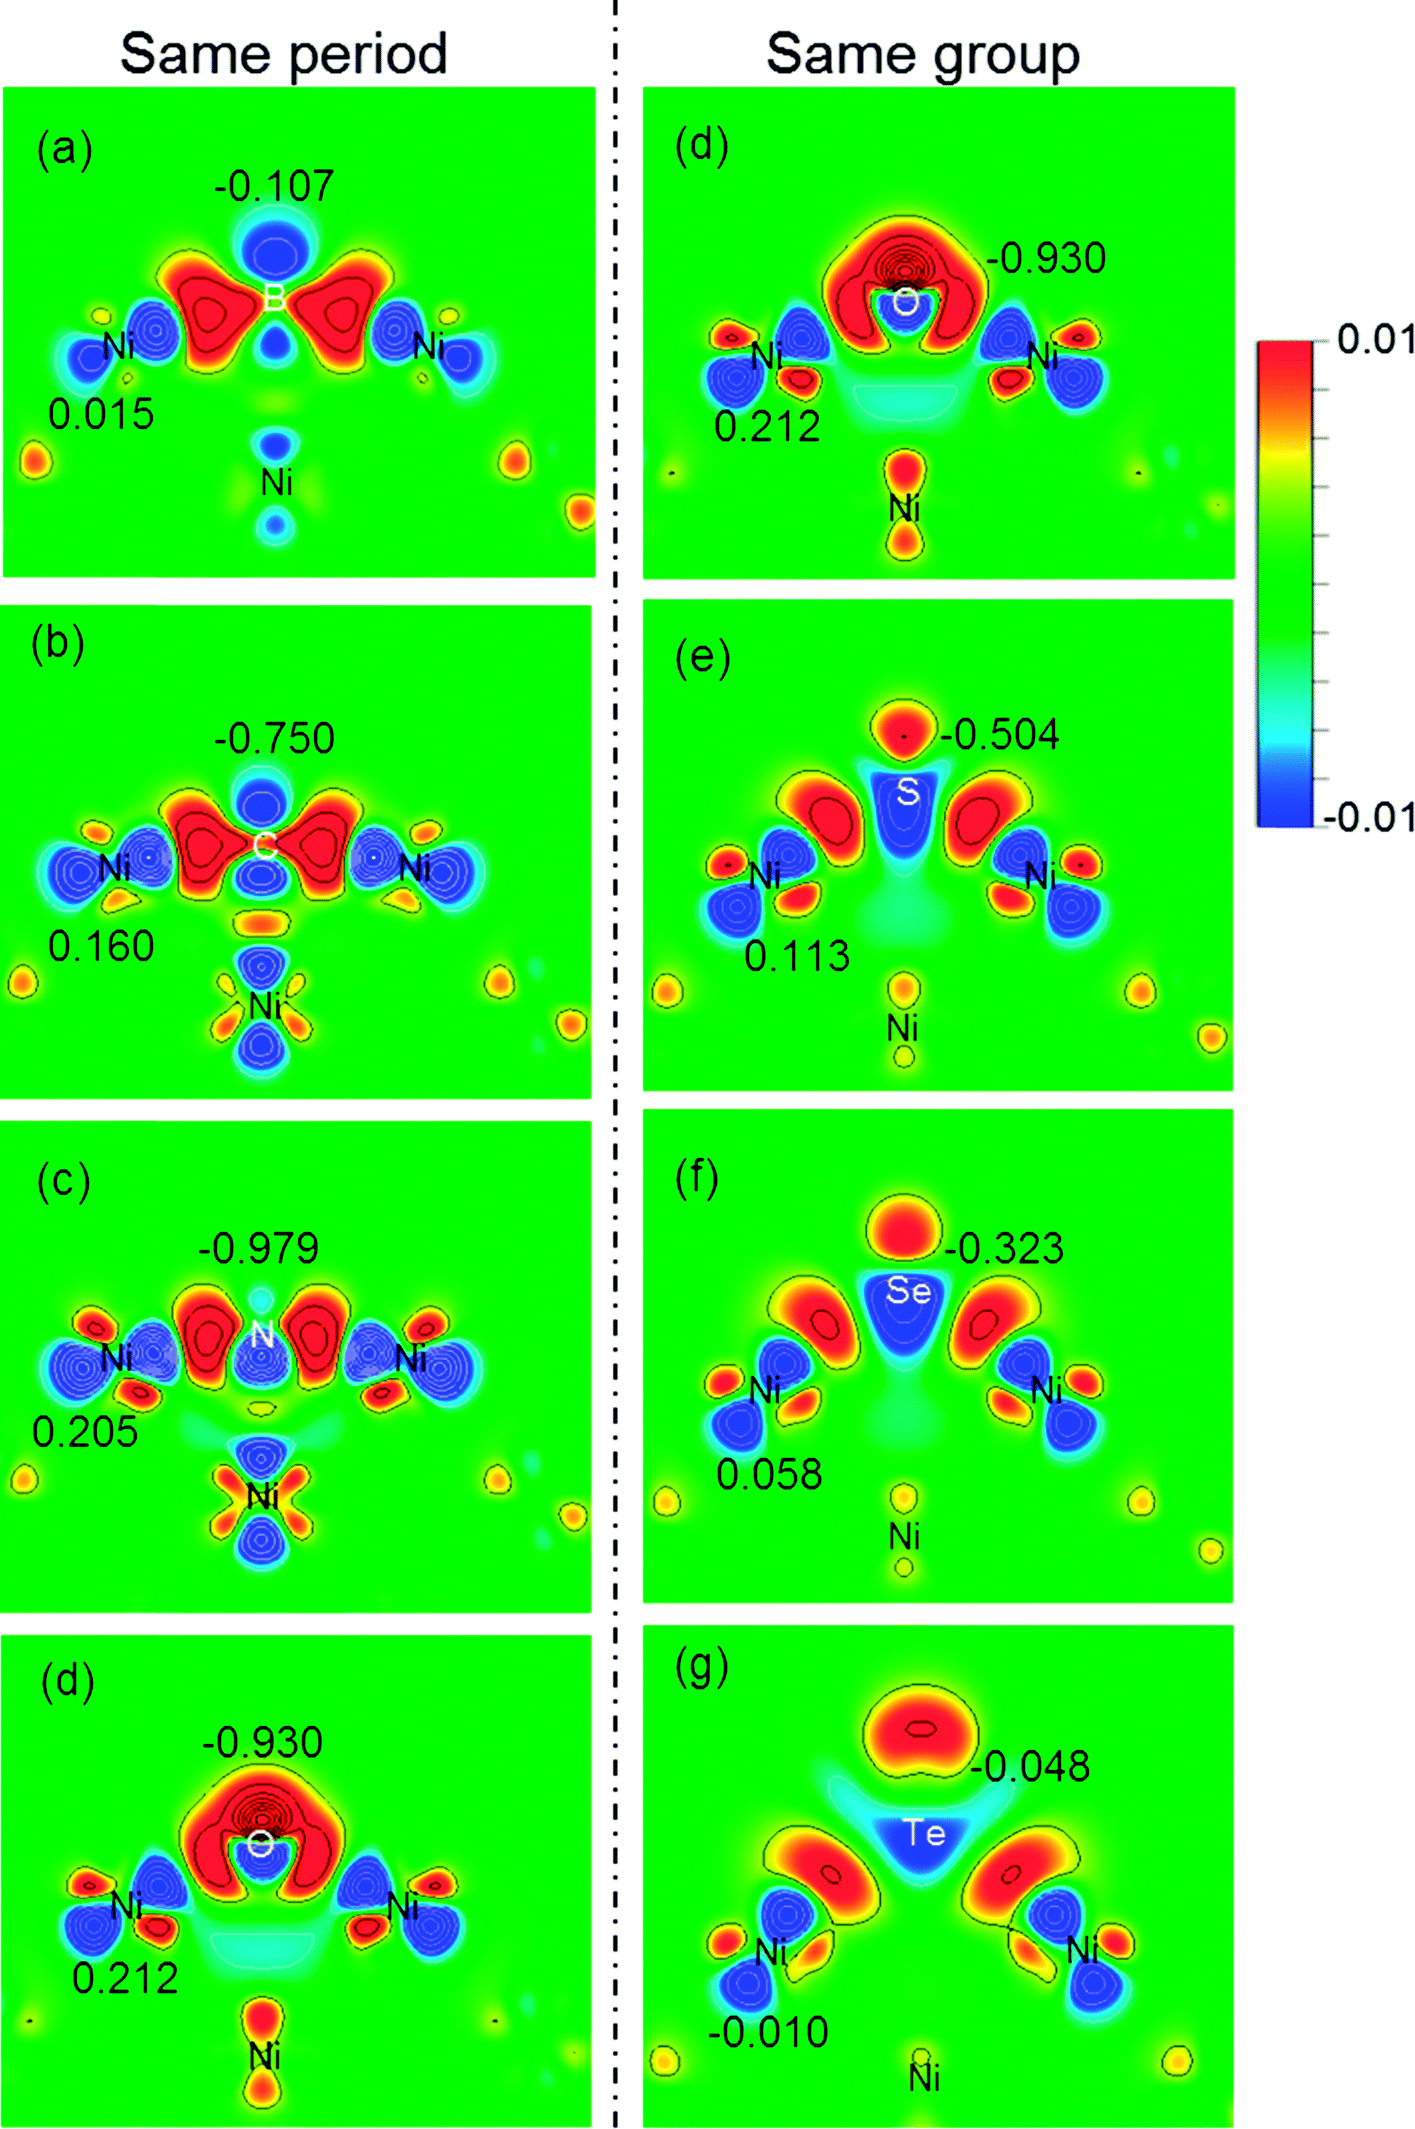 | ||
| Fig. 4 The charge density difference plots (ranging from −0.01 to 0.01e Å−3) that contain the X–Ni bond and the corresponding Bader charge (Q/e) in the X/Ni(100) systems: (a) B/Ni(100); (b) C/Ni(100); (c) N/Ni(100); (d) O/Ni(100); (e) S/Ni(100); (f) Se/Ni(100); (g) Te/Ni(100). | ||
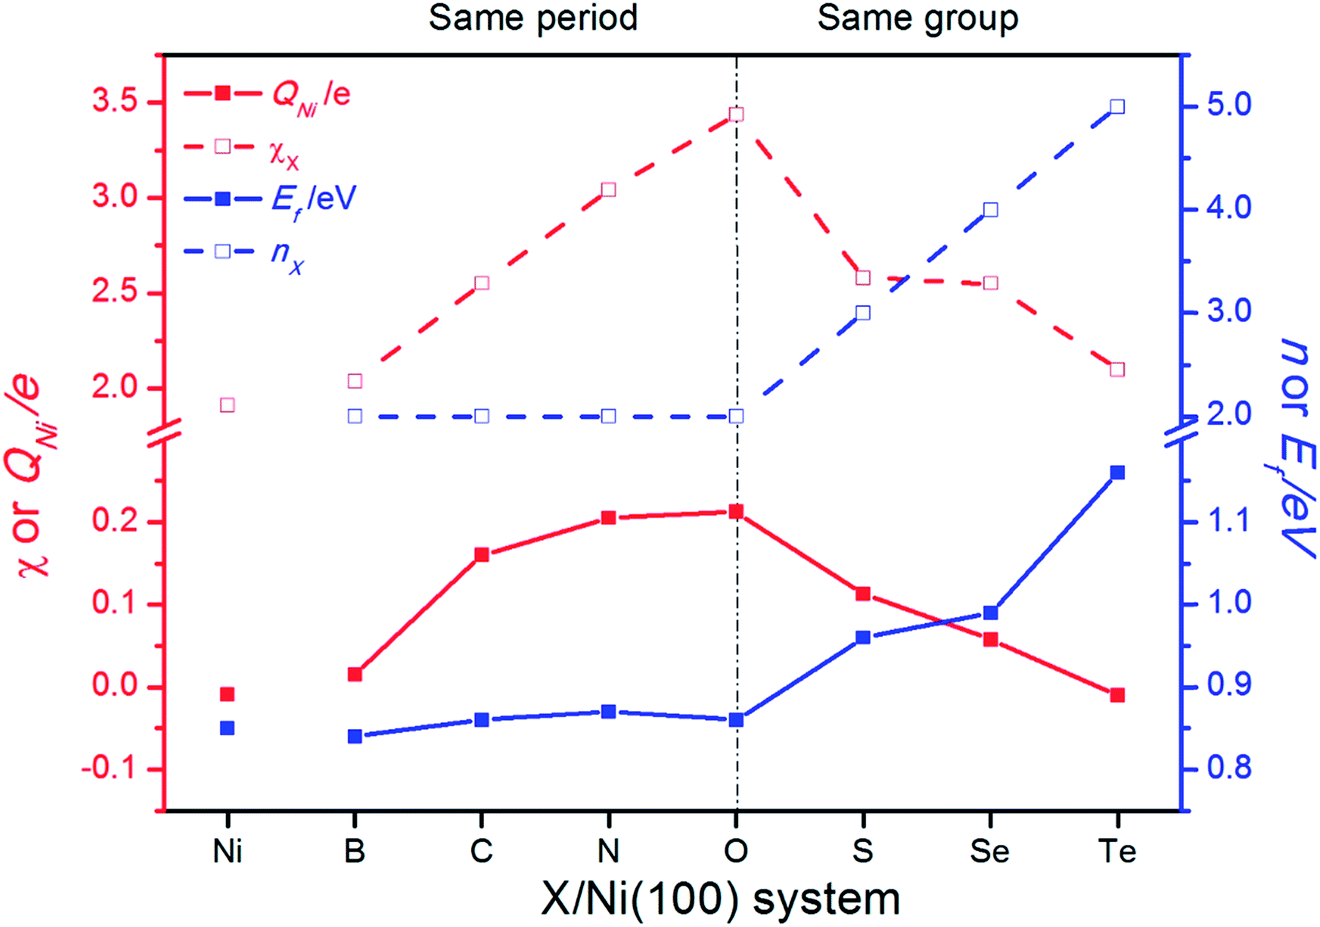 | ||
| Fig. 5 The change of the electronegativity (χX) and principle quantum number of X (nX), the average Bader charge of interface Ni atoms (QNi), and the Fermi level (Ef) of X/Ni(100). | ||
3.2 The HER catalytic activity of X/Ni(100)
The adsorption free energy of hydrogen (ΔGH*) is a major descriptor of HER activity for a wide range of catalysts. As pointed out by many previous studies4,42–44 neither too strong nor too weak hydrogen binding would favor the overall reaction. So the optimum ΔGH* value should be around 0 eV.45,46 To evaluate the HER activity of X/Ni(100), the ΔGH* of each X/Ni(100) model is calculated and illustrated in Fig. 6(a). As expected, all of the X/Ni(100) models show a higher ΔGH* value than that of pure Ni(100), confirming that X can modulate the H-binding energy and improve the HER catalytic activity of X/Ni(100) effectively. Obviously, the HER activity of X/Ni(100) in the VIA group is superior to that of this in the second period, and among the various X/Ni(100) models, the S/Ni(100), Se/Ni(100), and Te/Ni(100) exhibit the best HER activity due to their preferable H-binding energy and ΔGH* values. | ||
| Fig. 6 (a) The hydrogen evolution free energy diagram for each X/Ni(100) system. (b) The H adsorption free energy (ΔGH*), Ef and QNi for each X/Ni(100) system. (c) The ΔGH* of Xn/Ni(100) (X in the VIA group). (d) The ΔGH* of X3/Ni(100) (X in the VIA group) at different H coverages (θH). | ||
To better understand the HER activity trend of X/Ni(100), we correlated the HER activity (ΔGH*) with the electronic structures of X/Ni(100). As shown in Fig. 6(b), the ΔGH* of X/Ni(100) increases sharply from B/Ni(100) to S/Ni(100), and slowly from S/Ni(100) to Te/Ni(100). The trend of ΔGH* is dominated by the electronic structure of X/Ni(100), i.e. QNi and Ef. Both QNi and Ef affect the H-binding energy significantly. QNi affects the charge transfer from the catalyst to H. A positive QNi means a difficult charge transfer from X/Ni(100) to H. The more positive QNi is, the weaker the H adsorption is. Ef determines the overlap between the X/Ni(100) orbital and the H orbital. The higher Ef is, the less orbital overlap there is, indicating weaker H-binding energy. From B/Ni(100) to O/Ni(100), Ef varies slightly, but the increasing QNi increases the ΔGH* of X/Ni(100) gradually. Though S/Ni(100) has a smaller QNi than that of O/Ni(100), the higher Ef weakens the H-binding energy obviously, so S/Ni(100) shows a relatively optimum ΔGH*. From S/Ni(100) to Te/Ni(100), the increasing Ef weakens the H-binding energy, and the decreasing QNi enhances the interaction between X/Ni(100) and H simultaneously. The two opposite effects induce a very slight alteration of ΔGH*. Accordingly, the X/Ni(100) with positive QNi or high Ef should have a relatively weak H-binding energy, and therefore exhibit a comparatively high HER catalytic activity. Thus, QNi and Ef should be the two most important electronic properties by which the HER catalytic activity of X/Ni(100) can be effectively predicted. Certainly, according to the relationship between the electronic structure of X/Ni(100) and X, the HER catalytic activity of X/Ni(100) can also be successfully linked with the physico-chemical characteristics of X. Therefore, relying on χX and nX of X, X/Ni(100) catalysts with high catalytic activity can be designed and screened more conveniently. Obviously, larger χX and nX correspond to more positive QNi and higher Ef, which can weaken the H-binding energy, and then enhance the HER catalytic activity of X/Ni(100) when compared to pure Ni. It should be mentioned that too large χX and nX might induce heavily weakened H-binding energy, which can lower the HER activity of catalysts.
Because the X/Ni(100) models in the VIA group had much higher catalytic activity than those in the second period, the effect of the X coverage and H coverage on the HER activity were studied further for the X/Ni(100) models in the VIA group (the corresponding structures are displayed in Fig. S2 and S3†). In Fig. 6(c), the ΔGH* of Xn/Ni(100) increases with the increasing number of X (n). When n increases to 4, the ΔGH* of Xn/Ni(100) changes from a negative value to a positive one. It means that the Xn/Ni (100) with a higher X coverage has weaker H-binding energy than that with a lower X coverage. At n = 3, ΔGH* of S3/Ni(100) is closer to 0 eV than all of the other X3/Ni(100) models, indicating the best HER activity. At n = 4, the ΔGH* of Te4/Ni(100) is much closer to 0 eV, exhibiting the highest HER activity. Compared with Pt (111) (|ΔGH*| = 0.178 eV), the optimal surface X:Ni atomic ratio for On/Ni(100) and Sn/Ni(100) should be greater than 2:9 (22%) and close to 1:3 (33%), and the optimal surface X:Ni atomic ratio for Sen/Ni(100) and Ten/Ni(100) is between 2:9 (22%) and 4:9 (44%). In addition, a high H coverage (θH) can weaken the H-binding energy further. For the X3/Ni(100) systems, the ΔGH* of X3/Ni(100) in Fig. 6(d) increases with increasing θH, and the ΔGH* of S3/Ni(100) is relatively closer to 0 eV at a wide range of θH. This indicates that S3/Ni(100) should have the best HER performance and is the most promising HER catalyst among all of the discussed X3/Ni(100) models at a relatively low X coverage.
To confirm the above theoretical prediction, a series of Ni catalysts with different sulfuration degrees were synthesized by a hydrothermal-hydrogen reduction method (see ESI† for more details). The crystal structures of all of the samples were confirmed using X-ray diffraction analysis (XRD), which reflects the bulk structure of catalysts. The XRD patterns shown in Fig. 7(a) reveal that the products are composed of Ni and Ni3S2. From Ni–Ni3S2-1 to Ni–Ni3S2-5, the intensity of the Ni3S2 peak increases and the intensity of the Ni peak decreases, indicating that the content of Ni3S2 gradually increases with increasing sulfuration degree. More importantly, with increasing S content, the peak position of the Ni composite continuously upshifts, revealing that the successful modulation of S in these samples affects the crystal structure of Ni (inset in Fig. 7(a)).47–49 These results are consistent with the X-ray photoelectron spectroscopy (XPS) data. In Fig. S4,† the main peaks observed at binding energies of 855.9 eV for Ni 2p3/2 and 874.1 eV for Ni 2p1/2 are characteristic of Ni3S2. In addition, the binding energy of the Ni 2p3/2 peak at around 852.5 eV is characteristic of Ni0 in Ni metal. Compared with the XPS of pure Ni3S2 (shown in Fig. S5†), the Ni 2p3/2 and Ni 2p1/2 lines surprisingly contain peaks at 853.5 eV and 871.4 eV respectively, which can be indexed to the S decorated Ni species (Ni–S).50 This confirms that the modulation of S indeed affects the surface state of the Ni metal. Comparing the Ni XPS spectra of all five samples, the atomic ratio of the S decorated Ni species (Ni–S) to Ni0 gradually increases with increasing sulfuration degree, indicating that the S coverage on Ni metal can be continuously tuned by changing the sulfuration degree. According to the XPS analysis, the atomic ratio of Ni–S to Ni0 in each sample was calculated and listed in Table S5.† The scanning electron microscopy (SEM) images of the products (Fig. S6†) show that all of the Ni–Ni3S2 catalysts possess similar morphologies to that of the pure Ni catalyst.
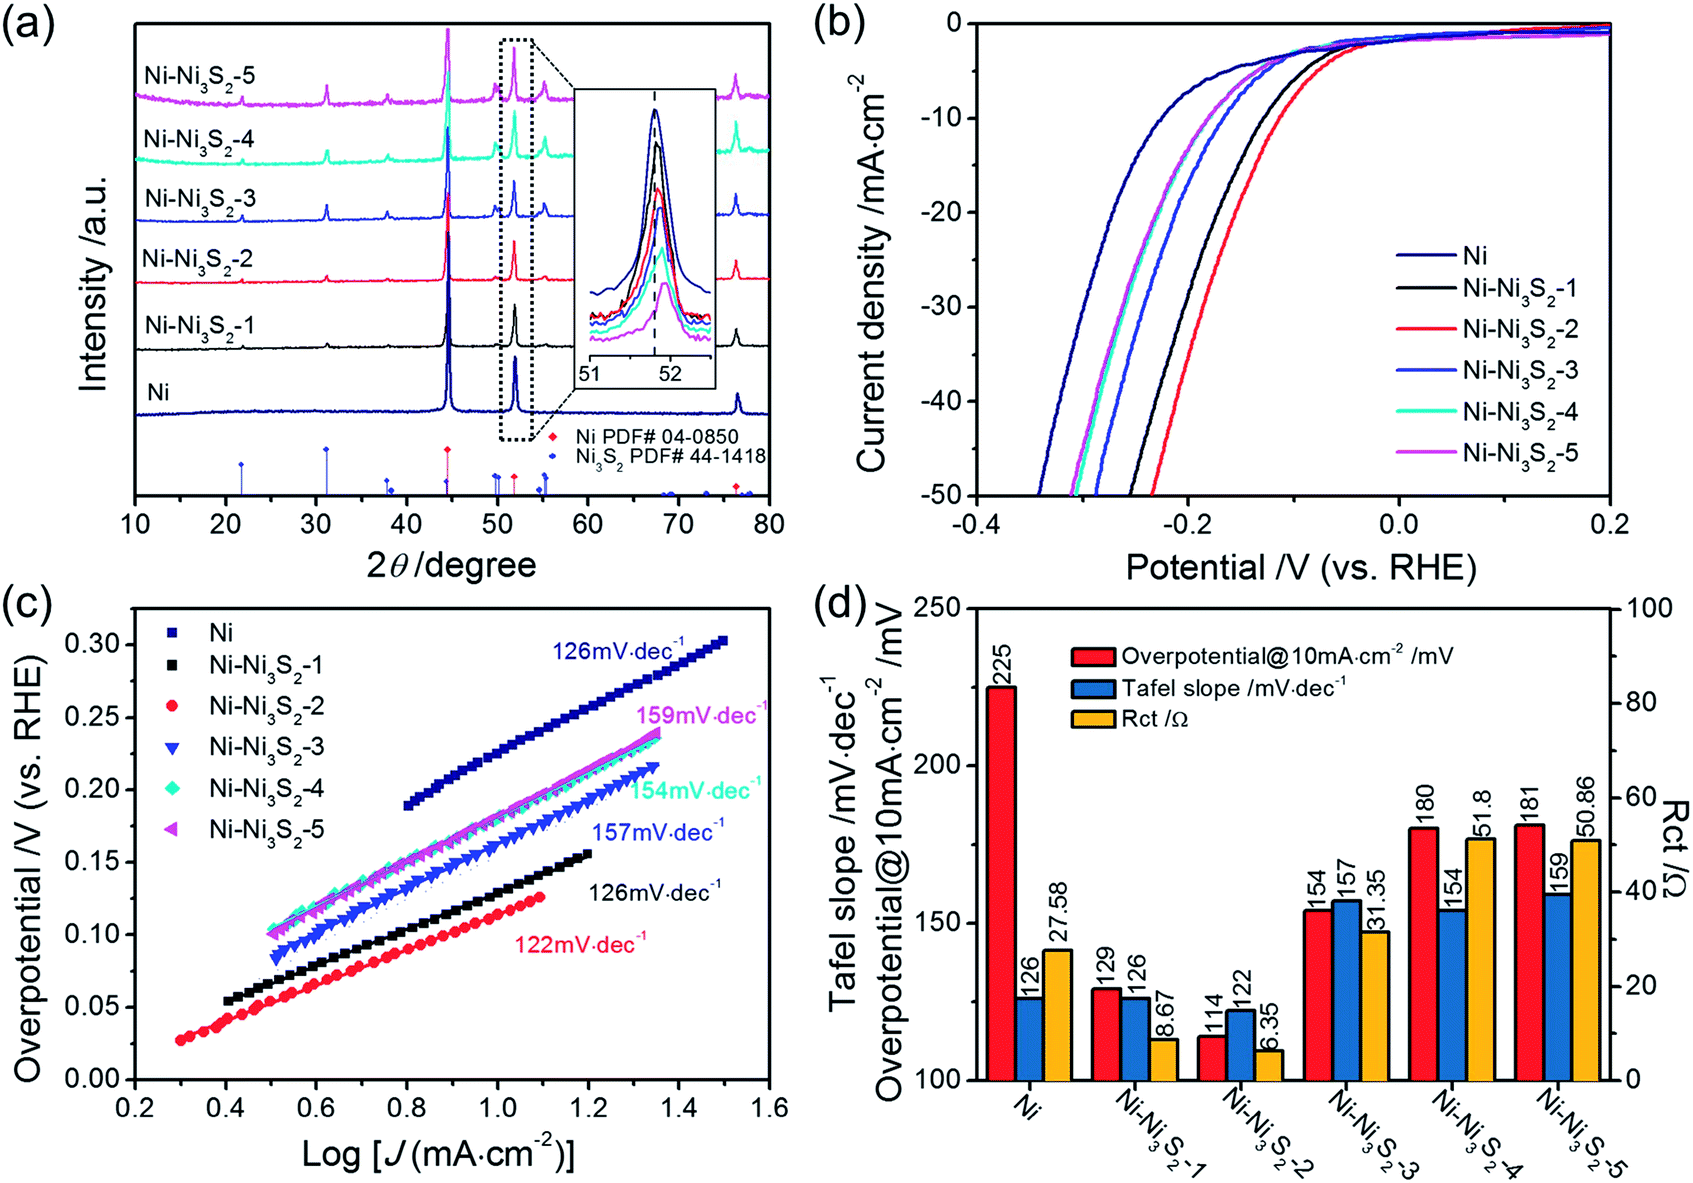 | ||
| Fig. 7 (a) The X-ray diffraction patterns (XRD). (b) The HER polarization curves in 1 M KOH with a scan rate of 10 mV s−1. (c) The corresponding Tafel plots. (d) The comparison of overpotential, Tafel slope, and charge transfer resistance of Ni and all of the Ni–Ni3S2 catalysts. | ||
To probe the catalytic activity of the Ni–Ni3S2 catalysts, we conducted HER performance tests for all of the samples in 1 M KOH solution in a three-electrode system. Fig. 7(b)–(d) show the LSV, Tafel slope, and charge transfer resistance of Ni and all of the Ni–Ni3S2 catalysts, and a comparison of their catalytic activities for HER. All of the Ni–Ni3S2 catalysts display higher catalytic activity for HER than the pure Ni catalyst. Among various Ni–Ni3S2 samples, the Ni–Ni3S2-2 catalyst exhibits the best catalytic activity, reaching a current density of 10 mA cm−2 at a low overpotential of 114 mV. It is worth mentioning that this value compares favorably to the behavior of most of the reported metal sulfide catalysts shown in Table S6.† The corresponding Tafel slope of the Ni–Ni3S2-2 catalyst is 122 mV dec−1, being similar to that of the Ni and Ni–Ni3S2-1 catalysts, and lower than those of the Ni–Ni3S2 catalysts with higher S content. The observed results are consistent with the theoretical calculation; that is, that Ni-based catalysts with a higher S content have weaker H-binding energy than those with a lower S content. Nyquist plots obtained by EIS measurements (Fig. S7†) indicate that the Ni–Ni3S2-2 catalyst has the lowest charge transfer resistance of all of the Ni–Ni3S2 catalysts. These results show that the HER catalytic activities of the Ni–Ni3S2 catalysts firstly increase with S content growth and then decrease gradually (Fig. 7(d)), and the optimal surface S:Ni atomic ratio of the Ni–Ni3S2 catalyst is about 28.9% as measured by XPS (Table S6†). Therefore, the results from the experimental work and the theoretical prediction are in good agreement.
4 Conclusions
In summary, we constructed a simple model and studied the influence of non-metallic elements in the second period and VIA group on the electronic structure and HER catalytic activity of Ni(100) by applying both DFT calculations and experiments. Our calculations show that the electronic structure, H-binding energy and HER activity of X/Ni(100) can be modulated effectively by changing the electronegativity and principle quantum number of X. χX and nX are the two important descriptors for effective evaluation and prediction of the catalytic activity of X/Ni(100). The investigation on ΔGH* indicates that the HER activity of X/Ni(100) for X in the VIA group is significantly higher than that for this in the second period. Among all of the discussed Xn/Ni(100) systems, the S3/Ni(100) system possesses the best HER activity at a relatively low X coverage (n = 3), and the Te4/Ni(100) exhibits the highest HER activity at a relatively high X coverage (n = 4). Our experiments demonstrate that the Ni–Ni3S2 catalyst with a surface S:Ni atomic ratio of 28.9% exhibits the best HER activity and lowest charge transfer resistance, which is highly consistent with the theoretical prediction. The regularity of the catalytic activity of X/Ni(100) with changing X offers a new possible strategy for designing cost-effective alternatives to Pt in HER and for the application of transition-metal compound catalysts.
Conflicts of interest
There are no conflicts to declare.Acknowledgements
This work was financially supported by the National Natural Science Foundation of China (Grant No.: 21376284, 21436003 and 21576032).Notes and references
- J. A. Turner, Science, 1999, 285, 687–689 CrossRef CAS PubMed.
- J. Wang, F. Xu, H. Jin, Y. Chen and Y. Wang, Adv. Mater., 2017, 29, 1605838–1605873 CrossRef PubMed.
- Z. Y. Yu, Y. Duan, M. R. Gao, C. C. Lang, Y. R. Zheng and S. H. Yu, Chem. Sci., 2017, 8, 968–973 RSC.
- J. Greeley, T. F. Jaramillo, J. Bonde, I. B. Chorkendorff and J. K. Norskov, Nat. Mater., 2006, 5, 909–913 CrossRef CAS PubMed.
- W. Sheng, H. A. Gasteiger and Y. Shao-Horn, J. Electron. Mater., 2010, 157, B1529–B1536 CAS.
- G.-F. Wei and Z.-P. Liu, Chem. Sci., 2015, 6, 1485–1490 RSC.
- C. Tang, N. Cheng, Z. Pu, W. Xing and X. Sun, Angew. Chem., 2015, 54, 9351–9355 CrossRef CAS PubMed.
- J. Xie, S. Li, X. Zhang, J. Zhang, R. Wang, H. Zhang, B. Pan and Y. Xie, Chem. Sci., 2014, 5, 4615–4620 RSC.
- C. Zhang, Y. Huang, Y. Yu, J. Zhang, S. Zhuo and B. Zhang, Chem. Sci., 2017, 8, 2769–2775 RSC.
- N. Bai, Q. Li, D. Mao, D. Li and H. Dong, ACS Appl. Mater. Interfaces, 2016, 8, 14521–14526 Search PubMed.
- D. Merki, S. Fierro, H. Vrubel and X. Hu, Chem. Sci., 2011, 2, 1262–1267 RSC.
- T. Liu, A. M. Asiri and X. Sun, Nanoscale, 2016, 8, 3911–3915 RSC.
- X. Tian, J. Luo, H. Nan, H. Zou, R. Chen, T. Shu, X. Li, Y. Li, H. Song, S. Liao and R. R. Adzic, J. Am. Chem. Soc., 2016, 138, 1575–1583 CrossRef CAS PubMed.
- T. Wang, X. Wang, Y. Liu, J. Zheng and X. Li, Nano Energy, 2016, 22, 111–119 CrossRef CAS.
- M. Gong, W. Zhou, M. C. Tsai, J. Zhou, M. Guan, M. C. Lin, B. Zhang, Y. Hu, D. Y. Wang, J. Yang, S. J. Pennycook, B. J. Hwang and H. Dai, Nat. Commun., 2014, 5, 4695–4701 CrossRef CAS PubMed.
- J. Wang, S. Mao, Z. Liu, Z. Wei, H. Wang, Y. Chen and Y. Wang, ACS Appl. Mater. Interfaces, 2017, 9, 7139–7147 CAS.
- H. Vrubel and X. Hu, Angew. Chem., 2012, 51, 12703–12706 CrossRef CAS PubMed.
- K. Xiong, L. Li, L. Zhang, W. Ding, L. Peng, Y. Wang, S. Chen, S. Tan and Z. Wei, J. Mater. Chem. A, 2015, 3, 1863–1867 CAS.
- S. Wang, J. Wang, M. Zhu, X. Bao, B. Xiao, D. Su, H. Li and Y. Wang, J. Am. Chem. Soc., 2015, 137, 15753–15759 CrossRef CAS PubMed.
- C. Wan, Y. N. Regmi and B. M. Leonard, Angew. Chem., 2014, 53, 6407–6410 CrossRef CAS PubMed.
- J. Zhang, T. Wang, D. Pohl, B. Rellinghaus, R. Dong, S. Liu, X. Zhuang and X. Feng, Angew. Chem., 2016, 55, 6702–6707 CrossRef CAS PubMed.
- Z. Xing, X. Yang, A. M. Asiri and X. Sun, ACS Appl. Mater. Interfaces, 2016, 8, 14521–14526 CAS.
- J. N. Jiang, Q. Tang, M. Sheng, B. You, D.-e. Jiang and Y. Sun, Catal. Sci. Technol., 2016, 6, 1077–1084 Search PubMed.
- S. Anantharaj, S. R. Ede, K. Sakthikumar, K. Karthick, S. Mishra and S. Kundu, ACS Catal., 2016, 6, 8069–8097 CrossRef CAS.
- K. Liu, F. Wang, K. Xu, T. A. Shifa, Z. Cheng, X. Zhan and J. He, Nanoscale, 2016, 8, 4699–4704 RSC.
- S. Meyer, A. V. Nikiforov, I. M. Petrushina, K. Köhler, E. Christensen, J. O. Jensen and N. J. Bjerrum, Int. J. Hydrogen Energy, 2015, 40, 2905–2911 CrossRef CAS.
- S. Wirth, F. Harnisch, M. Weinmann and U. Schröder, Appl. Catal., B, 2012, 126, 225–230 CrossRef CAS.
- L. Ma, L. R. L. Ting, V. Molinari, C. Giordano and B. S. Yeo, J. Mater. Chem. A, 2015, 3, 8361–8368 CAS.
- N. K. Chaudhari, H. Jin, B. Kim and K. Lee, Nanoscale, 2017, 9, 12231–12247 RSC.
- M. T. M. Koper, Nanoscale, 2011, 3, 2054 RSC.
- D. Yoon, B. Seo, J. Lee, K. S. Nam, B. Kim, S. Park, H. Baik, S. Hoon Joo and K. Lee, Energy Environ. Sci., 2016, 9, 850–856 CAS.
- Q. Z. Fan Yang, Y. Liu and S. Chen, J. Phys. Chem. C, 2011, 115, 19311–19319 Search PubMed.
- J. G. Chen, Chem. Rev., 1996, 96, 1477–1498 CrossRef CAS PubMed.
- Y. Liu, T. G. Kelly, J. G. Chen and W. E. Mustain, ACS Catal., 2013, 3, 1184–1194 CrossRef CAS PubMed.
- D. J. Ham and J. S. Lee, Energies, 2009, 2, 873–899 CrossRef CAS.
- W. F. Chen, J. T. Muckerman and E. Fujita, Chem. Commun., 2013, 49, 8896–8909 RSC.
- G. Kresse and J. Furthmuller, Phys. Lett. B, 1996, 54, 11169–11186 CAS.
- P. E. Blöchl, Phys. Lett. B, 1994, 50, 17953–17979 Search PubMed.
- J. P. Perdew, K. Burke and M. Ernzerhof, Phys. Rev. Lett., 1996, 77, 3865–3868 CrossRef CAS PubMed.
- J. E. Kirsch and S. Harris, Surf. Sci., 2003, 522, 125–142 CrossRef CAS.
- A. Mohsenzadeh, T. Richards and K. Bolton, Surf. Sci., 2016, 644, 53–63 CrossRef CAS.
- Q. Tang and D.-e. Jiang, ACS Catal., 2016, 6, 4953–4961 CrossRef CAS.
- J. K. Nørskov, T. Bligaard, A. Logadottir, J. R. Kitchin, J. G. Chen, S. Pandelov and U. Stimming, J. Electroanal. Chem., 2005, 152, J23 Search PubMed.
- Q. Zhang, Y. Liu and S. Chen, J. Electroanal. Chem., 2013, 688, 158–164 CrossRef CAS.
- W. Sheng, M. Myint, J. G. Chen and Y. Yan, Energy Environ. Sci., 2013, 6, 1509 CAS.
- R. Parsons, Trans. Faraday Soc., 1958, 54, 1053 RSC.
- P. Chen, T. Zhou, M. Zhang, Y. Tong, C. Zhong, N. Zhang, L. Zhang, C. Wu and Y. Xie, Adv. Mater., 2017, 1701584 CrossRef PubMed.
- L. Fang, W. Li, Y. Guan, Y. Feng, H. Zhang, S. Wang and Y. Wang, Adv. Funct. Mater., 2017, 27, 1701008 CrossRef.
- J. Zhuo, M. Cabán-Acevedo, H. Liang, L. Samad, Q. Ding, Y. Fu, M. Li and S. Jin, ACS Catal., 2015, 5, 6355–6361 CrossRef CAS.
- Y. An, B. Huang, Z. Wang, X. Long, Y. Qiu, J. Hu, D. Zhou, H. Lin and S. Yang, Dalton Trans., 2017, 46, 10700–10706 RSC.
Footnotes |
| † Electronic supplementary information (ESI) available: Experimental details, structure and morphology characterization, electrochemical characterizations, supplementary figures and data. See DOI: 10.1039/c7sc04851c |
| ‡ These authors contributed equally to this work. |
| This journal is © The Royal Society of Chemistry 2018 |