 Open Access Article
Creative Commons Attribution 3.0 Unported Licence
A luminescent aluminium salen complex allows for monitoring dynamic vesicle trafficking from the Golgi apparatus to lysosomes in living cells†
Juan
Tang
,
Hao-Yan
Yin
and
Jun-Long
Zhang
 *
*
Beijing National Laboratory for Molecular Sciences, State Key Laboratory of Rare Earth Materials Chemistry and Applications, College of Chemistry and Molecular Engineering, Peking University, Beijing 100871, P. R. China. E-mail: zhangjunlong@pku.edu.cn; Fax: +86-10-62767034
First published on 8th January 2018
Abstract
The Golgi apparatus is well-known as the center of vesicle trafficking whose malfunction might cause the breakdown of overall cellular architecture and ultimately cell death. The development of fluorescent probes to not only precisely stain the Golgi apparatus but also monitor dynamic vesicle trafficking is of great significance. While fluorescent proteins and fluorescent lipid analogs have been reported, they are sometime limited by either overexpression and toxicity or lack of high selectivity, respectively. We herein report a novel approach based on metal-induced coordination between the phosphate anions of phospholipids and the metal center of a luminescent Alsalen complex AlL, which can in situ track membrane vesicle trafficking from the Golgi apparatus to the lysosomes in living cells. This work opens a new avenue for designing luminescent metal probes based on the Lewis acidity of metal ions and allows the use of metal ions with different charge states, polarities, and reactivities within a similar structural scaffold to expand coordination chemistry for biological studies.
Introduction
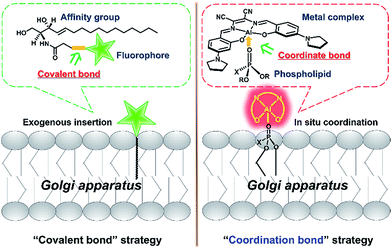
The Golgi apparatus is well-known as a “post office” in live cells, and collects and modifies proteins and lipids from the endoplasmic reticulum (ER) and then transports them to other organelles including lysosomes via vesicle trafficking.1 Malfunction in vesicle transport may cause the breakdown of overall cellular architecture and ultimately cell death.2,3 Thus, it is important to visualize the dynamic intracellular processes of the Golgi apparatus.To achieve this goal, fluorescent probes are required to not only precisely stain the Golgi apparatus, but also monitor the vesicle trafficking pathways. To meet these requirements, fluorescent proteins have been used as intrinsic Golgi apparatus trackers, which play a critical role and have offered a lot of useful information in understanding the biology of the Golgi apparatus.4 However, this approach sometimes suffers from low cell transfection efficiency and false positive signals that can alter the cell phenotype and/or lead to oxidative damage.4 To address these issues, the development of small molecular probes specific to the Golgi apparatus is a promising approach,5 but few of them are able to monitor the dynamics of vesicle trafficking processes. For example, fluorescent lipid analogs by attaching lipids such as ceramide to organic fluorophores like BODIPY, have been used to track dynamic processes from the Golgi apparatus to the cell membrane surface based on the well-known metabolism similar to its endogenous counterparts (Scheme 1, left).6–8 Vesicle trafficking from the Golgi apparatus to lysosomes is another canonical transportation process of vital importance.9,10 However, small molecular fluorescent probes have rarely been reported to track such processes. We herein report an alternative approach, which depends on the coordination ability of metal complexes to precisely in situ bind to endogenous natural lipid components in the Golgi apparatus and can monitor intracellular vesicle trafficking to the lysosomes. Therefore, without the need for operation outside the cells such as the covalent attachment of lipid molecules to fluorophores, these luminescent metal complexes represent a convenient and easy approach to monitor the Golgi apparatus-centered vesicle trafficking.
Luminescent metal complexes are an emerging class of fluorescence bioprobe due to their prominent photophysical properties such as long lifetimes and large Stokes shifts etc.11–28 Another bonus of such probes, in comparison with organic fluorescent bioprobes, is the ability to use different metal ions to modulate the charge state, polarity, redox property and even reactivity within a similar structural scaffold to fine-tune the biological behaviors and functions. Despite their potential, few probes have been reported to take full advantage of these properties.29 Recently, several lipophilic luminescent metal complexes with positive charge have been reported to stain the Golgi apparatus.30–32 These pioneering studies have inspired us to replace the divalent Zn2+ ion in a neutral, ER specific Znsalen complex (salen = N,N′-bis(2-hydroxy-4-(pyrrolidin-1-yl)benzyl-idene)-1,2-dicyano-1,2-ethenediamine) with trivalent Al3+, which rates a Golgi apparatus-targeting cationic Alsalen complex, AlL.33 Cellular internalization studies showed that AlL was internalized into the Golgi apparatus via membrane vesicle trafficking along microtubules. Importantly, since the Al3+ ion has strong oxophilicity, AlL exhibit a high affinity to negatively mono-charged phospholipids with a binding constant up to 1.2 × 10⁶ M−1, which allows it to anchor to the membrane structure of the Golgi apparatus. More importantly, cell imaging showed that AlL could be preferentially transported to the Golgi apparatus, the distributing hub of vesicle transportation, then underwent vesicle-mediated transportation along microtubules, and further trafficked into the lysosomes. Therefore, this work provides a new access to designing luminescent metal probes based on the Lewis acid reactivity of metals (Scheme 1, right) to monitor the dynamics of biological events in living cells.
Results and discussion
Synthesis and characterization
Starting from 2-hydroxy-4-(pyrrolidin-1-yl)benzaldehyde, the Znsalen complex (salen = N,N′-bis(2-hydroxy-4-(pyrrolidin-1-yl) benzylidene)-1,2-dicyano-1,2-ethene diamine) was obtained by condensation with 1 equiv. 2,3-diaminomaleonitrile and 1 equiv. Zn(OAc)2. AlL was obtained via a transmetalation reaction of Znsalen and AlCl3 (1 equiv.) in a yield of 56%. AlL was characterized by high-resolution electrospray ionization mass spectroscopy (HR-ESI-MS), 1H NMR spectrometry, UV-vis absorption and IR spectroscopy (ESI†). As shown in Fig. S1,†AlL in DMSO showed a typical band centered at 394 nm with a low-energy shoulder at 443 nm and another band centered at 595 nm. Upon excitation at 390 nm, AlL displayed intense red emission centered at 643 nm with a quantum yield of 0.49 in DMSO (Table S1†). Similar to its Znsalen counterpart,33AlL exhibited a two-photon absorption cross section (δ) of ca. 180 GM at 840 nm, referring to rhodamine B (Fig. S2†), suggesting its potential application as a two-photon fluorescence probe.Due to the strong Lewis acidity of Al3+ and labile chloride binding, AlL tends to undergo hydrolysis in aqueous media (Scheme 2),34–36 transforming it into neutral [Alsalen(OH)] and therefore generating the μ-oxo dimer (Alsalen)2O.37 We monitored the hydrolysis process of AlL in HEPES buffer (pH 6.0, 10 mM) by UV-vis absorption spectroscopy. We assumed that the replacement of a chloride anion by a water ligand and formation of the (Alsalen)2O dimer happened faster than deprotonation of the bound water ligand, and thus the whole hydrolysis process could be simplified to obey first-order kinetics. Therefore the absorption maximum decay at 588 nm was fitted to first-order kinetics, which follows the equation below.
| ln(A0/A) = kt | (1) |
Plotting the logarithm of A0/A versus time (t) gave a linear relationship from 500–7000 s (Fig. S3†). The fitted hydrolysis rate constant k is 2.8 × 10⁻⁵ s−1.
We then studied the effect of the pH of AlL in Britton–Robinson buffer which has an adjustable pH ranging from 2.0 to 12.0. As shown in Fig. S4,† increasing the pH from 4.0 to 10.0 in Britton–Robinson buffer led to broadened UV-vis absorption of AlL and a progressively decreased absorption intensity. The nonlinear regression of the absorption centered at 588 nm vs. pH affords a pKa value of 6.9 ± 0.1, which is confirmed by fluorescence titration. These results suggest that AlL acts mainly as a monomeric cationic complex in the Golgi apparatus (pH ∼ 6.5) or lysosomes (pH ∼ 5.0–6.0).38
Selective binding to phospholipids
Aluminum cations (Al3+), known as hard Lewis acids, have strong oxophilicity and play an important role in many reactions such as the ring-opening polymerization of epoxides,39 Diels–Alder reaction,40 and Michael addition.41 Coordination of a phosphate ligand to an Al3+ complex, to form a neutral aluminophosphate with an Al–O–P linkage, has been extensively applied in molecular sieves, ion exchange resins, and adsorption media.42–45 However, this property has been seldom explored in biological applications, despite the fact that phosphate species widely exist in biological systems such as phospholipids and nucleic acids etc. To date, there are only two reports on using Alsalen to detect double stranded polynucleotides (polyG)46 and G-type nerve agents47 in aqueous solution.To probe the binding abilities of AlL, we titrated AlL (20 μM) with several series of oxo-containing substrates including sulfates, sulfonates, carboxylates and phosphates in HEPES buffer (pH 6.0, 10 mM) at 25 °C and monitored the process by UV-vis absorption and fluorescence spectroscopy. The results are compiled in Table 1, Fig. 1 and Fig. S5–S8.† We found that only the oxo-containing lipids with one negative charge, such as sodium dodecyl sulphate (SDS), sodium dodecylbenzenesulfonate (SDBS), oleic acid (OA), phosphatidic acid (PA), phosphatidylglycerols (PG), 1,2-dioleoyl-sn-glycero-3-phosphoethanolamine-N-(carboxyfluorescein) (CF-PE) and 1-caproyl-2-[12-[(7-nitro-2-1,3-benzoxadiazol-4-yl) amino]dodecanoyl]-sn-glycero-3-phosphoethanolamine (NBD-PE), showed strong binding ability to AlL. Meanwhile, the neutral lipids (such as phosphatidylcholine (PC) and phosphatidylethanolamine (PE)), hydrophilic phosphates (such as mamose-6-phosphate (M6P) and ctDNA) and oxo-containing anions (such as H2PO4−, HCO3− and SO42−) did not. These titration experiments revealed that AlL can only bind to oxo-containing species that are mono-negatively charged and bear lipid structures. The above results also indicated that in cellular environment, the main lipophilic oxo-containing species, phospholipids, could be one of the most representative targets for AlL.
| Substrates | Lipophilicity | Net charge | Binding ability a,b |
|---|---|---|---|
| a ✓ strong binding; ✗ weak binding. b Binding ability was studied in HEPES buffer (pH 6.0, 10 mM) by UV-vis spectroscopy. | |||
| ctDNA | Hydrophilic | >2 | ✗ |
| CO32−, SO42− | Hydrophilic | −2 | ✗ |
| PA, PG, OA, SDBS, CF-PE, NBD-PE, SDS | Lipophilic | −1 | ✓ |
| M6P, H2PO4− | Hydrophilic | −1 | ✗ |
| PE, PC | Lipophilic | 0 | ✗ |
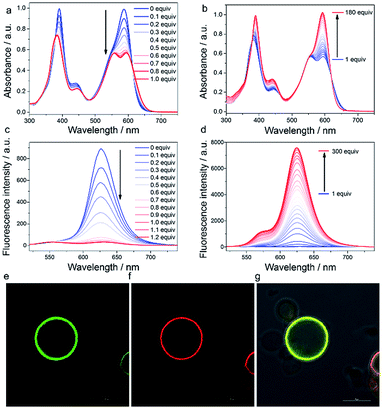
We thus focused our study on the titration of PG to AlL since it displayed the most remarkable spectral changes observed. When titrating PG (0–1.0 equivalent) to AlL, a progressive spectral broadening and intensity decrease were observed (Fig. 1a) in the UV-vis absorption spectrum, with isosbestic points at 462 and 623 nm. The fluorescence intensity of AlL also decreased dramatically to ca. 4% of the initial intensity after the addition of 1.0 equivalent of PG (Fig. 1c). The above spectral changes indicated the formation of aluminophosphate. The binding constant (Kb) and binding site value (n) were determined through isothermal titration calorimetry in HEPES at pH 6.0 (Fig. S9†). In the presence of PG or PC, the binding site values are all about 1 (n = 1.02 ± 0.01 or n = 0.92 ± 0.09, respectively). However, the Kb of PG to AlL was estimated to be (1.17 ± 0.12) × 106 M−1, which is two orders of magnitude higher that of electroneutral PC ((2.47 ± 0.58) × 104 M−1). Due to the poor solubility of PA and PE in aqueous solution, we didn’t determine their binding constant to AlL. In addition, HR-ESI-MS gave an m/z value of 1227.70296 ([M + H]+), indicating the formation of a 1![[thin space (1/6-em)]](https://www.rsc.org/images/entities/char_2009.gif) :
:![[thin space (1/6-em)]](https://www.rsc.org/images/entities/char_2009.gif) 1 adduct of AlL-PG (Fig. S10†). The kinetics of the binding of AlL to phospholipids was investigated by UV-vis spectroscopy in HEPES buffer (pH 6.0, 10 mM). Plotting the absorption at 390 nm or 588 nm versus the incubation time after adding PG to AlL showed that the binding of AlL to PG was a pseudo first-order reaction, with a binding rate constant of 0.8 s−1 at 25 °C (Fig. S11†).
1 adduct of AlL-PG (Fig. S10†). The kinetics of the binding of AlL to phospholipids was investigated by UV-vis spectroscopy in HEPES buffer (pH 6.0, 10 mM). Plotting the absorption at 390 nm or 588 nm versus the incubation time after adding PG to AlL showed that the binding of AlL to PG was a pseudo first-order reaction, with a binding rate constant of 0.8 s−1 at 25 °C (Fig. S11†).
Interestingly, when titrating PG to AlL from 1 to 180 equivalents, the UV-vis spectrum recovered to the initial spectral pattern, with a slight red shift from 587 to 593 nm (Fig. 1b). The fluorescence intensity also displayed an 11-fold increase (Fig. 1d). We tentatively ascribed this fluorescence increase to the fact that the formed AlL-PG adduct has dispersed into the lipid phase of the micelles formed by PG, since the concentration of PG is close to or larger than its critical micelle concentration (ca. 7 μM). To test the hypothesis that the fluorescence of AlL-PG increases significantly due to a microenvironmental change, we used CHCl3 to extract the in situ formed AlL-PG from its HEPES-buffered solution. As shown in Fig. S12,† compared to the fluorescence spectrum in HEPES buffer (pH 6.0, 10 mM), in the CHCl3 phase, the fluorescence intensity increased 100-fold. This sharp fluorescence enhancement thus demonstrated that AlL-PG exhibits more intense fluorescence in a non-polar environment than in a polar environment.
Thus, we proposed that the “tagging” of PG to AlL happens in two steps. In the first step, AlL binds to PG, which can be demonstrated by the large binding constant ((1.17 ± 0.12) × 106 M−1) and binding rate constant (0.8 s−1). In the second step, the formed AlL-PG adduct disperses into the lipid phase of the phospholipid bilayers and the fluorescence is turned on.
To demonstrate the capability of AlL to bind to membrane vesicles, we prepared an artificial fluorescent liposome by adding 1% fluorescent CF-PE (1,2-dioleoyl-sn-glycero-3-phosphoethanolamine-N-(carboxyfluorescein)) to a mixture of POPC/POPG/cholesterol (molar ratio 10![[thin space (1/6-em)]](https://www.rsc.org/images/entities/char_2009.gif) :
:![[thin space (1/6-em)]](https://www.rsc.org/images/entities/char_2009.gif) 1
1![[thin space (1/6-em)]](https://www.rsc.org/images/entities/char_2009.gif) :
:![[thin space (1/6-em)]](https://www.rsc.org/images/entities/char_2009.gif) 2.5; mass ratio 20 mg
2.5; mass ratio 20 mg![[thin space (1/6-em)]](https://www.rsc.org/images/entities/char_2009.gif) :
:![[thin space (1/6-em)]](https://www.rsc.org/images/entities/char_2009.gif) 2.2 mg
2.2 mg![[thin space (1/6-em)]](https://www.rsc.org/images/entities/char_2009.gif) :
:![[thin space (1/6-em)]](https://www.rsc.org/images/entities/char_2009.gif) 2 mg) to mimic a membrane vesicle, where the aqueous interior is surrounded by a hydrophobic phospholipid bilayer.48 As shown in Fig. 1f and g, images from a confocal laser scanning microscope (CLSM) indicated that the red fluorescence of AlL overlapped well with the green fluorescence of CF-PE and both of them distributed homogeneously in the phospholipid bilayers. As shown in Video S1,† upon addition of AlL (1 μM), red fluorescent liposome circles appeared in 60 seconds due to the free diffusion of AlL. These results clearly suggested that AlL could bind to the hydrophobic phospholipid bilayers and turn on the fluorescence.
2 mg) to mimic a membrane vesicle, where the aqueous interior is surrounded by a hydrophobic phospholipid bilayer.48 As shown in Fig. 1f and g, images from a confocal laser scanning microscope (CLSM) indicated that the red fluorescence of AlL overlapped well with the green fluorescence of CF-PE and both of them distributed homogeneously in the phospholipid bilayers. As shown in Video S1,† upon addition of AlL (1 μM), red fluorescent liposome circles appeared in 60 seconds due to the free diffusion of AlL. These results clearly suggested that AlL could bind to the hydrophobic phospholipid bilayers and turn on the fluorescence.
Pulse-chase imaging of subcellular localization of AlL
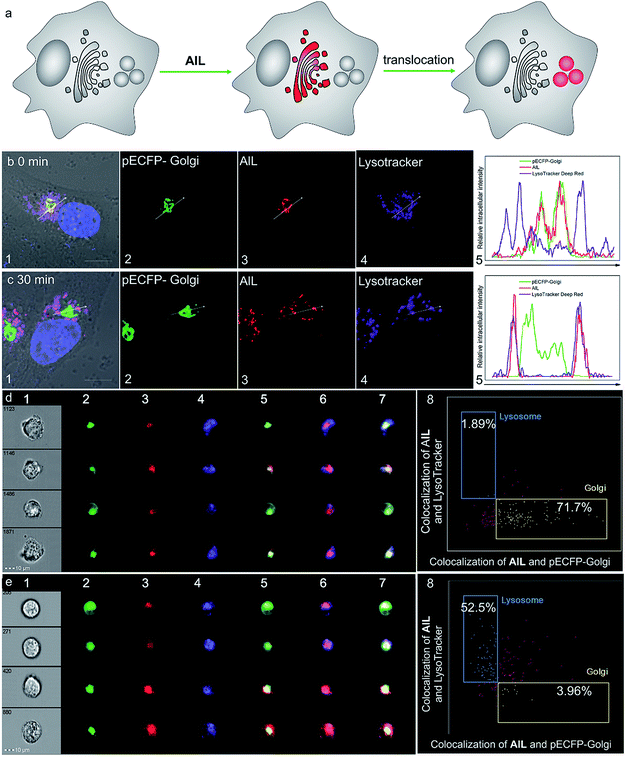
Prior to cell imaging, the cytotoxicity of AlL was assessed and low cytotoxicity was found, with up to 90% cell viability with an incubation of 2 μM complex for 48 hours (Fig. S13†). AlL was then used in conjunction with Hoechst 33342, pECFP-Golgi, and LysoTracker® Deep Red, which served as markers for the nucleus, Golgi apparatus and lysosomes, respectively, to determine the intracellular localization of AlL. HeLa cells were pulsed with 1 μM AlL for 5 min, washed, and cultured in fresh culture media again. As shown in Fig. 2a and b, AlL mainly distributed in the Golgi apparatus and gave merged bulk yellow fluorescence in the perinuclear region with a colocalization level of approximately 0.90 with pECFP-Golgi. In contrast, 30 min after the HeLa cells were pulsed with 1 μM AlL, AlL displayed merged punctuated pink fluorescence in the perinuclear region (Fig. 2a and c), with a colocalization level of approximately 0.90 with the lysosome tracker. The unbiased, large-scale statistical three-color image streams gave the same results as those from confocal imaging from the 50![[thin space (1/6-em)]](https://www.rsc.org/images/entities/char_2009.gif) 000 cell event files (Fig. 2d and e). To quantify the association between AlL and either the Golgi apparatus or lysosomes, we employed a “similarity” algorithm contained in the IDEAS software that measures the degree of spatial colocalization of signals from different spectral channels.49,50 As shown in Fig. 2d and e, the amount of cells in which AlL colocalized with pECFP-Golgi contained within the double-positive gate significantly decreased from 71.7 to 3.96%, whereas colocalization of AlL with lysosomes markedly increased from 1.89 to 52.5%. Thus, the above results of the colocalization of AlL with the Golgi apparatus and lysosomes indicates that AlL is initially localized to the Golgi apparatus and later transits to the lysosomes in living cells. In addition, since AlL has a large two-photon absorption cross section (ca. 180 GM) at 840 nm, it can also be applied to image the Golgi apparatus using a two-photon excited fluorescence microscope (Fig. S14†).
000 cell event files (Fig. 2d and e). To quantify the association between AlL and either the Golgi apparatus or lysosomes, we employed a “similarity” algorithm contained in the IDEAS software that measures the degree of spatial colocalization of signals from different spectral channels.49,50 As shown in Fig. 2d and e, the amount of cells in which AlL colocalized with pECFP-Golgi contained within the double-positive gate significantly decreased from 71.7 to 3.96%, whereas colocalization of AlL with lysosomes markedly increased from 1.89 to 52.5%. Thus, the above results of the colocalization of AlL with the Golgi apparatus and lysosomes indicates that AlL is initially localized to the Golgi apparatus and later transits to the lysosomes in living cells. In addition, since AlL has a large two-photon absorption cross section (ca. 180 GM) at 840 nm, it can also be applied to image the Golgi apparatus using a two-photon excited fluorescence microscope (Fig. S14†).
Dynamics of translocation of AlL
We then visualized the dynamics of translocation of AlL from the Golgi apparatus to the lysosomes. After accumulating AlL in the Golgi apparatus for 5 min, HeLa cells were washed and imaged continuously. Initially, pECFP-Golgi and AlL completely colocalized, as indicated by the nearly identical intensity profiles (Fig. 3a and e). During the next 24 min, pECFP-Golgi and AlL separated and the degree of overlap in the intensity profiles decreased (Fig. 3b–d and f–h). After 24 min, pECFP-Golgi and AlL separated completely and the intensity profiles showed negligible overlap (Fig. 3d and h). The relative kinetics of AlL translocation was evaluated by plotting the change of the colocalization coefficient in the region of interest (Fig. 3a, red circle) versus the incubation time. As shown in Fig. 3i, the colocalization level of AlL to the Golgi apparatus decreased from 0.801 to 0.006.From the time-series imaging, it only took 15 min for AlL to completely exit the Golgi apparatus and finally translocalize in the lysosomes. These dynamic intracellular transportation experiments clearly indicated that AlL could be used as an excellent tracker of vesicle trafficking from the Golgi apparatus to the lysosomes, which is one of the most important stages of lysosome biogenesis.51,52
Transportation mechanism of AlL to the Golgi apparatus
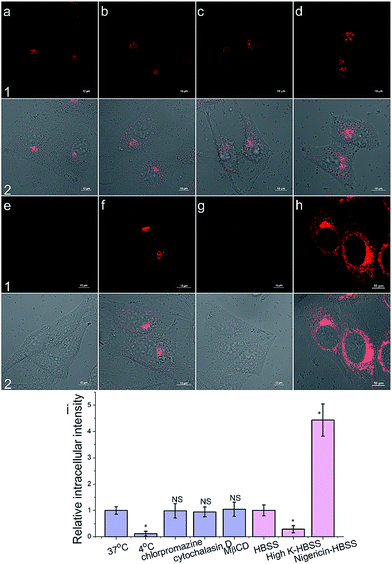
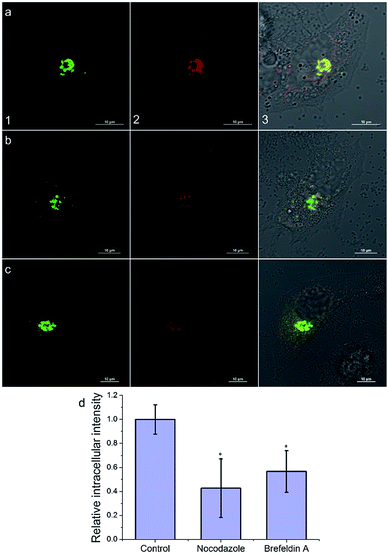
To get an insight into the Golgi-apparatus-targeting ability of AlL, we investigated its cellular internalization pathway using CLSM focusing on the following three aspects: temperature, endocytosis and membrane potential. As shown in Fig. 4, only 10% intracellular fluorescence intensity was observed for AlL at 4 °C compared to that at 37 °C, indicating that AlL was internalized into cells via a temperature-dependent process. In the presence of different endocytosis inhibitors, chlorpromazine (inhibitor of clathrin-mediated endocytosis), MβCD (inhibitor of caveolae-mediated endocytosis), and cytochalasin D (inhibitor of macropinocytosis), the intracellular fluorescence intensities are close to the fluorescence of the control group where no inhibitor was used (98%, 104% and 95%, respectively), indicating that the uptake of AlL was not blocked by these three endocytosis inhibitors. Thus, we proposed that the membrane transport pathway of AlL was not related to endocytosis. The relationship between the uptake level and membrane potential was studied by depolarization or hyperpolarization of the plasma membrane. HeLa cells treated with high K+-HBSS (depolarization) displayed a remarkable decrease in intracellular fluorescence by 70%, while the cells treated with nigericin (hyperpolarization) showed an intracellular fluorescence increase of about 300%. These results demonstrated that the internalization of AlL is membrane potential-dependent. To summarise, the transmembrane pathway of AlL is most likely through membrane potential-dependent passive diffusion.Then, we investigated the intracellular transport of AlL to the Golgi apparatus by treating cells with a microtubule-depolymerizing agent (nocodazole) and vesicle transport inhibitor (brefeldin A). As shown in Fig. 5, the intracellular fluorescence intensities of nocodazole- and brefeldin A-treated cells decreased to 43% and 56% of that of the control group, respectively. Therefore, we proposed that after AlL diffused into the cells, driven by the membrane potential, it was transported to the Golgi apparatus along microtubules through vesicle-trafficking.
Mechanism of subcellular translocation of AlL
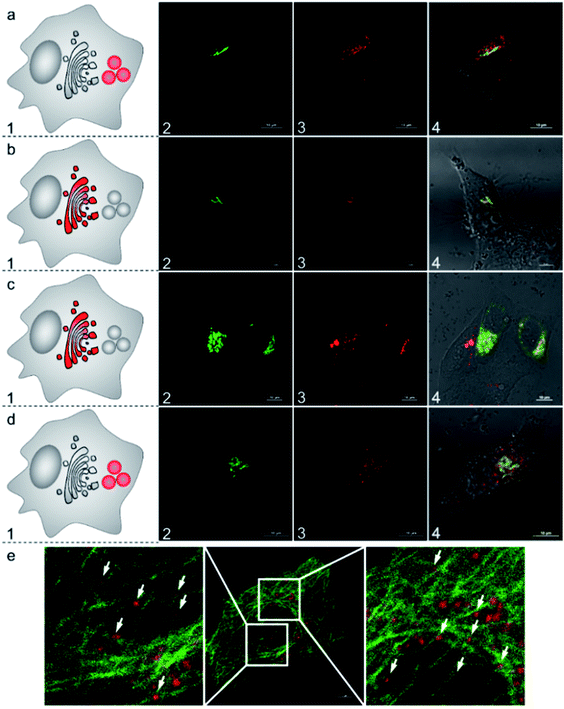
To further understand the subcellular translocation mechanism, we investigated the post-Golgi apparatus distribution of the AlL complex under different blocking conditions. As low temperature is known to drastically block vesicle trafficking pathways, we firstly examined the effect of temperature.53,54 HeLa cells were incubated with 1 μM AlL for 5 min at 37 °C, rinsed, and then cultured in fresh media at 19.5 °C for 30 min. As shown in Fig. 5b, the AlL red and pECFP-Golgi green fluorescence overlapped completely. As a control, we also set cells cultured with the AlL complex at 37 °C and no red fluorescence of AlL overlapped with the green fluorescence of pECFP-Golgi after 30 min (Fig. 6a). Second, we employed nocodazole and cytochalasin D, which destabilize the microtubules and actin network, respectively, to selectively block the translocation pathways.55 In 60 μM nocodazole-treated cells, the red fluorescence of AlL overlapped well with the green fluorescence of pECFP-Golgi, suggesting that subcellular transport of AlL was blocked with destabilized microtubules (Fig. 6c). When treated with cytochalasin D, however, the red AlL and the green pECFP-Golgi distributed separately, indicating no inhibition of AlL translocation through destabilization of the microfilaments (Fig. 6d).To verify the microtubule-dependent vesicle transport from the Golgi apparatus to the lysosomes, we tracked the fluorescence of AlL in HeLa cells expressing β-tubulin EGFP, a marker for microtubules. As shown in Fig. 6e, at 15 min after being pulsed with AlL for 5 min, the red fluorescence of AlL was largely in close proximity to the green fluorescence of the β-tubulin EGFP-stained microtubules, suggesting that AlL moves along the microtubule structures. Altogether, these results showed that subcellular translocalization of AlL required an appropriate temperature and the presence of intact microtubules, suggesting that AlL underwent a membrane vesicle transport process from the Golgi apparatus to the lysosomes.
Conclusions
Taken together, we report the first luminescent metal complex, AlL, which can target the Golgi apparatus and then track membrane vesicle trafficking from the Golgi apparatus to the lysosomes in living HeLa cells. AlL enters the cells through membrane potential-dependent passive diffusion and is transported to the Golgi apparatus via vesicle transportation along microtubules. Inside the territory of the Golgi apparatus, AlL has high potential for selective coordination to negatively mono-charged phospholipids, which together can further translocate to the lysosomes via membrane vesicle trafficking inside the cell. The intracellular pathway of AlL created a “fluorescent” vesicle flow from the Golgi apparatus to the lysosomes, which indicates the potential application of AlL as a fluorescent probe to help with the investigation of vesicle trafficking from the Golgi apparatus to the lysosomes. Such a strategy of employing a molecular fluorescent probe in vesicle trafficking would overcome the tedious workup of using fluorescent proteins. Ongoing work is aiming to pinpoint the exact phospholipid structures that bind to AlL in the cell environment and “carry” AlL to the designated organelles.More broadly, as a case study, this work demonstrated a novel approach to probe intracellular molecular events with the aid of metal-induced Lewis acid reactivity. The uniqueness of the metal centers is of great importance in metal complexes to expand their biological applications as bioprobes and metal drugs, yet is commonly overlooked and rarely explored. This work opens up a new access to allow the interdisciplinary integration of knowledge of coordination chemistry into biological probes.
Conflicts of interest
There are no conflicts to declare.Acknowledgements
We acknowledge financial support from the National Key Basic Research Support Foundation of China (Grant 2015CB856301) and the National Scientific Foundation of China (Grants 21571007, 21271013 and 21621061).Notes and references
- B. S. Glick and A. Nakano, Annu. Rev. Cell Dev. Biol., 2009, 25, 113–132 CrossRef CAS PubMed.
- J. S. Bonifacino and B. S. Glick, Cell, 2004, 116, 153–166 CrossRef CAS PubMed.
- G. J. Howell, Z. G. Holloway, C. Cobbold, A. P. Monaco and S. Ponnambalam, Int. Rev. Cytol., 2006, 252, 1–69 CrossRef CAS PubMed.
- A. Ettinger and T. Wittmann, Methods Cell Biol., 2014, 123, 77–94 Search PubMed.
- A. Boulaflous, C. Faso and F. Brandizzi, Traffic, 2008, 9, 1613–1617 CrossRef CAS PubMed.
- R. E. Pagano, O. C. Martin, H. C. Kang and R. P. Haugland, J. Cell Biol., 1991, 113, 1267–1279 CrossRef CAS PubMed.
- T. A. Vida and S. D. Emr, J. Cell Biol., 1995, 128, 779–792 CrossRef CAS PubMed.
- C. Meisslitzer-Ruppitsch, C. Röhrl, C. Ranftler, J. Neumüller, M. Vetterlein, A. Ellinger and M. Pavelka, Histochem. Cell Biol., 2011, 135, 159–171 CrossRef CAS PubMed.
- C. Mullins and J. S. Bonifacino, BioEssays, 2001, 23, 333–343 CrossRef CAS PubMed.
- P. Saftig and J. Klumperman, Nat. Rev. Mol. Cell Biol., 2009, 10, 623 CrossRef CAS PubMed.
- K. L. Haas and K. J. Franz, Chem. Rev., 2009, 109, 4921–4960 CrossRef CAS PubMed.
- Y. Gao, J. Wu, Y. Li, P. Sun, H. Zhou, J. Yang, S. Zhang, B. Jin and Y. Tian, J. Am. Chem. Soc., 2009, 131, 5208–5213 CrossRef CAS PubMed.
- V. Fernández-Moreira, F. L. Thorp-Greenwood and M. P. Coogan, Chem. Commun., 2010, 46, 186–202 RSC.
- K. K.-W. Lo, M.-W. Louie and K. Y. Zhang, Coord. Chem. Rev., 2010, 254, 2603–2622 CrossRef CAS.
- V. W.-W. Yam and K. M.-C. Wong, Chem. Commun., 2011, 47, 11579–11592 RSC.
- Q. Zhao, C. Huang and F. Li, Chem. Soc. Rev., 2011, 40, 2508 RSC.
- E. Baggaley, J. A. Weinstein and J. A. G. Williams, Coord. Chem. Rev., 2012, 256, 1762–1785 CrossRef CAS.
- D. L. Ma, H. Z. He, K. H. Leung, D. S. H. Chan and C. H. Leung, Angew. Chem., Int. Ed., 2013, 52, 7666–7682 CrossRef CAS PubMed.
- X. Wang, H. Chang, J. Xie, B. Zhao, B. Liu, S. Xu, W. Pei, N. Ren, L. Huang and W. Huang, Coord. Chem. Rev., 2014, 273, 201–212 CrossRef.
- D.-L. Ma, D. S.-H. Chan and C.-H. Leung, Acc. Chem. Res., 2014, 47, 3614–3631 CrossRef CAS PubMed.
- K. K.-W. Lo and S. P.-Y. Li, RSC Adv., 2014, 4, 10560–10585 RSC.
- M. C. Heffern, L. M. Matosziuk and T. J. Meade, Chem. Rev., 2014, 114, 4496–4539 CrossRef CAS PubMed.
- M. P. Coogan and V. Fernandez-Moreira, Chem. Commun., 2014, 50, 384–399 RSC.
- M. C.-L. Yeung and V. W.-W. Yam, in Luminescent and Photoactive Transition Metal Complexes as Biomolecular Probes and Cellular Reagents, ed. K. K.-W. Lo, Springer Berlin Heidelberg, Berlin, Heidelberg, 2015, pp. 109–129, DOI:10.1007/430_2014_172.
- K. K.-W. Lo, Luminescent and photoactive transition metal complexes as biomolecular probes and cellular reagents, Springer, 2015 Search PubMed.
- Y. Chen, R. Guan, C. Zhang, J. Huang, L. Ji and H. Chao, Coord. Chem. Rev., 2016, 310, 16–40 CrossRef CAS.
- K. K.-W. Lo, Inorganic and Organometallic Transition Metal Complexes with Biological Molecules and Living Cells, Academic Press, 2016 Search PubMed.
- H.-Y. Yin, J. Tang and J.-L. Zhang, Eur. J. Inorg. Chem., 2017, 44, 5085–5093 CrossRef.
- J. Tang, H. Y. Yin and J. L. Zhang, in Inorganic and Organometallic Transition Metal Complexes with Biological Molecules and Living Cells, ed. K. K.-W. Lo, Academic Press, 2017, ch. 1, pp. 1–53, DOI:10.1016/B978-0-12-803814-7.00001-0.
- K. K.-W. Lo, M.-W. Louie, K.-S. Sze and J. S.-Y. Lau, Inorg. Chem., 2008, 47, 602–611 CrossRef CAS PubMed.
- S. Clede, F. Lambert, C. Sandt, Z. Gueroui, M. Refregiers, M.-A. Plamont, P. Dumas, A. Vessieres and C. Policar, Chem. Commun., 2012, 48, 7729–7731 RSC.
- J.-X. Zhang, H. Li, C.-F. Chan, R. Lan, W.-L. Chan, G.-L. Law, W.-K. Wong and K.-L. Wong, Chem. Commun., 2012, 48, 9646–9648 RSC.
- Y. Hai, J.-J. Chen, P. Zhao, H. Lv, Y. Yu, P. Xu and J.-L. Zhang, Chem. Commun., 2011, 47, 2435–2437 RSC.
- D. A. Atwood, J. A. Jegier and D. Rutherford, J. Am. Chem. Soc., 1995, 117, 6779–6780 CrossRef CAS.
- D. A. Atwood, J. A. Jegier and D. Rutherford, Inorg. Chem., 1996, 35, 63–70 CrossRef CAS PubMed.
- D. A. Atwood, Coord. Chem. Rev., 1998, 176, 407–430 CrossRef CAS.
- D. A. Atwood and M. J. Harvey, Chem. Rev., 2001, 101, 37–52 CrossRef CAS PubMed.
- N. Demaurex, Physiology, 2002, 17, 1–5 CrossRef CAS.
- M.-A. Munoz-Hernandez, M. L. McKee, T. S. Keizer, B. C. Yearwood and D. A. Atwood, J. Chem. Soc., Dalton Trans., 2002, 410–414, 10.1039/b106003c.
- C. J. Magesh, S. V. Makesh and P. T. Perumal, Bioorg. Med. Chem. Lett., 2004, 14, 2035–2040 CrossRef CAS PubMed.
- M. S. Taylor and E. N. Jacobsen, J. Am. Chem. Soc., 2003, 125, 11204–11205 CrossRef CAS PubMed.
- M. E. Davis, C. Saldarriaga, C. Montes, J. Garces and C. Crowdert, Nature, 1988, 331, 698–699 CrossRef CAS.
- M. Hartmann and L. Kevan, Chem. Rev., 1999, 99, 635–664 CrossRef CAS PubMed.
- K. O. Kongshaug, H. Fjellvåg and K. P. Lillerud, Microporous Mesoporous Mater., 1999, 32, 17–28 CrossRef CAS.
- J. M. Thomas, R. Raja, G. Sankar and R. G. Bell, Acc. Chem. Res., 2001, 34, 191–200 CrossRef CAS PubMed.
- M. Cametti, I. Piantanida, M. Žinić, A. Dalla Cort, L. Mandolini, M. Marjanović and M. Kralj, J. Inorg. Biochem., 2007, 101, 1129–1132 CrossRef CAS PubMed.
- R. R. Butala, W. R. Creasy, R. A. Fry, M. L. McKee and D. A. Atwood, Chem. Commun., 2015, 51, 9269–9271 RSC.
- N. Maurer, D. B. Fenske and P. R. Cullis, Expert Opin. Biol. Ther., 2001, 1, 923–947 CrossRef CAS PubMed.
- P. V. Beum, M. A. Lindorfer, B. E. Hall, T. C. George, K. Frost, P. J. Morrissey and R. P. Taylor, J. Immunol. Methods, 2006, 317, 90–99 CrossRef CAS PubMed.
- H. R. Pugsley, Methods, 2017, 112, 147–156 CrossRef CAS PubMed.
- C. Mullins and J. S. Bonifacino, BioEssays, 2001, 23, 333–343 CrossRef CAS PubMed.
- P. Saftig and J. Klumperman, Nat. Rev. Mol. Cell Biol., 2009, 10, 623–635 CrossRef CAS PubMed.
- G. Griffiths, S. Pfeiffer, K. Simons and K. Matlin, J. Cell Sci., 1985, 101, 949–964 CrossRef CAS.
- E. Chanat and W. B. Huttner, J. Cell Sci., 1991, 115, 1505–1519 CrossRef CAS.
- F. Valderrama, T. Babià, I. Ayala, J. W. Kok, J. Renau-Piqueras and G. Egea, Eur. J. Cell Biol., 1998, 76, 9–17 CrossRef CAS PubMed.
Footnote |
| † Electronic supplementary information (ESI) available. See DOI: 10.1039/c7sc04498d |
| This journal is © The Royal Society of Chemistry 2018 |

