 Open Access Article
Correlation between phase separation and rheological behavior in bitumen/SBS/PE blends
Jianhui Xuab,
Tian Xia *c,
Li Zhaoc,
Bo Yina and
Mingbo Yang
 a
a
aCollege of Polymer Science and Engineering, Sichuan University, Chengdu 610065, China
bChongqing Zhixiang Paving Technology Engineering Co., Ltd., China Merchants Chongqing Communications Technology Research and Design Institute, Chongqing, 401336, China
cCollege of Material Science and Engineering, Chongqing University of Technology, Chongqing 400054, China. E-mail: xiatian@cqut.edu.cn
First published on 13th December 2018
Abstract
The polymer blend as a modifier for bitumen provides a new route to enhance its rheological properties directly related to service performance. The blending of crystalline polyethylene (PE) and thermoplastic elastomer styrene–butadiene–styrene (SBS) is a good choice for bitumen modification due to the possible combination of excellent rigidity and elasticity originating from PE and SBS, respectively. However, the immiscibility between SBS/PE and either of them with bitumen would make the phase structure evolution complicated. In this paper, the phase structure evolution of bitumen/SBS/PE during annealing is studied by in situ observation under optical microscopy. Two different composition ratios of SBS/PE are chosen to distinguish the role of crystalline polymer and elastomer in the phase structure and rheological behavior. It is found that the phase morphology evolution is mainly dependent on the compositional ratio of polymer blend, which accordingly influences the evolution of SBS-rich droplets. The immersion of SBS-rich droplets into bitumen would effectively enhance the rheological properties in terms of complex modulus and viscosity.
1 Introduction
Styrene–butadiene–styrene (SBS) is a classical polymer modifier for bituminous materials due to its significant enhancement of mechanical properties and rheological behavior.1–5 However, phase separation would inevitably exist in the SBS modified bitumen system, the original reason for which is the competition between SBS and asphaltenes to absorb the insufficient light components of bitumen.3 Various microscopic structures such as droplet-matrix, bicontinuous, and network structures can be induced by phase separation in bitumen/SBS systems.6 These phase structures are prone to be influenced by many factors such as S/B compositional ratio,7,8 SBS structure9 and so on. For example, when the SBS addition into bitumen increases from 4 wt% to 20 wt%, phase structure of SBS/bitumen blends at 130 °C exhibits normal minor droplet-major matrix, viscoelastic network of SBS-rich phase and inverted droplet-matrix structure.6As a thermoplastic elastomer, SBS can effectively improve the elasticity of bitumen, and accordingly enhances its resistance to rutting. Recently, we found that10 the addition of crystalline polymer (PE, PP or POM) into bitumen/SBS can synchronously enhance their stiffness (complex modulus G* increment) and elasticity (phase angle δ reduction), which is attributed to the coexistence of rigid crystalline polymer and elastomer. The highest G* value and the lowest δ value of bitumen/SBS/PE system make SBS/PE blend an ideal candidate for bitumen modification.11
Regarding the incompatibility and different densities between PE and bitumen, phase separation can also exist in bitumen/PE system12,13 and their phase morphology is closely associated with polymer concentration14 and structural parameters.15 Thus, the phase behavior of bitumen/SBS/PE blend would be very complex due to the immiscibility between either two components of them.10,16
Usually, the rheological property is directly related to the microscopic phase structure, including morphology type and size. For example, polymer blends with droplet-like structure display a shoulder in the storage modulus (G′) ∼ angular frequency (ω) curve at low frequencies, which is due to the shape relaxation of dispersed droplets.17–19 Bicontinuous structure corresponds to a power law feature denoted by G′ ∼ ωα at low frequencies,20,21 which relates to the different relaxation times of domains with different characteristic length scales.22
Even if phase morphology type keeps similar, G′ can also change with time during phase separation, determined by the competitive effects of concentration fluctuation, total interfacial area, and domain coarsening related deformability.23,24 In other words, the annealing treatment of bitumen/SBS/PE blend would play a main role in its rheological property, since different micro-structure can be formed by phase separation.
Previous studies on PMBs (polymer modified bitumens) usually focus on the frozen phase structure once modification finishes,3,25,26 but little attention is put on the in situ observation of phase structure evolution. Thus, the main objective of this work is to elucidate the relationship between phase structure and rheology in bitumen/SBS/PE blend. Understanding this relationship, we can broaden the bitumen modification means by the utilization of elastomer and crystalline polymer blend.
2 Materials and experiments
2.1 Materials and sample preparation
Bitumen (AH-70#) used in this paper was provided by SK company, Korea, and its fraction of saturates, aromatics, resins and asphaltenes in this bitumen were 5.9%, 59.8%, 19.1% and 15.2% respectively.6,27 The crystalline PE (high density of 1.047 g cm−3, DMDA-8008) was supplied by Dushanzi Petrochemical Corp with a melt flow index (MFI) of 7.3 g/10 min. The melting point of PE is about 133.5 °C measured by DSC. SBS (1301) with a linear structure containing 30 wt% styrene was supplied by Yueyang Baling Company, Sinopec.The bitumen/PE/SBS samples were prepared by melt blending method.11 The temperature for the polymer modified bitumen was kept as 180 °C in the whole process firstly, the base bitumen was heated in an iron container until fully flowed. Then, the SBS and PE resin were added together into the bitumen with low stirring speed of 500 rpm for 30 min. After that, a further mixing process was continued with high stirring speed of 5000 rpm for 2 h until the blend became essentially homogenous.
The common addition of SBS into bitumen is 4–6 wt% of bitumen.25,28 Moreover, the comparison between bitumen/SBS (100/4) and bitumen/SBS/PE (100/4/2) has studied in our previous study.10 For a further study on the effect of annealing process on the structure and rheological property of bitumen/SBS/PE blends, we controlled the total fraction of polymers is 6 wt% in this study, and the ratio of major polymer/minor polymer was kept as 4/2 by weight. The bitumen/SBS/PE (100/2/4) and bitumen/SBS/PE (100/4/2) blends were abbreviated as E-PMB and S-PMB respectively, whose first letter indicates the polymer (PE or SBS) with relatively higher faction. The samples after being annealed were labeled as (A).
2.2 Experiments
The in situ phase evolution was observed by optical microscope (BK-POL-TR, Optec, China) equipped with a CCD camera and a hot stage. Both transmission mode and polarization mode were employed to distinguish the crystalline phase and amorphous phase. The annealing temperature was kept at 180 °C for 60 min in order to observe the coarsening process of phase structures. The sample for phase structure observation was prepared by placing a heated drop on a glass slide, this process at high temperature was very short compared with annealing process, so the effect of heating on phase structure during sample preparation can be neglected.Rheological test was performed on a rheometer (AR 1500ex, TA Instruments, USA) with 25 mm parallel plate and 1 mm gap geometry. Two oscillating mode tests were employed as follows: (i) strain sweep test with a sweep strain range of 0.1–100% and frequency of 10 rad s−1 to ensure the linear viscoelastic region (LVE). (ii) Frequency sweep test with a sweep frequency range of 100–0.01 rad s−1 and a fixed strain determined by the first strain test. Steady state flow tests were also applied to measure viscous flow behavior with a wide shear rate range of 0.01–100 s−1. All the above tests were carried under 60 °C which was usually the highest service temperature for bituminous materials. It should be noted that, the rheological behavior was compared between original samples and samples after annealing at 180 °C for 60 min to study the effect of phase structure evolution on the property.
Differential scanning calorimeter (DSC, Q20, TA Instrument) was employed to study the thermal characteristics of bitumen/SBS/PE blends. About 4–10 mg samples were used for the DSC test to determine the melting points (Tm) and corresponding endotherm value (ΔHm) of crystalline PE-rich phase in the blends. Regarding the occurrence of phase separation at high temperature, only one ramp test was carried out for each sample from −50 °C to 200 °C with a heating rate of 15°C min−1. Samples were protected under a nitrogen flow of 50 ml min−1 during test.
3 Results and discussion
As Fig. 1(a) shows, there are lots of spherical droplets with a wide size distribution on the dark bitumen-rich phase in E-PMB. It is known that the amorphous matter would exhibit totally dark under optical microscopy with polarized mode. Different from the amorphous one, the crystalline structure should be bright and can be clearly seen under polarized optical microscopy. For example, the spherulite structure which usually forms in crystalline polymer can exhibit birefringent regions with characteristic extinction patterns possessing fourfold symmetry, like a cross extinction frame.29 From the polarized mode in Fig. 1(b), we can know that the visible droplets present the crystalline phase consisting of PE component. The vanished droplets compared by Fig. 1(a) and (b) should be SBS-rich phase and the black matrix should be bitumen-rich phase. It is noted that due to the influence of bitumen and SBS, the spherulites of PE is not perfect and does not appear integrated cross extinction frame.10 Under the transmission mode, the crystalline PE-rich droplets are brighter than the amorphous SBS-rich droplets.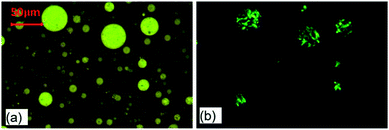 | ||
| Fig. 1 Phase morphology of E-PMB observed by optical microscopy at room temperature under (a) transmission mode and (b) polarized mode. | ||
The phase structure evolution of E-PMB blend at 180 °C can be seen in Fig. 2. After evolving for 10 min, the SBS-rich droplets and PE-rich droplets with small size bridge each other with alternating arrangement between two large PE-rich droplets, as indicated by the red dots region. At 22 min, the bridge is cut into two parts, and some small SBS-rich droplets stick to the interface of large PE-rich droplets around. The SBS-rich droplets keep shrinking to reduce the interfacial free energy, seems that the SBS-rich droplets are gradually absorbed by PE-rich droplets. Finally, the SBS-rich droplets can not exist independently but the PE-rich droplets with spherical shape still disperse on bitumen-rich matrix.
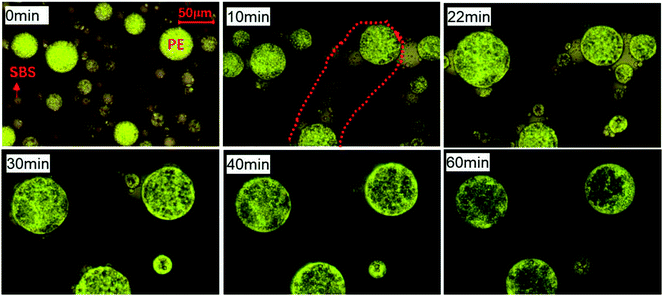 | ||
| Fig. 2 Phase structure evolution of E-PMB observed by optical microscopy under transmission mode at 180 °C. | ||
When the fraction of amorphous SBS is higher in the polymer blend bitumen, the phase structure evolution of E-PMB changes as revealed in Fig. 3. The average size of SBS-rich droplets is larger than that of PE-rich droplets at the initial stage, contrary to Fig. 2. The SBS-rich droplets and PE-rich droplets get close to each other on the bitumen-rich matrix under the heat flow. At 10 min, a bridging structure also emerges in this E-PMB blend by alternating arrangement of SBS-rich droplets and PE-rich droplets. It is noticed that after 10 min, PE-rich droplets keep spherical shape during annealing, even when they meet SBS-rich phase whose average size is much larger than theirs. After 20 min, the edge of large SBS-rich droplets is occupied by some smaller PE-rich droplets, exhibiting an incomplete and deformed spherical interface. Compared with the morphologies at 50 min and 60 min, the elongated SBS-rich tube retracts on the outside of its neighboring PE-rich droplets, and the SBS-rich domains far away from PE-rich droplets gradually immerse in the bitumen-rich matrix, shadowed by the “black” bitumen like disappearance.
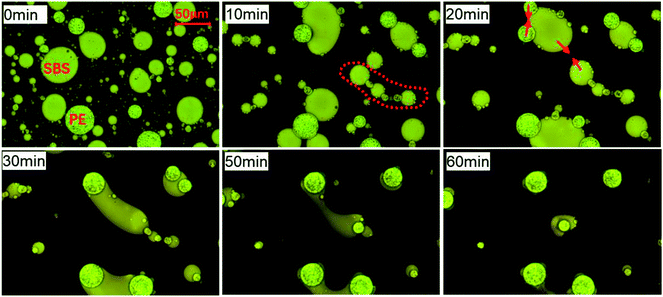 | ||
| Fig. 3 Phase structure evolution of S-PMB observed by optical microscopy under transmission mode at 180 °C. | ||
For a quantitative analysis of phase separation dynamics, the area fraction of droplets changing with time was studied. By the aid of ImageJ software, we can make a binary process for the phase morphology obtained at different annealing time, such as the pictures given in Fig. 2 and 3. Due to the color chromatic aberration, the SBS-rich and HDPE-rich droplets can be taken as one polymer-rich phase, while the bitumen-rich phase can be distinguished as the other one. Accordingly, the area fraction of total polymer-rich droplets (Adrop) can be measured by the software.
As shown in Fig. 4(a), the Adrop for E-PMB and S-PMB are 25% and 28%, respectively. It is noted that the initial area fraction is not in accordance with the total 6 wt% fraction of SBS and PE components in bitumen. Two possible reasons can be taken into consideration. On one hand, the droplets are measured by two-dimensional area instead of their actual three-dimensional volume. On the other hand, the droplets are composed of polymer-rich phase rather than pure polymer as discussed in the phase structure section. During annealing at 180 °C, the Adrop for both S-PMB and E-PMB decrease with time due to the coalescence of droplets. After annealing for 60 min, the Adrop for E-PMB and S-PMB are reduced to 20% and 7%, respectively. By a linear fitting, we can obtain the slope of droplets reduced rates as 0.09 and 0.34 for respective E-PMB and S-PMB. This comparison gives an indication of the much faster dynamics of S-PMB.
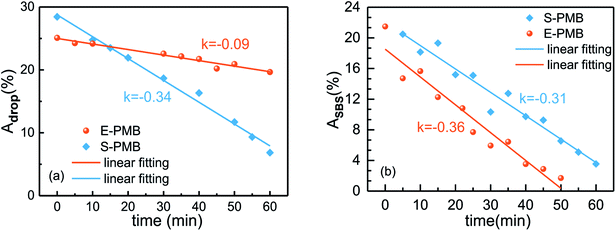 | ||
| Fig. 4 Area fraction variation of (a) polymer-rich droplets and (b) SBS-rich droplets with annealing time at 180 °C. | ||
Fig. 2 and 3 reveal that either in E-PMB or S-PMB, the PE-rich droplets always exist on bitumen-rich matrix during the whole annealing process. The main change in phase structure evolution is the decrease of SBS-rich droplets, hence the area fraction of SBS-rich droplets changing with time is also plotted in Fig. 4(b). The analysis process is similar to which Fig. 4(a) experiences, but before that the SBS-rich droplets should be labeled manually to distinguish from PE-rich droplets. It can be known that the area fraction of SBS-rich droplets decreases gradually for both E-PMB and S-PMB. The decrease slopes of SBS-rich droplets in E-PMB and S-PMB are 0.36 and 0.31, respectively. This result suggests the similar dynamics of SBS-rich phase evolution in the two modified bitumen.
Combined Fig. 4(a) with Fig. 4(b), it can be concluded that the dynamics of phase separation is mainly dependent on the SBS-rich droplets evolution. In the blend with higher fraction of crystalline PE polymer (E-PMB), the rather less SBS-rich phase can be almost totally “absorbed” by crystalline PE-rich droplets, leading to a continuous growth in size of PE-rich droplets. The positive contribution to the total droplets' area fraction provided by PE-rich phase can be almost offset by the negative contribution provided by SBS-rich phase. Thus, the total area fraction of polymer-rich droplets decreases with a relatively slow rate of 0.09. When the SBS is the major polymer in S-PMB, the excess SBS-rich domains can not be absorbed by the minor PE-rich phase but swollen by bitumen-rich matrix. Thus, there is a large difference in the area fraction of SBS-rich droplets with annealing time, which is dominant in the phase structure evolution. That is the reason for the similar slope values for S-PMB as given by Fig. 4(a) and (b).
For our studied bitumen/SBS/PE system, phase separation can only happen above the glass transition temperature (Tg) of PS blocks (∼100 °C) and the melting point of PE, under which the bituminous materials displays totally flow state. It means that, the phase separation temperature of bitumen/SBS/PE system is beyond the highest service temperature of bituminous materials (usually around 60 °C). In other words, the phase structure can be frozen at 60 °C during rheological measurement. Thus, the temperature condition for rheological measurement and phase separation evolution can not be the same.
As for the rheological measurement, the original rheological samples were prepared by casting the PMBs melt on a polytetrafluoroethylene (PTFE) substrate. The annealed samples were prepared by heating the original PMBs in the oven at 180 °C for 60 min, making phase separation happen under the same experimental condition with optical microscopy. Once the annealing accomplishes, the sample was immediately transferred to the environment at room temperature to freeze the phase structure. Thus, the annealed rheological samples should have the similar phase structure shown in Fig. 2 or Fig. 3 at 60 min.
The effect of annealing at 180 °C on the rheological behavior of polymer modified bitumen will be discussed. Since storage modulus G′ is sensitive to the response to the dynamics of phase structure relaxation and molecular chain motion,19,30 the G′ – strain result is given in Fig. 5 obtained by dynamic strain sweep test. It is seen that, the G′ is a little fluctuant when the strain is smaller than 1% either in base bitumen or polymer modified bitumen system, no matter the sample is annealed at 180 °C for 60 min or not. Thus, the fixed strain for the following dynamic frequency sweep test is chosen as 3% to ensure the linear viscoelastic behavior and the stability of data.
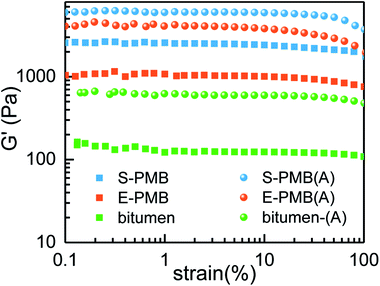 | ||
| Fig. 5 Strain dependence of storage modulus G′ for bitumen and PMBs measured at 60 °C, sample-(A) indicates the corresponding annealed sample. | ||
The dynamic frequency sweep results under small amplitude oscillation shear (SAOS) mode are displayed in Fig. 6. It can be seen from Fig. 6(a) that the G* increases after being annealed for all the studied systems. Both polymer modified bitumen has absolutely higher G*, almost one magnitude improvement in the whole frequency region compared with base bitumen, revealing the better ability to resist the permanent deformation or rutting2,31 by the addition of SBS/PE or by the annealing process at high temperature. Furthermore, the S-PMB always has the highest G* value among the three systems under the same condition.
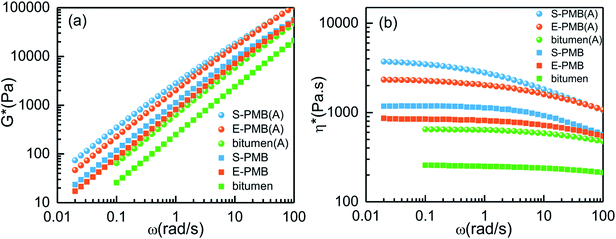 | ||
| Fig. 6 Variation of (a) complex modulus G* and (b) complex viscosity η* with frequency for different systems measured at 60 °C. | ||
Fig. 6(b) compares the variation of complex viscosity η* with frequency. Usually, viscosity reflects the ability of material to resist flow and deformation from outside. It is found that the η* value of S-PMB is the highest, consistent with that of G* value. The annealing treatment can enhance the η* value for all the systems. Prior to the annealing, the η* of S-PMB and E-PMB can keep stable when the frequency is no more than 1 rad s−1. However, the η* of S-PMB (A) and E-PMB (A) slightly decreases with frequency in the region of ω < 1 rad s−1 while it rapidly decreases in the region of ω > 1 rad s−1, showing an obvious shear thinning effect after annealing. In other words, the annealing treatment can result in much better ability to resist deformation but serious frequency dependence.
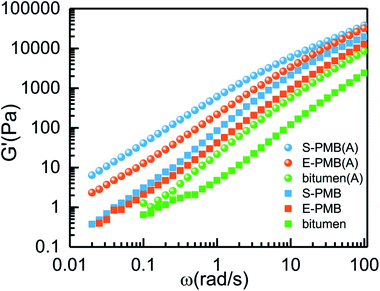
For the SAOS measurement, we put special attention on the change of G′ ∼ ω curves for the polymer modified bitumen due to the sensitivity of G′ to phase structure. As we know, the value and shape of G′ at low frequencies could reflect the slow relaxation processes of structures with large scale, vice versa.19 For S-PMB and E-PMB systems, the G′ variation at low frequencies is associated with relaxation of polymer-rich droplets owing to its slow dynamics compared with bitumen-rich matrix. There is an obvious G′ discrepancy between S-PMB and E-PMB in Fig. 7, and it is influenced by the annealing process. For the original PMB systems, the G′ discrepancy gets wider as frequency increases. To the contrary, the G′ discrepancy for the annealed PMB systems turns to be narrower as frequency increases.
By reminiscent of the morphology evolution depicted in Fig. 2 and 3, the amorphous SBS-rich phase and crystalline PE-rich phase coexist but with different droplet size at the initial stage in S-PMB and E-PMB. In the low frequency region (ω < 0.1 rad s−1), the almost overlapping of G′ ∼ ω for the original S-PMB and E-PMB should reflect the slow relaxation process of polymer-rich droplets rather than the independent SBS-rich droplets or PE-rich droplets. It means that both SBS-rich and PE-rich droplets can be regarded as one phase since polymer-rich droplet has slow relaxation at 60 °C, while the bitumen-rich matrix acts as the fast phase.
At the final stage of phase separation, there are almost only PE-rich droplets left on the matrix as shown in Fig. 2 and 3, and the average diameter of PE-rich droplets in E-PMB is over two times than that in S-PMB. This difference may contribute to the obvious G′ discrepancy at low frequency between annealed E-PMB (A) and S-PMB (A). It should be also noted that the G′ in low frequency region of ω < 0.1 rad s−1 is improved substantially after annealing treatment for S-PMB rather than E-PMB, revealing the prominent influence of annealing on the phase structure of S-PMB. This result is in accordance with the phase separation dynamics displayed in Fig. 4(a). The absolutely faster decrease of polymer-rich droplets' area fraction denotes a significant change on phase structure in S-PMB.
For the polymer modified bitumen, the G′ in high frequency region can reveal the relaxation process of fast bitumen-rich phase, in which light components has the faster dynamics.6 In this study, both SBS and semi-crystalline PE molecular chains can be swollen by the light components coming from bitumen. This competition between polymer and asphaltenes to absorb light components is the original reason for the phase separation in these blends. The large discrepancy of G′ at high frequencies for the original PMBs in Fig. 7 reflects the different dynamics of light components resulted from the different swollen ability between HDPE and SBS.
After annealing, the G′ in high frequency for E-PMB (A) and S-PMB (A) get closer to each other. The PE-rich droplets in Fig. 2 gets blacker as annealing time evolves, suggesting continuous involvement of some bituminous substance such as light components. Finally, the exchange of light components between polymer-rich phase bitumen-rich phase reaches equilibrium, and the dynamics of light components becomes comparative for E-PMB (A) and S-PMB (A), leading to the similar G′ values in high frequency region.
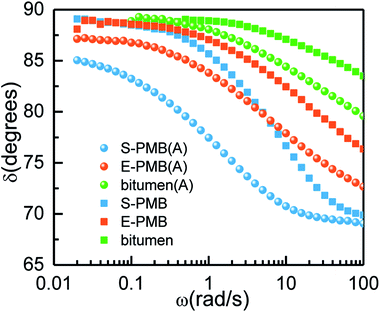
Phase angle δ directly relates to viscoelasticity of materials and it is also sensitive to chemical and physical structures of PMB.2 Based on Fig. 8(a), the phase angle δ of all the blends decreases with frequency but always above 45° in the whole frequency region, implying the viscous property of them and less viscous at high frequency at 60 °C. The annealing treatment makes a decrease of δ value, which gives an indication of elasticity modification. The δ value of S-PMB is the lowest due to more addition of SBS elastomer whose physical cross-linking of polystyrene blocks can enhance the elasticity of materials modified bitumen.
For a further revelation of annealing effect on the mechanical property of PMBs, steady state shear measurements are employed in a wide deformation region, in which polymer chains would experience remarkably conformational changes. Variation of viscosity with shear rate is displayed in Fig. 9.
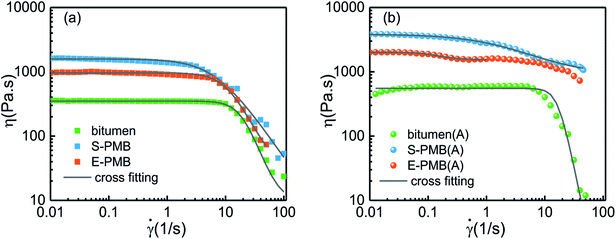 | ||
| Fig. 9 Viscous flow curves of (a) original bitumen and PMBs and (b) annealed bitumen and PMBs measured at 60 °C. | ||
From Fig. 9(a), the viscosity of three studied systems can keep almost constant in the low shear rate region, namely Newtonian viscosity. Once shear rate exceeds a critical value, the viscosity would decline sharply, showing a typical shear-thinning behavior. The base bitumen has the lowest viscosity while the S-PMB has the highest viscosity in the whole shear rate region. However, the shear rate at the onset of shear-thinning is the highest and the lowest for base bitumen and S-PMB, respectively. This steady sweep result is in accordance with the η* ∼ ω result obtained by SAOS measurement shown in Fig. 6(b). Compared Fig. 9(a) and (b), it is noticed that the shear-thinning effect is not evident in annealed PMBs as in original PMBs, but the viscosity in low shear rate region for the latter ones are much more stable.
For a quantitative discussion, we used Cross model32 to fit the steady flow curves which can be written as
 | (1) |
![[small gamma, Greek, dot above]](https://www.rsc.org/images/entities/i_char_e0a2.gif) c is the critical shear rate for the onset of shear-thinning region and s is a shear-thinning index. Fig. 9(a) and (b) indicate a good fitting of Cross model to the experimental η ∼
c is the critical shear rate for the onset of shear-thinning region and s is a shear-thinning index. Fig. 9(a) and (b) indicate a good fitting of Cross model to the experimental η ∼ ![[small gamma, Greek, dot above]](https://www.rsc.org/images/entities/i_char_e0a2.gif) c curve for the original systems. The annealed E-PMB (A) has two different stages of η reduction, implying its complex Newtonian behavior and pseudo plastic behavior. Thus, only data in the region of
c curve for the original systems. The annealed E-PMB (A) has two different stages of η reduction, implying its complex Newtonian behavior and pseudo plastic behavior. Thus, only data in the region of ![[small gamma, Greek, dot above]](https://www.rsc.org/images/entities/i_char_e0a2.gif) c < 1 s−1 is fitted for E-PMB (A). The fitted
c < 1 s−1 is fitted for E-PMB (A). The fitted ![[small gamma, Greek, dot above]](https://www.rsc.org/images/entities/i_char_e0a2.gif) c values by Cross model are 20.3 s−1, 13.8 s−1 and 7.2 s−1 for bitumen, E-PMB and S-PMB, respectively, which are reliable according to experimental data from Fig. 9(a). After annealing, these fitted values are reduced to 17.2 s−1, 0.1 s−1 and 2.2 s−1, respectively.
c values by Cross model are 20.3 s−1, 13.8 s−1 and 7.2 s−1 for bitumen, E-PMB and S-PMB, respectively, which are reliable according to experimental data from Fig. 9(a). After annealing, these fitted values are reduced to 17.2 s−1, 0.1 s−1 and 2.2 s−1, respectively.
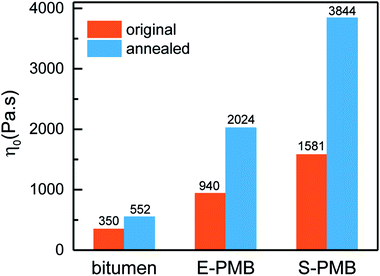
The Cross fitting η0 difference induced by annealing is displayed in Fig. 10. It is obvious that the viscosity of all the samples is enhanced by annealing. To explore the effect of phase separation on the viscosity of PMBs, the amplitude of increased viscosity (Iv) is introduced as
 | (2) |
The main reason for this difference is the evolution of SBS-rich phase during phase separation. Based on the Fig. 2 and 3, the major SBS-rich phase is coalesced by PE-rich droplets in E-PMB while it would be swollen by bitumen-rich phase in S-PMB. For the latter situation, the dynamic relaxation of bitumen-matrix should be significantly slowed down due to the restrain of molecular motion by SBS chains. Regarding the majority of bitumen in these PMBs, the coalescence of SBS-rich phase into bitumen-rich matrix during phase separation would make S-PMB much stiffer, and consequently leading to an obvious improvement of viscosity.
Until now, we know that there must be an existence of materials diffusion during annealing process. To understand how it proceeds, DSC measurement was employed for the analysis of melting process of PE-rich phase. The heating curves for blends are displayed in Fig. 11. It should be noted that three replicates were performed for each DSC sweep test. In the case of good repeatability, the average of the three replicates was used for analysis. The fluctuation below 100 °C is due to the multiscale structure including the molecular structure of components especially for the complex mixture of bitumen, and the multi-phase structure for the ternary bitumen/SBS/PE blends.
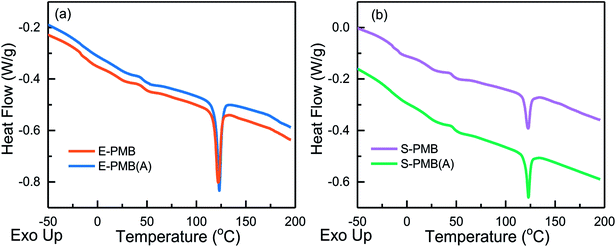 | ||
| Fig. 11 DSC curves of heating process from −50 °C to 100 °C for bitumen/SBS/PE blends before and after annealing. | ||
Here we focus on the obvious endothermic peak, which is corresponding to the melting process of PE-rich phase. For a strict comparison, the melting peak analysis for each heating curve is limited between 100 °C and 150 °C to quantify the Tm and endotherm value. As displayed in Table 1, the Tm of PE-rich phase for the original E-PMB, S-PMB are 122.2 °C and 122.5 °C, respectively. After annealing treatment, both Tm of PE-rich phase raise to the same value of 123.0 °C. It is noted again that at least three samples were chosen for each DSC test, and any couple of Tm comparison induced by annealing reveals a slight increase trend, so this difference should not be regarded as an experimental error.
| Samples | PE | E-PMB | E-PMB (A) | S-PMB | S-PMB (A) |
|---|---|---|---|---|---|
| Tm (°C) | 133.5 | 122.2 | 123.0 | 122.5 | 123.0 |
| ΔHm (J g−1) | 185.1 | 6.6 | 7.2 | 2.8 | 3.6 |
| fc (%) | 100.0 | 3.6 | 3.9 | 1.5 | 2.0 |
According to our previous study,10 the melting point Tm of single PE component is 133.5 °C, which is ∼10 °C above Tm of PE-rich phase. This result indicates the better flexibility of semi-crystalline PE molecular chains in the modified bitumen, since they can be partially swollen by some light aromatic components of the bitumen.12
Special attention is put on the effect of annealing on the crystalline behavior of PE. The improvement of Tm suggests that the annealing treatment can make crystalline structure of PE perfect. Combined with morphology evolution shown in Fig. 2 and 3, it can be speculated that the chain mobility of PE gets suppressed by phase separation, during which PE-rich droplets coalesce with SBS-rich droplets in E-PMB and S-PMB.
For the original E-PMB and S-PMB, the ΔHm values around the melting peak are 6.6 J g−1 and 2.8 J g−1, respectively. These two values increase to 7.2 J g−1 and 3.6 J g−1 respectively after being annealed, implying an increase of crystallinity (fc). Taken the crystallinity of pure PE as 100%, the fc of E-PMB and S-PMB can be calculated as respective 3.6% and 1.5%, which are lower than the weight fraction (fw) of PE in their own blends as 3.8% and 1.9%, respectively. The fc of E-PMB (A) and S-PMB (A) improve to 3.9% and 2.0%, very close to but slightly higher than corresponding fw values. This comparison gives two indications. For one hand, the partial loss of light components in bitumen makes PE fraction getting higher in the blends during phase separation at 180 °C. For another hand, the diffusion of SBS into PE-rich droplets and the competition between PE and asphaltene to absorb light components lead to a participation of other molecular chains into the crystalline process of PE.
4 Conclusions
Based on the above discussion, the bitumen/SBS/PE blends with two different SBS/PE ratios experience various phase structure evolution. Both of them display a typical structure of polymer-rich droplet dispersed on the bitumen-rich. For each modified bitumen, PE-rich droplets always exist on bitumen-rich matrix during the whole annealing process. The dynamics of phase separation is mainly determined by the decrease of SBS-rich droplets, relating to compositional ratio of polymer blend. The rheological property of S-PMB is better than E-PMB at 60 °C, such as high complex modulus and viscosity, low phase angle. Moreover, the effect of annealing on the rheological property is significant in S-PMB rather than in E-PMB, revealing that the immersion of SBS in bitumen-matrix rather than in PE-rich droplets can facilitate the viscosity improvement of PMB, and accordingly enhance the ability of PMBs to resist flow and deformation significantly. DSC confirms the substance exchange among SBS, PE and bitumen during phase separation, and the annealing treatment can improve the crystallinity and make crystalline structure of PE more perfect.Conflicts of interest
The authors declared that they have no conflicts of interest to this work.Acknowledgements
We are grateful to the financial support from the National Natural Science Foundation of China (51403026).References
- M. Liang, X. Xin, W. Fan, H. Luo, X. Wang and B. Xing, Investigation of the rheological properties and storage stability of CR/SBS modified asphalt, Constr. Build. Mater., 2015, 74, 235–240 CrossRef.
- S. S. Galooyak, B. Dabir, A. E. Nazarbeygi and A. Moeini, Rheological properties and storage stability of bitumen/SBS/montmorillonite composites, Constr. Build. Mater., 2010, 24(3), 300–307 CrossRef.
- G. D. Airey, Rheological properties of styrene butadiene styrene polymer modified road bitumens, Fuel, 2003, 82(14), 1709–1719 CrossRef CAS.
- A. S. Karakas, N. Kuloglu, B. V. Kok and M. Yilmaz, The evaluation of the field performance of the neat and SBS modified hot mixture asphalt, Constr. Build. Mater., 2015, 98, 678–694 CrossRef.
- M. Liang, X. Xin, W. Fan, H. Wang, S. Ren and J. Shi, Effects of polymerized sulfur on rheological properties, morphology and stability of SBS modified asphalt, Constr. Build. Mater., 2017, 150, 860–871 CrossRef CAS.
- T. Xia, J. Xu, T. Huang, J. He, Y. Zhang, J. Guo and Y. Li, Viscoelastic phase behavior in SBS modified bitumen studied by morphology evolution and viscoelasticity change, Constr. Build. Mater., 2016, 105, 589–594 CrossRef CAS.
- J. Xu, T. Xia, Y. Li, M. Wang, Z. Hao and J. Dai, Effect of S/B block proportion on the phase behavior and rheology of SBS modified bitumen, Pet. Sci. Technol., 2016, 34(23), 1867–1871 CrossRef CAS.
- M. Liang, P. Liang, W. Fan, C. Qian, X. Xin, J. Shi and G. Nan, Thermo-rheological behavior and compatibility of modified asphalt with various styrene-butadiene structures in SBS copolymers, Mater. Des., 2015, 88, 177–185 CrossRef CAS.
- P. Lin, W. Huang, Y. Li, N. Tang and F. Xiao, Investigation of influence factors on low temperature properties of SBS modified asphalt, Constr. Build. Mater., 2017, 154, 609–622 CrossRef CAS.
- T. Xia, L. Zhou, J. Xu, Y. Qin, W. Chen and J. Dai, Rheology and thermal stability of polymer modified bitumen with coexistence of amorphous phase and crystalline phase, Constr. Build. Mater., 2018, 178, 272–279 CrossRef CAS.
- T. Xia, Y. Qin, J. Xu, L. Zhou, W. Chen and J. Dai, Viscoelastic phase separation and crystalline-to-amorphous phase transition in bitumen/SBS/PE blends, Polymer, 2018, 155, 129–135 CrossRef CAS.
- A. Perezlepe, F. J. Martinezboza, P. Attane and C. Gallegos, Destabilization mechanism of polyethylene-modified bitumen, J. Appl. Polym. Sci., 2006, 100(1), 260–267 CrossRef CAS.
- A. H. Fawcett, T. Mcnally, G. M. Mcnally, F. Andrews and J. Clarke, Blends of Bitumen with Polyethylenes, Polymer, 1999, 40(23), 6337–6349 CrossRef CAS.
- A. Perezlepe, F. J. Martinezboza and C. Gallegos, Influence of polymer concentration on the microstructure and rheological properties of high-density polyethylene (HDPE)-modified bitumen, Energy Fuels, 2005, 19(3), 1148–1152 CrossRef CAS.
- A. A. Yousefi, Polyethylene dispersions in bitumen: the effects of the polymer structural parameters, J. Appl. Polym. Sci., 2003, 90(12), 3183–3190 CrossRef CAS.
- A. Perezlepe, F. J. Martinezboza, C. Gallegos, O. Gonzalez, M. E. Munoz and A. Santamaria, Influence of the processing conditions on the rheological behaviour of polymer-modified bitumen, Fuel, 2003, 82(11), 1339–1348 CrossRef CAS.
- D. Wu, Y. Zhang, M. Zhang and W. Zhou, Phase behavior and its viscoelastic response of polylactide/poly (ε-caprolactone) blend, Eur. Polym. J., 2008, 44(7), 2171–2183 CrossRef CAS.
- M. Bousmina and R. Muller, Linear viscoelasticity in the melt of impact PMMA. Influence of concentration and aggregation of dispersed rubber particles, J. Rheol., 1993, 37, 663 CrossRef CAS.
- T. Xia, Y. Huang, X. Jiang, Y. Lv, Q. Yang and G. Li, The Molecular Mechanism of the Morphology Change in PS/PVME/Silica Blends Based on Rheology, Macromolecules, 2013, 46(20), 8323–8333 CrossRef CAS.
- I. Polios, M. Soliman, C. Lee, S. Gido, K. Schmidt-Rohr and H. Winter, Late stages of phase separation in a binary polymer blend studied by rheology, optical and electron microscopy, and solid state NMR, Macromolecules, 1997, 30(15), 4470–4480 CrossRef CAS.
- R. Li, W. Yu and C. Zhou, Phase behavior and its viscoelastic responses of poly (methyl methacrylate) and poly (styrene-co-maleic anhydride) blend systems, Polym. Bull., 2006, 56(4), 455–466 CrossRef CAS.
- C. Weis, J. Leukel, K. Borkenstein, D. Maier, W. Gronski, C. Friedrich and J. Honerkamp, Morphological and rheological detection of the phase inversion of PMMA/PS polymer blends, Polym. Bull., 1998, 40(2), 235–241 CrossRef.
- J. Kim and H. Son, The rheological properties of polystyrene/poly (vinyl methyl ether) blend near the critical region and in the homogenous region, Polymer, 1999, 40(24), 6789–6801 CrossRef CAS.
- Y. Niu and Z. Wang, Rheologically determined phase diagram and dynamically investigated phase separation kinetics of polyolefin blends, Macromolecules, 2006, 39(12), 4175–4183 CrossRef CAS.
- H. Fu, L. Xie, D. Dou, L. Li, M. Yu and S. Yao, Storage stability and compatibility of asphalt binder modified by SBS graft copolymer, Constr. Build. Mater., 2007, 21, 1528–1533 CrossRef.
- S. Wu, L. Pang, L. Mo, Y. Chen and G. Zhu, Influence of aging on the evolution of structure, morphology and rheology of base and SBS modified bitumen, Constr. Build. Mater., 2009, 23(2), 1005–1010 CrossRef.
- Z. Feng, J. Yu and D. Kuang, The physical properties and photostability of bitumen with different ultraviolet absorbers, Pet. Sci. Technol., 2013, 31(2), 113–120 CrossRef CAS.
- T. Xia, L. Zhou, S. Lan and X. Huang, SBS modified bitumen in the presence of hydrophilic or hydrophobic silica nanoparticles, Constr. Build. Mater., 2017, 153, 957–964 CrossRef CAS.
- A. Keller, The spherulitic structure of crystalline polymers. Part I. Investigations with the polarizing microscope, J. Polym. Sci., 1955, 17(84), 291–308 CrossRef CAS.
- S. Huang, L. Bai, M. Trifkovic, X. Cheng and C. W. Macosko, Controlling the Morphology of Immiscible Cocontinuous Polymer Blends via Silica Nanoparticles Jammed at the Interface, Macromolecules, 2016, 49(10), 3911–3918 CrossRef CAS.
- F. Martínez-Boza, P. Partal, F. J. Navarro and C. Gallegos, Rheology and microstructure of asphalt binders, Rheol. Acta, 2001, 40(2), 135–141 CrossRef.
- J. Tian, W. Yu and C. Zhou, The preparation and rheology characterization of long chain branching polypropylene, Polymer, 2006, 47(23), 7962–7969 CrossRef CAS.
| This journal is © The Royal Society of Chemistry 2018 |

