
 Open Access Article
 This Open Access Article is licensed under a Creative Commons Attribution-Non Commercial 3.0 Unported Licence
The solvent-driven formation of multi-morphological Ag–CeO2 plasmonic photocatalysts with enhanced visible-light photocatalytic reduction of CO2
Wei Cai *a,
Yunpeng Shia,
Yunxia Zhaoa,
Mindong Chena,
Qin Zhongb and
Yunfei Bua
*a,
Yunpeng Shia,
Yunxia Zhaoa,
Mindong Chena,
Qin Zhongb and
Yunfei Bua
aJiangsu Collaborative Innovation Center of Atmospheric Environment and Equipment Technology (CICAEET), Jiangsu Key Laboratory of Atmospheric Environment Monitoring and Pollution Control, School of Environmental Science and Engineering, Nanjing University of Information Science & Technology, Nanjing, 210044, P. R. China. E-mail: caiwei_19880105@163.com
bSchool of Chemical and Engineering, Nanjing University of Science and Technology, Nanjing, 210094, P. R. China
First published on 11th December 2018
Abstract
Ag–CeO2 plasmonic photocatalysts with multiple morphologies were synthesized via a simple solvent-driven method. The phase compositions, morphologies and optical properties of the samples were systematically investigated. A combination of noble metal Ag and semiconductor CeO2 in certain solvents (such as methanol and ethylene glycol) enhanced surface plasmon resonance (SPR), which was attributed to the good dispersion of Ag particles on CeO2 and high Ag0 ratios on the surface. The enhanced SPR effect boosted absorption of incident light and facilitated charge carrier separation and transport efficiency caused by the formation of Schottky barriers, thus promoting VLPCR performance. The optimum ACG sample (ethylene glycol was adopted as the solvent) exhibited the maximum VLPCR activity, achieving a CH4 yield of 100 μmol and a CH3OH yield of 35 μmol per gram of catalyst per hour during 6 h visible-light irradiation.
1. Introduction
Currently, the energy shortage and greenhouse effect caused by excessive carbon dioxide (CO2) emissions are realized as major serious problems.1–3 Among plentiful solutions, the direct visible-light photocatalytic reduction of CO2 (VLPCR) into chemical fuels such as methane (CH4), methanol (CH3OH) and formic acid (HCOOH) is considered as a most promising strategy.4–6 Aiming to promote industrial applications of VLPCR, a key challenge is exploring for suitable photocatalysts with high stability and photocatalytic efficiency.7,8 Until now, quite a number of photocatalysts have been investigated as candidates for VLPCR including TiO2, CdS, BiVO4, g-C3N4, et al.9–12 However, problems such as low incident visible-light utilization and fast electron–hole recombination still need to be improved.13–15Among the abundant improvement methods, the surface plasmon resonance (SPR) effect between noble metal nanoparticles and semiconductor photocatalysts recently has aroused broad attention due to its boosted enhancement of photocatalysis.16,17 Therefore, the concept of plasmonic photocatalysis has been proposed, since the investigation of it in Awazu's work.18 Specifically, when the wavelength of the incident light matches the oscillation frequency of free electrons on plasmonic metals, then a SPR effect will be induced, thus enhancing absorption of the incident light. Moreover, the combination of a noble metal and semiconductor can heighten electron–hole separation efficiency, via the formation of Schottky barriers.19 Among the noble metal-based photocatalysts, the relatively inexpensive Ag-based photocatalysts have been investigated the most. Yu et al. prepared Ag/TiO2 via a simple silver mirror reaction for VLPCR, and the results showed that the SPR, which enhanced photocatalytic activity, was closely related to the size and loading amount of Ag.20 Gui et al. synthesized Ag-MWCNT@TiO2 (multi-walled carbon nanotubes@titanium dioxide) core–shell nanocomposites via a one-pot technique, and they found that a 2 wt% Ag loading exhibited excellent VLPCR performance, which was 6.34 μmol g−1-catalyst for CH4 and 0.68 μmol g−1-catalyst for ethylene.21 Heterostructured g-C3N4/Ag–TiO2 hybrid photocatalysts were reported in Li's work, and the optimal catalyst with a g-C3N4 to AgTi mass ratio of 8% displayed the maximum VLPCR activity, obtaining a CH4 yield of 28 μmol and CO yield of 19 μmol per gram of catalyst.22
In order to enhance VLPCR performance through a SPR effect, the physico-chemical structure of the semiconductors is another crucial aspect that needed to be considered. Among the common semiconductors, CeO2 has been thoroughly investigated for various heterogeneous catalytic reactions, including de-NOx, water-gas shift reactions, CO oxidation, and photocatalysis23–26 owing to its abundance of surface oxygen defects and convenient morphology control. Microstructured-CeO2 or its composites (e.g., Pd/CeO2) with various morphologies such as spherical,27 cubic,28 flower-like,29 and coralloid30 morphology have been reported. Li et al. synthesized mesostructured-CeO2/g-C3N4 nanocomposites for a VLPCR test, and the maximum CO and CH4 yield reached up to 11.8 μmol and 13.88 μmol per gram of catalyst, respectively.31 They confirmed that the photo-generated electrons were trapped by Ce4+ in the mesostructured-CeO2, leading to recombination prevention of photogenerated electrons and holes, and thus enhancing the VLPCR performance.
Up to now, investigations of semiconductors with Ag-containing plasmonic photocatalysts mainly focused on TiO2, g-C3N4, etc. but work on Ag–CeO2 plasmonic composites for VLPCR still has not been reported. Herein, in this work, Ag–CeO2 plasmonic photocatalysts with multi-morphologies were synthesized via a simple solvent-driven method, and five common solvents (H2O, methanol, ethanol, isopropanol, and ethylene glycol) were used. The best VLPCR performance was observed over an ACG sample (ethylene glycol was used as the solvent), which obtained a CH4 yield of 100 μmol g−1 h−1 (μmol per gram of catalyst per reaction time (hour)) and CH3OH yield of 35 μmol g−1 h−1. This satisfactory photocatalytic activity was deduced to be caused by an enhanced SPR effect, and the specific enhanced reason was investigated by characterizations using XRD, Raman, XPS, UV-Vis, PL, and photoelectrochemical measurements. An enhancement mechanism was also proposed based on the experimental results. The ultimate goal was to explore a photocatalyst with more efficient conversion of CO2 into chemical fuels.
2. Experimental
2.1 Preparation of the catalysts
All starting reagents were purchased from Alfa Aesar (Thermo Fisher Scientific, China) and used without further purification. Deionized water after a Milipore system purified it was used throughout all experiments. AgNO3, Ce(NO3)3·6H2O, and urea were dissolved in 60 mL of the solvent (H2O, methanol, ethanol, isopropanol, and ethylene glycol) under magnetic stirring. Subsequently, the mixed solution was transferred into Teflon containers (100 mL), sealed in an autoclave, and hydrothermally reacted at 180 °C for 24 h. After washing and centrifugation with deionized water and ethanol several times, the mixture was dried at 60 °C in a vacuum oven overnight and calcinated at 500 °C for 4 h in a pure He atmosphere, following which the final catalysts were obtained. The mass ratio of Ag to Ce over all catalysts was set as 5![[thin space (1/6-em)]](https://www.rsc.org/images/entities/char_2009.gif) :1, and the mole ratio of urea to the total metallic element content (including Ag and Ce) was assigned as 3. The synthesized samples were denoted as ACH, ACM, ACE, ACI, and ACG separately, representing the solvents of H2O, methanol, ethanol, isopropanol, and ethylene glycol, respectively.
:1, and the mole ratio of urea to the total metallic element content (including Ag and Ce) was assigned as 3. The synthesized samples were denoted as ACH, ACM, ACE, ACI, and ACG separately, representing the solvents of H2O, methanol, ethanol, isopropanol, and ethylene glycol, respectively.
2.2 Characterizations
Powder X-ray diffraction (XRD) patterns of the samples prepared in different solvents were recorded in the 10–80° 2θ range (scan speed = 8°·min−1, step value = 0.04°) using an XD-3 diffractometer (Beijing Purkinje General Instrument Co., Ltd., China) (Cu Kα radiation, λ = 1.5418 Å).Raman spectra were recorded on a Renishaw Invia Raman Microscope with Ar + radiation (514 nm). The laser light was focused on the samples by using a microscope equipped with a 6100-objective lens.
The BET surface areas of all samples were obtained on an Autosorb-iQ Analyzer (Quantachrome Instruments). The pore structures were analyzed with the Barrett–Joyner–Halenda (BJH) method. Before the characterization, the samples were dried at 180 °C for 12 h under vacuum.
Field-emission scanning electron microscope (SEM) observations were carried out using a Quanta 250F (FEI, U.S.A.).
High-resolution transmission electron microscopy (HR-TEM) studies were performed on a JEM-2100 electron microscope (JEOL, Japan) with an accelerating voltage of 200 kV that was equipped with a slow-scan charge-coupled device (CCD) camera.
X-ray photoelectron spectroscopy (XPS) analyses were performed on an ESCALAB 250 spectrometer (Thermo, U.S.A.). The X-ray source was Al Kα X-ray radiation (hν = 1486.6 eV). The analyses were performed at room temperature, and the pressures were typically on the order of less than 10−8 Pa. The samples were outgassed overnight in a vacuum oven at 10 °C before acquiring the XPS measurements. All binding energies (BE) were referenced to the adventitious C 1s peak at 284.4 eV. The penetration depth of the XPS probe is 10 nm.
Diffuse reflectance spectroscopy (DRS) was carried out on a Shimadzu UV-2550 UV-Vis spectrophotometer (Shimadzu, Japan). BaSO4 was the reference sample, and the spectra were recorded in the range of 220–1000 nm.
Photoluminescence spectra (PL) were obtained with an ELabram-HR800. The excitation wavelength was set at 325 nm, and the spectra were scanned in a range of 350–600 nm.
2.3 Photoelectrochemical measurements
Photoelectrochemical measurements were performed on a CHI 760B electrochemical workstation (CH Instruments Ins., China) with a conventional three-electrode system in which a Pt wire and a Ag/AgCl electrode (3 mol L−1 KCl) served as the counter and reference electrodes, respectively. A 0.5 mol L−1 Na2SO4 aqueous solution was used as the electrolyte. The photoelectrodes were prepared by a drop casting method. Ten milligrams of photocatalyst powder was dispersed in 1 mL of ethanol containing 10 μL of naphthol to form a homogeneous suspension by an ultrasonic method. All samples were deposited onto Fluorine-doped Tin Oxide (FTO) as a thin film, and the coated area was fixed at 1.5 cm2. After being dried at 180 °C for 12 h in a vacuum oven, a homogeneous film was obtained.2.4 Photoreduction of CO2
A CO2 photocatalytic reduction was typically conducted in a gas-closed circulation system using a 200 mL reactor (Anhui Kemi Machinery Technology Co., Ltd., China). The reactor was made of stainless steel, and the visible light passes through a sapphire at the top. In a typical process, 50 mg photocatalyst was uniformly dispersed into the black Teflon container with 15 mL deionized water, and the suspension was kept stirring. In order to ensure that air was eliminated, the reactor was first vacuumized to the vacuum degree of 0.08 MPa, then the reactor was infused with high purity CO2 (99.99%) gas to a pressure of 0.6 MPa. Next the system was vacuumized again. A washing cyclic process was conducted for at least five times, and finally the reaction system was sealed and maintained at 0.6 MPa for the following CO2 photoreduction. A 300 W Xe lamp (CEL-HXF300, Beijing CEAulight Co., Ltd., China) with a UV-light cutoff filter (λ > 420 nm) was used as the light source. The temperature of the reactor was controlled at 60 °C via an electric jacket. After photoreaction for 6 h, the product in the reactor was slowly injected into a gas chromatograph (GC-9860, Nanjing Hope Corp., China). The reaction products such as CH4, CH3OH, or other carbon-based gases were analysed via a flame ionization detector (FID) equipped with a 5A molecular column and a TDX-01 packed column.3. Results and discussion
3.1 Crystal structural and morphology characterization
Wide angle XRD patterns were conducted to analyse crystal structures of the Ag–CeO2 composites, as shown in Fig. 1(a). Except for ACH, the rest of the samples displayed four main peaks at about 28.6°, 33.1°, 47.5°, and 56.3°, which are in accord with the corresponding (1 1 1), (2 0 0), (2 2 0) and (3 1 1) planes of the cubic CeO2 (JCPDS no. 34-0394).27 In the ACH sample, besides the peaks assigned to the cubic CeO2, other peaks also existed. Peaks at about 38.1° and 44.0° were ascribed to elemental silver, while the peaks at about 17.7°, 24.6°, 30.5°, and 43.5° were assigned to the unreacted AgNO3 precursor. These results indicated that the application of H2O as the solvent did not benefit for the formation of homogeneous Ag–CeO2 composites. The same situation also occurred with the ACI sample, in which isopropanol was used for the preparation. As for ACM, ACE and ACG samples, no distinct peaks assigned to Ag0 or other Ag-contained compounds were found, and no obvious shifts were found when compared to the standard cubic CeO2, thus displaying a good dispersion of Ag species over CeO2. Moreover, the four main peaks over ACM and ACG samples were broadened to a certain degree when compared to the ACE sample. This indicated that particles sizes of the ACM and ACG samples were smaller than those of the ACE sample, based on the Scherrer formula. Hence, it was concluded from XRD results that use of the solvents during the synthetic process played a key role with the crystal structures of the Ag–CeO2 composites. | ||
| Fig. 1 XRD patterns (a), Raman spectra (b), N2 adsorption–desorption isotherms (c), and pore size distributions (d) of Ag–CeO2 composites with different solvents. | ||
The SPR effect of Ag particles over CeO2 was investigated by Raman spectra, as shown in Fig. 1(b). For all the samples, only one Raman band at 445 cm−1 was found in the range from 200 cm−1 to 1000 cm−1, which was assigned to the F2g vibration mode of cubic CeO2.32 Besides, no peak position shift was observed in the Raman spectra among these samples, indicating that the main structures of these samples were the same. However, an apparent increase in intensity of Raman peaks was observed, which was due to the surface enhanced Raman scattering effect (SERS).33 This meant that the electrons on the surface of Ag particles were photoexcited to a high energy state by the Ar+ laser during the Raman spectroscopy experiment. These high energy state electrons could induce a strong near field on the Ag particle surfaces. The Raman peaks over ACM and ACG samples were more intense than in other samples, indicating that the SERS and SPR effects of the surface Ag particles were enhanced over the ACM and ACG samples.
The specific surface areas and the pore structures of all samples were characterized as shown in Fig. 1(c) and (d). All samples displayed isotherms of type IV, in which ACH, ACM, and ACG exhibited hysteresis loops of type H3, while the rest of the samples showed hysteresis loops of type H4.34 The H3 type indicated the existence of slit-like mesopores, while the H4 type represented cranny-like pores between mesopores and micropores.35 The pore distributions of ACH and ACI samples located in a higher range, compared to other samples, are shown in Fig. 1(d).
It was then deduced that the average pore sizes of these ACH and ACI samples were higher than the rest of the samples. Specific BET surface areas and pore structure parameters are listed in Table 1. The deductions concerning the pore sizes of all samples were confirmed, and it was found that ACG displayed the maximum BET surface area and the minimum pore size. These high surface areas could promote adsorption of the reactant gas, thus enhancing the photocatalytic conversion.
| Sample | BET surface area (m2 g−1) | Pore volume (mm3 g−1) | Pore size (nm) |
|---|---|---|---|
| ACH | 8.9 | 30.1 | 31.6 |
| ACM | 48.8 | 27.8 | 6.1 |
| ACE | 39.3 | 56.8 | 6.0 |
| ACI | 30.9 | 100.9 | 31.8 |
| ACG | 52.1 | 46.5 | 4.8 |
SEM characterization was adopted to view the morphologies of all samples at the micrometre scale, as shown in Fig. 2, where it can be seen that using different solvents during preparation resulted in a distinct influence on the morphologies of the samples. The morphologies of ACH, ACM, ACE, ACI, and ACG exhibited octahedral, fusiform, ruleless, spherical, and sheet-like shapes, respectively. Among all samples, the morphology of ACM and ACG was uniform, while the rest were irregular and nonuniform, such as the spherical particle's sizes in the ACI sample. In addition, the morphologies obtained from SEM were in accord with the BET analysis. The elemental concentrations in the ACG sample were characterized via EDS (Energy Dispersive Spectrometer), and the results showed that the mole ratio of Ag to Ce was about 1:10, which was close to the theoretical value of the precursor dosage. This indicated that the Ag and Ce precursors all participated the forming process of the ACG sample, and this process could benefit the uniformity in the morphology.
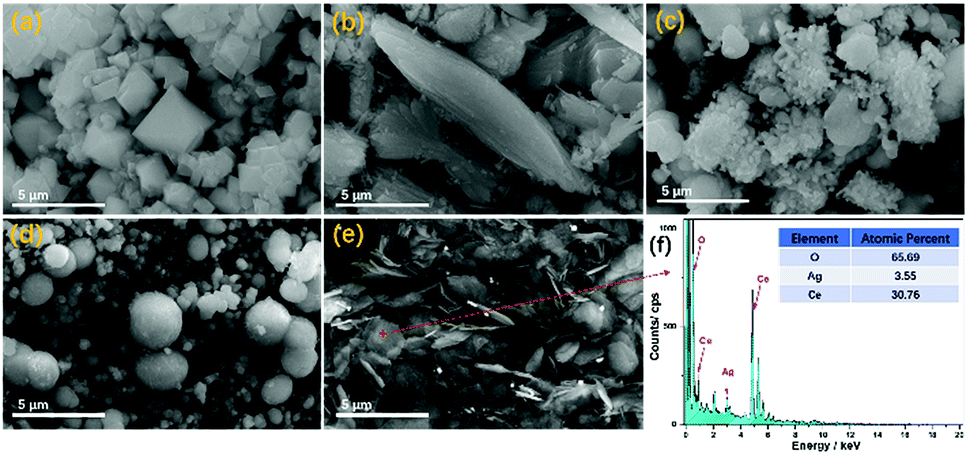 | ||
| Fig. 2 SEM images (a–e) of Ag–CeO2 composites with different solvents. (a) ACH, (b) ACM, (c) ACE, (d) ACI, and (e) ACG. Energy dispersive spectroscopy (EDS) (f) results of the ACG sample. | ||
In order to investigate the existence form of Ag species on CeO2, TEM and HR-TEM characterizations were adopted to observe their morphologies at the nanometre scale, as shown in Fig. 3. At the nanometre scale, it was seen that small particles existed on CeO2, and they were relatively well dispersed. From HR-TEM images, it is seen that there were two kinds of interplanar spacing.
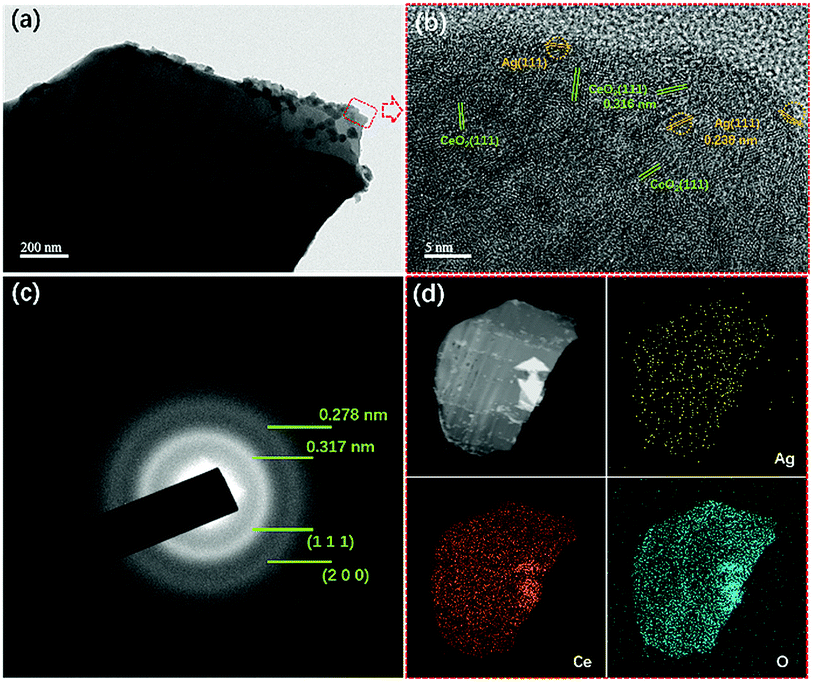 | ||
| Fig. 3 TEM images (a), HR-TEM images (b), selected-area electron diffraction (SAED) (c), and the element mapping images (d) of ACG samples. | ||
One of them exhibited a value of 0.316 nm, and the other one displayed a value of 0.238 nm. The former could be ascribed to the (1 1 1) plane of CeO2, and the later was assigned to the (1 1 1) plane of Ag0. The selected area electron diffraction (SAED) of the ACG sample displayed two continuous rings, which corresponded to the (1 1 1) and (2 0 0) planes of CeO2. The dispersive diffraction ring was caused by agglomeration of the sheets in the ACG sample. In addition, no diffraction ring corresponding to Ag0 could be found, which was due to the good dispersion of Ag0 and the small particle sizes. EDS element mapping was adopted to investigate the element distribution of the sheet, and the results revealed a uniform distribution of each element on the sheet, which was in accord with XRD results. The good dispersion of Ag0 was expected to enhance the SPR effect via providing more SPR spots for the photocatalytic reaction to occur.33
3.2 Photoreduction of CO2 performance
The catalytic performance of photocatalysis is crucial from the point of practical applications.36 Therefore, all samples were evaluated via the VLPCR test, as shown in Fig. 4. It can be seen that the CH4 yield rates over all samples were all higher than the CH3OH yield rates. Especially, there was no CH3OH evolution over the ACH sample. Among all samples, ACM and ACG samples displayed relatively high CH4 and CH3OH yield rates, which were 89.32 μmol g−1 h−1 and 99.98 μmol g−1 h−1 for CH4, and 32.13 μmol g−1 h−1 and 34.96 μmol g−1 h−1 for CH3OH, respectively.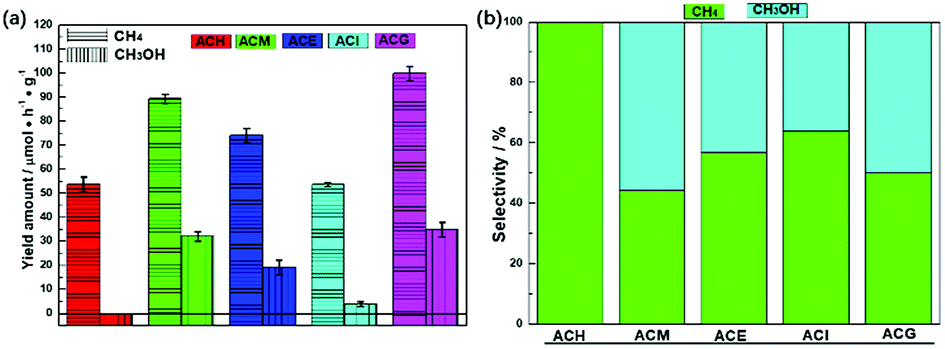 | ||
| Fig. 4 Photocatalytic CH4 and CH3OH evolution performance (a) and the selectivity of the corresponding product over Ag–CeO2 composites with different solvents (b). | ||
Combined with the crystal structure and morphology analysis, it was concluded that the high VLPCR performance was related to the uniform morphology and the good dispersion of Ag species, which was a key factor in this Ag-based plasmonic photocatalyst. Selectivities of the corresponding products over all samples were calculated as shown in Fig. 4(b). The CH4 selectivities of ACE and ACI samples were higher than CH3OH selectivity, while the opposite result was found over the ACM sample. The ACG sample displayed almost the same CH4 and CH3OH selectivity. The CH3OH selectivity of the ACM sample reached up to 55.65%. A comparison of CH4 and CH3OH evolution amounts for CeO2-based samples is shown in Table 2. It can be seen that different CeO2-contained composites were synthesized. However, the products CH4 and CH3OH could not be obtained simultaneously from these samples, and the CH4 yield amounts over certain samples was far lower than the values in this work. The CH3OH evolution amount here was relatively high, although some samples displayed higher values. As a short summary, compared with other CeO2-based photocatalysts, the Ag–CeO2 plasmonic photocatalyst prepared via a simple solvents-driven method in this work displayed delightful CH4 and CH3OH yields caused by the SPR effects.
The stability of semiconductor photocatalytic materials can't be neglected. Therefore, four cyclic CH4 and CH3OH evolution tests over Ag–CeO2 plasmonic photocatalyst were carried out, in which the optimized ACG sample was applied. The stability test is described as where a used sample is collected by a centrifugal process for the next VLPCR test. As observed in Fig. 5, the CH4 and CH3OH yields were decreased slightly after a fourth cyclic test, indicating that the synthesized Ag–CeO2 plasmonic photocatalysts possessed satisfactory stability properties.
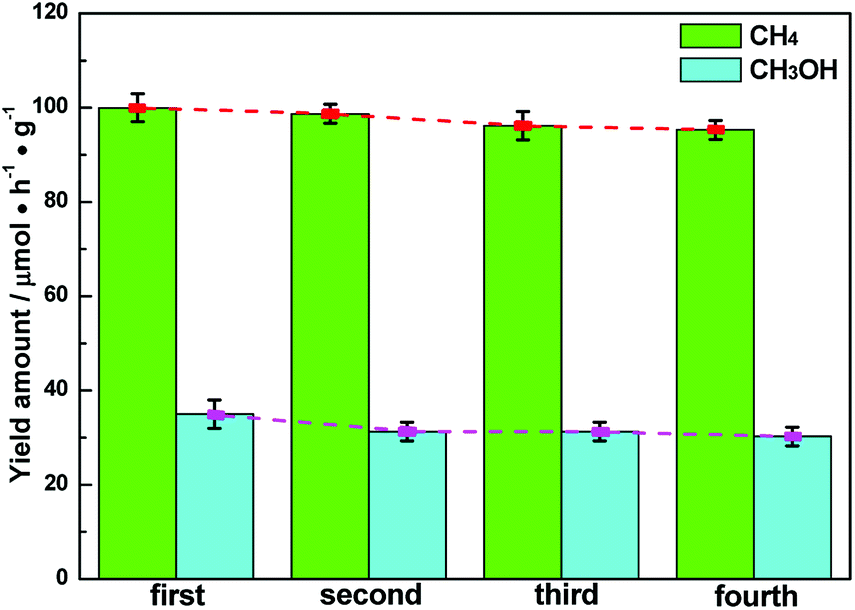 | ||
| Fig. 5 Cyclic stability tests of an ACG sample. | ||
3.3 XPS characterization
In order to investigate enhancement of the SPR effect of Ag nanoparticles on VLPCR, several kinds of characterizations were adopted, and XPS analysis was first applied, as shown in Fig. 6. The survey spectra displayed in Fig. 6(a) confirmed the existence of Ag, Ce, and O in all catalysts, but the peak intensities corresponding to Ag 3d were all weak, which was due to a low Ag precursor concentration. Fig. 6(b) exhibits a typical XPS spectrum of Ag 3d, in which peaks at about 374 and 368 eV were attributed Ag 3d3/2 and Ag 3d5/2, respectively. Specifically, all samples were numerically fitted into the metallic Ag0 and Ag+ states, and for each electron orbit the fitted peak at high binding energy was assigned to the metallic Ag0 while the peak at low binding energy belonged to the Ag+ state.41 In addition, there was no obvious peak shift among these samples, but the surface concentrations of metallic Ag0 were markedly different. The results are shown in Table 3 where it can be seen that ACH exhibited the lowest surface Ag0 content among all samples and, by contrast, ACM and ACG possessed relatively higher Ag0 content. It was reported that the SPR effect could be enhanced by an increase of the surface Ag0 ratios,41 which should be under the premise of a good dispersion of Ag species. Hence, the surface Ag0 ratios played the key role in the photocatalytic reaction, and the VLPCR results further confirmed this deduction.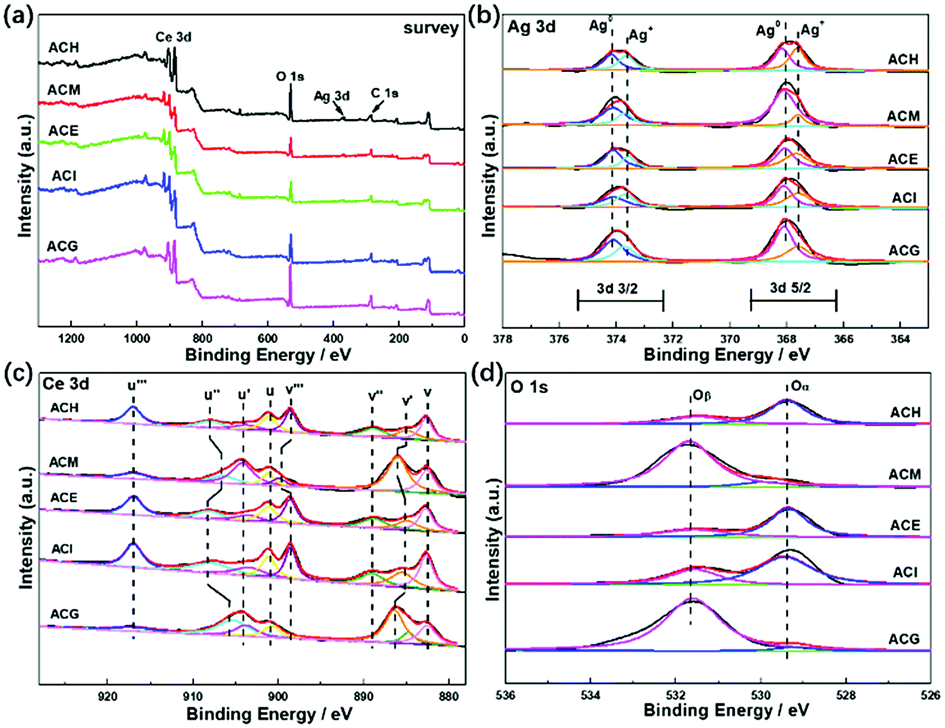 | ||
| Fig. 6 XPS spectra of Ag–CeO2 composites with different solvents: (a) survey; (b) Ag 3d; (c) Ce 3d; and (d) O 1s. | ||
| Sample | Cation ratios | ||
|---|---|---|---|
| Ag0/Ag(total) | Ce3+/Ce(total) | Oβ/(Oα + Oβ) | |
| ACH | 50.38% | 17.05% | 32.91% |
| ACM | 86.11% | 21.18% | 90.53% |
| ACE | 66.38% | 18.27% | 32.64% |
| ACI | 65.27% | 19.71% | 38.92% |
| ACG | 85.32% | 25.25% | 95.52% |
The Ce 3d spectrum was fitted into eight peaks in two different regions (3d5/2: v series and 3d3/2: u series) via Gaussian fitting, as shown in Fig. 6(c), in which the peaks labelled v, v′′, v′′′ and those labelled u, u′′, u′′′ were ascribed to the Ce4+ state, while the v′ and u′ peaks were assigned to the Ce3+ state.42 For the O 1s spectra, two main peaks were separated after fitting and the peak at a lower binding energy was denoted as Oα corresponding to the lattice oxygen (O2−), while the peak at a higher binding energy was named Oβ corresponding to chemisorbed oxygen, such as O2− or O−.43 From the surface cation concentration results in Table 3, it can be seen that ACM and ACG displayed higher Ce3+ and Oβ ratios than other samples. This could be ascribed to high Ag0 ratios and the good dispersion of Ag species on the surface. It is known that Ce3+ and Ce4+ can be interconverted via the transfer of an electron, and the surface Ag0 could transfer this electron easily, thus promoting the generation of Ce3+. On one hand the transferred electron could be reacted with O2 to form chemisorbed O2−, but on the other hand the formation of Ce3+ distorted the lattice and then promoted the generation of O−. Therefore, the high Ce3+ and Oβ ratios in ACM and ACG samples indicated their good electron transport abilities, thus leading to the high VLPCR performance.
3.4 Band structure and photoelectric properties analysis
Since the optical absorption properties of a photocatalyst play a significant role in determining photocatalytic performance, information on the band structure was investigated via UV-Vis DRS measurements, as shown in Fig. 7. All catalysts exhibited an absorption band centred at 270 nm, which was ascribed to the Ce4+ ← O2− charge transfer. Besides, except for the ACI sample, the rest of the samples also displayed absorption caused by the Ce4+ ← O2− interband, which was located at 360 nm.23 In addition, it can be seen that the light adsorption of ACM and ACG samples was enhanced both in the UV and visible light regions, and this was attributed to the SPR effect of the Ag particles over CeO2,20 in accord with Raman and XPS analysis. Based on the Kubelka–Munk function, the UV-Vis spectra were converted into Tauc plots, as shown in Fig. 7(b).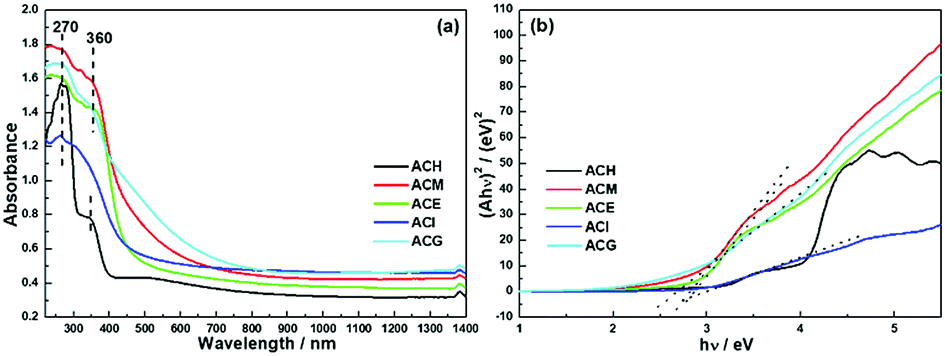 | ||
| Fig. 7 UV-Vis diffuse reflection spectra (a) and converted Tauc plots of Ag–CeO2 composites with different solvents (b). | ||
The band gap (Eg) was obtained via the point of intersection between the tangent line of the Tauc plot and the y = 0 plot. The square form of Ahv indicated that the band gaps of these samples were all direct band gaps. Specific Eg value are shown in Table 4, and among them ACM, ACE, and ACG samples exhibited a relatively small Eg value. Combined with XRD analysis, the narrowed band gap was probably due to the good dispersion of Ag particles over CeO2.22
| Sample | ECB (eV) | EVB (eV) | Eg (eV) |
|---|---|---|---|
| ACH | −0.31 | 2.70 | 3.01 |
| ACM | −0.61 | 2.19 | 2.80 |
| ACE | −0.49 | 2.37 | 2.86 |
| ACI | −0.43 | 2.56 | 2.99 |
| ACG | −0.67 | 2.02 | 2.69 |
More information about the photoelectric properties were explored via PL and photoelectrochemical measurements, as shown in Fig. 8. Among these characterizations, Mott–Schottky measurements were conducted over all catalysts to clarify their band structures. Reversed sigmoidal plots were observed with an overall shape consistent with that typical for n-type semiconductors, as shown in Fig. 8(a). The flat band potentials (Vfb) of all samples were calculated from the x intercept of the linear region, where the units are V vs. Ag/AgCl. Based on the equation E (NHE, normal hydrogen electrode) = E(Ag/AgCl) + 0.197 V,44 Vfb was converted into the NHE potential. In general, Vfb is close to the bottom of the conduction band (ECB) of n-type semiconductors, and ECB is more negative than Vfb (here, the value of 0.1 V vs. NHE was adopted for the calculation of ECB over all samples). Hence, according to the above analysis, the band structures of all samples are summarized in Table 4. It can be seen that ACM and ACG exhibited more negative ECB values than other samples, while ACH possessed the highest ECB value among all samples. Generally, the catalysts with more negative ECB values possessed a stronger reducing capacity. Therefore, ACM and ACG displayed a stronger reducing capacity than other samples, which was attributed to the enhanced SPR effect caused by the good dispersion of Ag particles and high Ag0 ratios. Moreover, according to eqn (1) and (2), the samples synthesized in this work all possessed a reduction potential to convert CO2 into CH4 and CH3OH, except for ACH. Only CH4 could be generated theoretically over ACH. Hence, no CH3OH was detected over ACH in the VLPCR test.
| CO2 + 8H+ + 8e− → CH4 + 2H2O E0(V) = −0.24 eV | (1) |
| CO2 + 6H+ + 6e− → CH3OH + H2O E0(V) = −0.38 eV | (2) |
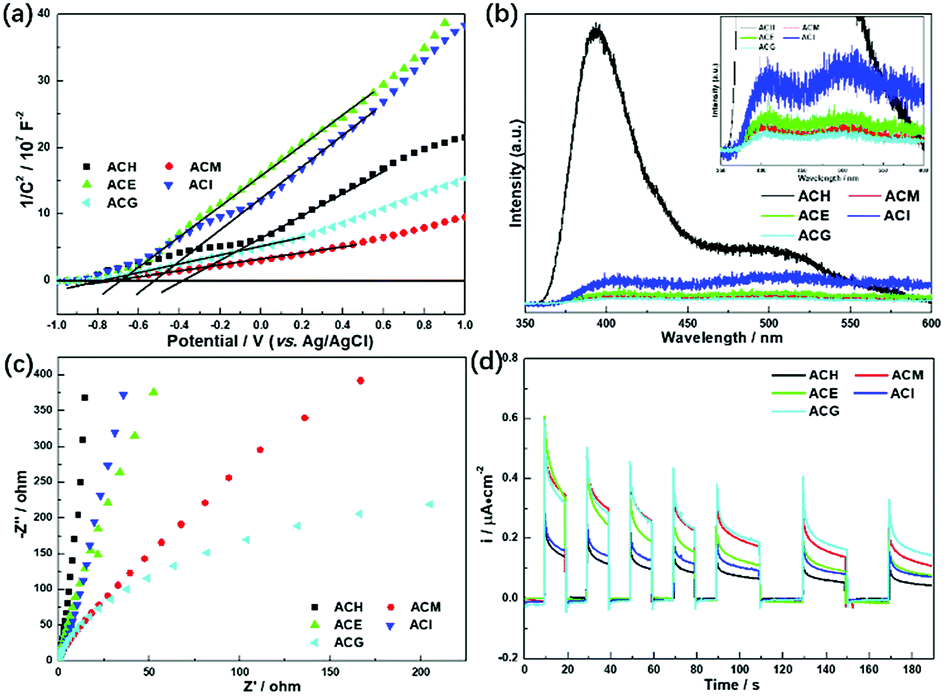 | ||
| Fig. 8 Mott–Schottky plots (a), photoluminescence (PL) spectra (b), EIS Nyquist plots (c), and photocurrent potential curves (d) of the Ag–CeO2 composites with different solvents. | ||
The separation and transfer of charge carriers in these samples was investigated via their photoluminescence spectra, as shown in Fig. 8(b). It is well known that PL emission intensity can reflect the separation and recombination of electrons and holes on the surface of a photocatalyst. A low emission intensity confirms a suppressed recombination rate of photoinduced electrons and holes, and vice versa.45 Among all samples, ACH exhibited the strongest PL emission peak intensity at 400 nm, which belongs to the radiative recombination of photoinduced electrons and holes on the surface of ACH. Compared to ACM, ACE, and ACG, these three samples displayed weaker peak intensity, corresponding to the larger separation ability of photogenerated electrons and holes.
As a matter of fact, the efficient separation of photoinduced electrons and holes also could be reflected in the much smaller diameter of the semi-circular Nyquist curve of electrochemical impedance spectroscopy (EIS) and the increased photocurrent density under visible light.46 A small radius usually indicates a low charge transfer resistance and a high separation efficiency of photogenerated electron–hole pairs.47 As shown in Fig. 8(c), ACM and ACG displayed a smaller radius among all samples, indicating that these two samples possessed higher separation efficiency, which was in accord with PL analysis. A similar phenomenon was observed in the photocurrent test, as shown in Fig. 8(d), where ACG displayed the largest photocurrent density during on–off cycles of intermittent visible light irradiation among all samples, and ACM took second place. The improved separation and transfer efficiency of charge carriers over ACM and ACG was due to the enhanced SPR effect, which was induced by the good dispersion of Ag particles and high Ag0 ratios. Therefore, it can be concluded from UV-Vis, PL, and photoelectric test results that the enhanced SPR effect could lead to the negative ECB value, the narrowed band gap and the excellent photoelectric properties, and these features played a significant role in the photocatalytic reaction, thus improving the VLPCR performance.
3.5 VLPCR enhancement mechanism
Based on the above results, the mechanism of the enhanced VLPCR on an Ag–CeO2 composite was proposed, as shown in Fig. 9. In general, the Fermi level (Ef) of CeO2 is higher than that of Ag.33 Hence, when CeO2 and Ag particles were in contact, the electrons on the CeO2 tended to migrate to Ag particles to achieve the Fermi equilibrium of the system (Fig. 9(a)). In addition, after contact, a positive space-charge region was formed on the surface of the semiconductor, which resulted in the electron energy of the surface being higher than that in the bulk. Therefore, the energy band was bent upward and a Schottky barrier was generated, which prevented the electrons in the semiconductor from transferring to metals. | ||
| Fig. 9 (a) Schematic illustration of the band structure of Ag and CeO2 before and after contact. (b) Schematic illustration for SPR induced “hot-electron” migration on the Ag–CeO2 composite. (c) Schematic diagram of band structure and redox potential of Ag–CeO2 composites with different solvents. | ||
However, under light irradiation, the highly energetic “hot-electrons” generated by the SPR effect of the Ag particles could overcome the Schottky barrier between CeO2 and Ag particles and migrate to the neighbouring CeO2, leading to the increase in surface electron density (Fig. 9(b)). These photoexcited hot electrons could be utilized during the VLPCR test. In addition, the near field effect induced by the Ag particles could accelerate the transport of electrons on CeO2, thus improving the charge carrier transport efficiency. The good dispersion of Ag particles over CeO2 could create multiple SPR active sites, which was beneficial for further intensifying the near field effect to enhance charge carrier transport efficiency. Although VLPCR performance could be enhanced by the SPR effect, not all samples possessed the reduction potential to generate the production of CH3OH, such as ACH, shown in Fig. 9(c). In general, catalysts with more negative ECB values possessed a stronger reducing capacity. Among all samples, ACG possessed the most negative ECB values, and coupled with the strong SPR effect caused by the uniform distribution of Ag particles and the highest Ag0 ratios, thus the largest CH4 and CH3OH evolution amount was obtained over ACG.
4. Conclusions
In summary, a simple solvent-driven method was applied to form Ag/CeO2 plasmonic photocatalysts with multi-morphologies, in which five common solvents (H2O, methanol, ethanol, isopropanol, and ethylene glycol) were used. Among these samples, ACM and ACG displayed a high VLPCR activity, achieving a CH4 yield of 89.32 μmol and 99.98 μmol, and CH3OH yield of 32.13 μmol and 34.96 μmol per gram of catalyst per hour during a 6 h visible-light irradiation. The improved VLPCR performance was ascribed to the enhanced SPR. The SPR effect could boost the absorption of the incident light and facilitate the charge carrier separation and transport efficiency. After being characterized by various kinds of techniques, it was demonstrated that the enhanced SPR effect was induced by the good dispersion of Ag particles on CeO2 and high Ag0 ratios on their surfaces. Moreover, ACM and ACG possessed a narrower band gap, thus promoting absorption of visible light. And ACM and ACG exhibited larger surface areas than other samples, which could improve VLPCR activity from the aspect of promoting adsorption of the reactant gas. And last, the mechanism of the enhanced VLPCR on Ag–CeO2 composite was proposed.Conflicts of interest
There are no conflicts to declare.Acknowledgements
This work was financially supported by the National Natural Science Foundation of China (51808296 and 51802160), the Natural Science Foundation of Jiangsu Province of China (BK20170938, BK20150892 and BK20160834), the 63rd Chinese Postdoctoral Science Foundation (2018M630487), and the Startup Foundation for Introducing Talent of NUIST (2243141601034). In addition, Wei Cai would also like to acknowledge support and helpful discussion from the WECHAT group named “Energetic and Progressive Mightyboy”!Notes and references
- J. Low, J. Yu, M. Jaroniec, S. Wageh and A. A. Al-Ghamdi, Adv. Mater., 2017, 29, 1601694 CrossRef PubMed.
- K. Li, B. Peng and T. Peng, ACS Catal., 2016, 6, 7485–7527 CrossRef CAS.
- P. Zhou, J. Yu and M. Jaroniec, Adv. Mater., 2014, 26, 4920–4935 CrossRef CAS PubMed.
- W. Wang, D. Xu, B. Cheng, J. Yu and C. Jiang, J. Mater. Chem. A, 2017, 5, 5020–5029 RSC.
- O. Ola and M. M. Maroto-Valer, J. Photochem. Photobiol., C, 2015, 24, 16–42 CrossRef CAS.
- J. Fu, B. Zhu, C. Jiang, B. Cheng, W. You and J. Yu, Small, 2017, 13, 1603938 CrossRef PubMed.
- W. Tu, Y. Zhou and Z. G. Zou, Adv. Mater., 2014, 26, 4607–4626 CrossRef CAS PubMed.
- P. Li, H. Li, W. Tu, Y. Zhou and Z. Zou, Acta Phys. Sin., 2015, 64, 094209–094218 Search PubMed.
- M. Tahir, B. Tahir and N. A. S. Amin, Appl. Catal., B, 2017, 204, 548–560 CrossRef CAS.
- R. Chen, X. Cheng, X. Zhu, Q. Liao, L. An, D. Ye, X. He and Z. Wang, Chem. Eng. J., 2017, 316, 911–918 CrossRef CAS.
- C. Kim, K. M. Cho, A. Al-Saggaf, I. Gereige and H. T. Jung, ACS Catal., 2018, 8, 4170–4177 CrossRef CAS.
- Y. Wang, Q. Xia, X. Bai, Z. Ge, Q. Yang, C. Yin, S. Kang, M. Dong and X. Li, Appl. Catal., B, 2018, 239, 196–203 CrossRef CAS.
- P. Xia, B. Zhu, J. Yu, S. Cao and M. Jaroniec, J. Mater. Chem. A, 2017, 5, 3230–3238 RSC.
- H. Wang, Y. Sun, G. Jiang, Y. Zhang, H. Huang, Z. Wu, S. C. Lee and F. Dong, Environ. Sci. Technol., 2018, 52, 1479–1487 CrossRef CAS PubMed.
- T. Xiong, H. Wang, Y. Zhou, Y. Sun, W. Cen, H. Huang, Y. Zhang and F. Dong, Nanoscale, 2018, 10, 8066–8074 RSC.
- J. Li, W. Zhang, M. Ran, Y. Sun, H. Huang and F. Dong, Appl. Catal., B, 2019, 243, 313–321 CrossRef CAS.
- Z. Wang, S. Yan, Y. Sun, T. Xiong, F. Dong and W. Zhang, Appl. Catal., B, 2017, 214, 148–157 CrossRef CAS.
- K. Awazu, M. Fujimaki, C. Rockstuhl, J. Tominaga, H. Murakami, Y. Ohki, N. Yoshida and T. Watanabe, J. Am. Chem. Soc., 2008, 130, 1676–1680 CrossRef CAS PubMed.
- S. C. Roy, O. K. Varghese, M. Paulose and C. A. Grimes, ACS Nano, 2010, 4, 1259–1278 CrossRef CAS PubMed.
- B. Yu, Y. Zhou, P. Li, W. Tu, P. Li, L. Tang, J. Ye and Z. Zou, Nanoscale, 2016, 8, 11870–11874 RSC.
- M. M. Gui, W. M. P. Wong, S. P. Chai and A. R. Mohamed, Chem. Eng. J., 2015, 278, 272–278 CrossRef CAS.
- H. Li, Y. Gao, X. Wu, P. H. Lee and K. Shih, Appl. Surf. Sci., 2017, 402, 198–207 CrossRef CAS.
- W. Cai, Q. Zhong, D. Wang, Y. Zhao, M. Chen and Y. Bu, ACS Appl. Nano Mater., 2018, 1, 1150–1163 CrossRef CAS.
- L. Pastor-Pérez, V. Belda-Alcázar, C. Marini, M. M. Pastor-Blas, A. Sepúlveda-Escribano and E. V. Ramos-Fernandez, Appl. Catal., B, 2018, 225, 121–127 CrossRef.
- M. Lykaki, E. Pachatouridou, S. A. C. Carabineiro, E. Iliopoulou, C. Andriopoulou, N. Kallithrakas-Kontos, S. Boghosian and M. Konsolakis, Appl. Catal., B, 2018, 230, 18–28 CrossRef CAS.
- J. Cai, X. Wu, S. Li and F. Zheng, Appl. Catal., B, 2017, 201, 12–21 CrossRef CAS.
- R. Murugan, G. Ravi, G. Vijayaprasath, S. Rajendran, M. Thaiyan, M. Nallappan, M. Gopalanb and Y. Hayakawa, Phys. Chem. Chem. Phys., 2017, 19, 4396–4404 RSC.
- W. Zou, Y. Shao, Y. Pu, Y. Luo, J. Sun, K. Ma, C. Tang, F. Gao and L. Dong, Appl. Catal., B, 2017, 218, 51–59 CrossRef CAS.
- Y. Xue, H. Huang, H. Miao, S. Sun, Q. Wang, S. Li and Z. Liu, J. Power Sources, 2017, 358, 50–60 CrossRef CAS.
- W. Cai, Q. Zhong, Y. Yu and S. Dai, Chem. Eng. J., 2016, 288, 238–245 CrossRef CAS.
- M. Li, L. Zhang, M. Wu, Y. Du, X. Fan, M. Wang, L. Zhang, Q. Kong and J. Shi, Nano Energy, 2016, 19, 145–155 CrossRef CAS.
- W. Cai, Q. Zhong, S. Zhang and W. Zhao, Chem. Eng. J., 2014, 236, 223–232 CrossRef CAS.
- J. Low, S. Qiu, D. Xu, C. Jiang and B. Cheng, Appl. Surf. Sci., 2018, 434, 423–432 CrossRef CAS.
- S. Brunauer, L. S. Deming, W. E. Deming and E. Teller, J. Am. Chem. Soc., 1940, 62, 1723–1732 CrossRef CAS.
- K. S. W. Sing, D. H. Everett, R. A. W. Haul, L. Moscou, R. A. Pierotti, J. Rouquérol and T. Siemieniewska, Pure Appl. Chem., 1985, 57, 603–619 CAS.
- S. Wan, M. Ou, Q. Zhong and W. Cai, Carbon, 2018, 138, 465–474 CrossRef CAS.
- Y. Wang, J. Zhao, T. Wang, Y. Li, X. Li, J. Yin and C. Wang, J. Catal., 2016, 337, 293–302 CrossRef CAS.
- W. Xiong, W. Dai, X. Hu, L. Yang, T. Wang, Y. Qin, X. Luo and J. Zou J, Mater. Lett., 2018, 232, 36–39 CrossRef CAS.
- W. Dai, X. Hu, T. Wang, W. Xiong, X. Luo and J. Zou, Appl. Surf. Sci., 2018, 434, 481–491 CrossRef CAS.
- H. Abdullah, M. R. Khan, M. Pudukudy, Z. Yaakob and N. A. Ismail, J. Rare Earths, 2015, 33, 1155–1161 CrossRef CAS.
- L. Ye, J. Liu, C. Gong, L. Tian, T. Peng and L. Zan, ACS Catal., 2012, 2, 1677–1683 CrossRef CAS.
- W. Cai, Q. Zhong, J. Ding and Y. Bu, Chem. Eng. J., 2015, 270, 1–8 CrossRef CAS.
- W. Cai, Y. Zhao, M. Chen, X. Jiang, H. Wang, M. Ou, S. Wan and Q. Zhong, Chem. Eng. J., 2018, 333, 414–422 CrossRef CAS.
- J. Tang, R. Guo, W. Zhou, C. Huang and W. Pan, Appl. Catal., B, 2018, 237, 802–810 CrossRef CAS.
- Q. Zhang, Y. Huang, L. F. Xu, J. J. Cao, W. K. Ho and S. C. Lee, ACS Appl. Mater. Interfaces, 2016, 8, 4165–4174 CrossRef CAS PubMed.
- S. Wan, M. Ou, Q. Zhong, S. Zhang and W. Cai, Adv. Opt. Mater., 2017, 5, 1700536–1700546 CrossRef.
- N. J. Bell, Y. H. Ng, A. Du, H. Coster, S. C. Smith and R. Amal, J. Phys. Chem. C, 2011, 115, 6004–6009 CrossRef CAS.
| This journal is © The Royal Society of Chemistry 2018 |