
 Open Access Article
 This Open Access Article is licensed under a Creative Commons Attribution-Non Commercial 3.0 Unported Licence
Tin disulphide/nitrogen-doped reduced graphene oxide/polyaniline ternary nanocomposites with ultra-high capacitance properties for high rate performance supercapacitor
Zichen Xua,
Zhiqiang Zhanga,
Leilei Gao b,
Hongtao Lin*a,
Li Xuea,
Ziyan Zhoua,
Jin Zhoua and
Shuping Zhuoa
b,
Hongtao Lin*a,
Li Xuea,
Ziyan Zhoua,
Jin Zhoua and
Shuping Zhuoa
aSchool of Chemistry and Chemical Engineering, Shandong University of Technology, Zibo 255000, P. R. China. E-mail: linht@sdut.edu.cn
bSchool of Mathematics and Statistics, Shandong University of Technology, Zibo, 255000, P. R. China
First published on 3rd December 2018
Abstract
In this work, tin disulfide/nitrogen-doped reduced graphene oxide/polyaniline ternary composites are synthesized via in situ polymerization of aniline monomers on the surface of tin disulfide/nitrogen-doped reduced graphene oxide nanosheets binary composites with different loading of the conducting polymers. The tin disulfide/nitrogen-doped reduced graphene oxide/polyaniline ternary composites electrode shows much higher specific capacitance, specific energy and specific power values than those of pure polyaniline and tin disulfide/nitrogen-doped reduced graphene oxide binary composites. The highest specific capacitance, specific energy and specific power values of 1021.67 F g−1, 69.53 W h kg−1 and 575.46 W kg−1 are observed for 60% polyaniline deposited onto tin disulfide/nitrogen-doped reduced graphene oxide composites at a current density of 1 A g−1. The above composites also show superior cyclic stability and 78% of the specific capacitance can be maintained after 5000 galvanostatic charge–discharge cycles. The good charge-storage properties of tin disulfide/nitrogen-doped reduced graphene oxide/polyaniline ternary composites is ascribed to the organic–inorganic synergistic effect. This study paves the way to consider tin disulfide/nitrogen-doped reduced graphene oxide/polyaniline ternary composites as excellent electrode materials for energy storage applications.
Introduction
In recent years, electrochemical supercapacitors (ESCs) have attracted considerable attention in the field of energy storage devices for a variety of portable electronics and electrical vehicles, due to their ability for storing higher energy density than conventional electrostatic capacitors and delivering higher charge numbers than batteries.1,2 According to the charge–discharge storage mechanisms, the ESCs can be classified into two major groups: electrical double-layer capacitors (EDLCs) and pseudocapacitors.3 EDLCs are usually composed of carbon materials or carbon-based materials with high surface area and suitable pore size,4 such as carbon black,5 carbon nanosheets,6 carbon mesopores7 and graphene oxide,8 while pseudocapacitors normally use electro-active conducting polymers and transition metal oxides as electrode materials.9,10 It has been demonstrated that pseudocapacitors possess much larger specific capacitance and energy density than EDLCs, but the EDLCs can retain better cycling stability and electrical conductivity than the pseudocapacitors.11,12 Therefore, multicomponent electrode materials are designed and prepared through combing with energy storage of electrostatic attraction for the EDLCs and faradaic redox reaction for the pseudocapacitors,13 in which the active electrode materials such as conducting polymers or transition metal oxides can increase the capacitance remarkably, while the carbon-based material as a support, not only enhances the effective utilization of active electrode materials, but also develops the electrical conductivity and mechanical strength of the multicomponent electrodes.14–18Tin disulfide (SnS2) has a layered hexagonal CdI2-type crystal structure with tin cations sandwiched between two layers of close-packed sulfur anions.19 In this structure, the three-layer structure formed by sulfide-tin-sulfide is stacked along the c-axis and combined together by van der Waals interactions.20,21 Therefore, SnS2 has the possibility to form the two-dimensional nanobuilding blocks similar to the surface structure of graphene and it is more compatible with graphene for the preparation of a nanocomposite than the previous graphene composites with structurally and morphologically diverse electrode materials such as Sn and SnO2.22 For example, Youn23 prepared the composites of nitrogen-doped reduced graphene oxide (NRGO) and nanocrystalline tin sulfides by one-step synthesis and compared among the specific capacitance of bared tin sulfides, bared graphene and the composites of tin sulfides/nitrogen-doped reduced graphene oxide (SnSx/NRGO). This result demonstrates that the composites of SnS2/NRGO have the best cycling stability and the largest specific capacitance in all electrode materials that occurred in this experiment, in which the specific capacitance up to 562 mA h g−1 at the 200th cycle at 0.2 A g−1 rate. However the low practical capacitance and poor electrical conductivity hinder their application as promising electrode materials for the composites of SnS2/NRGO.24,25 Therefore conducting polymers are the most promising doped materials, especially polyaniline (PANI), can improve the electrochemical performance of multicomponent electrode materials because of its good electrical conductivity and large practical capacitance.26,27 For example, Wang28 prepared the composite of GO/PANI/Co3O4 by hydrothermal treatment method in suit polymerization, combining self-assembly of GO/cobalt salts hybrid sols with RGO/PANI, and the specific capacitance up to 789.7 F g−1. This result demonstrates that the large specific surface area and high electrical conductivity of PANI nanofibers can improve the electrochemical performance of the GO/PANI/Co3O4 ternary composites. But the contraction and expansion of PANI during charge and discharge restricts its wide application in supercapacitors.26 Therefore the ternary composites possess better electrochemical performance than the binary composites and it can make up for many deficiencies of binary composites.29–31
In this work, we report the first doping PANI on the surface of flower-like SnS2/NRGO binary composites so as to improve the electrochemical performance of SnS2/NRGO and get the promising ternary electrode materials for the supercapacitor. Through a series experiments, it is proved that the proper amount of PANI doping can generate synergistic effect with SnS2/NRGO. The ternary composite with 60% PANI doping has the largest specific capacitance of 1021.67 F g−1 at current density of 1 A g−1 and its capacitance retention rate is up to 78% at current density of 10 A g−1 after charge–discharge 5000 cycles.
Experimental section
Materials
Graphite powder (325 mesh), sodium nitrate (NaNO3), potassium permanganate (KMnO4), hydrogen peroxide (H2O2), dialysis membrane, tin tetrachloride (SnCl4), thiourea (CH4N2S), ethanol, aniline (An), hydrochloric acid (HCl), ammonium persulfate (APS), deionized water.Synthesis of graphene oxide
GO was produced using the modified Hummers' method from the graphite power.32 2 g of the graphite power in 96 mL of concentrated H2SO4 was stirred in an ice bath. 12 g of KMnO4 was added to the above solution slowly with stirred at 35 °C for 2 h and then the temperature was elevated to 60 °C and remained for another 2 h. The reaction was terminated by adding 280 mL of distilled water and 10 mL of 30% H2O2 solution. The mixture was filtered and washed with deionized water several times. Graphene oxide was obtained after drying under vacuum freeze-drying.Preparation of SnS2/NRGO hybrid materials
A massage cushion-like binary composite material SnS2/NRGO was first prepared in a typical process. 0.58 mL of tin tetrachloride (SnCl4) and 250 mg of graphene oxide (GO) were added into a solution of ethanol (50 mL), then 584.3 mg of thiourea (CH4N2S) were added which provides sulfur and nitrogen sources. After the mixture was stirred for 1 h, brown suspension was obtained. The mixture was then transferred into a 100 mL Teflon stainless steel autoclave, sealed, and heated at 180 °C for 24 h in an oven. After cooled to room temperature under natural conditions, the precipitations was collected with centrifugation and washed several times with ethanol and deionized water, and then dried under vacuum freeze-drying for 24 h. The binary composite material SnS2/NRGO was obtained finally.Preparation of SnS2/NRGO/PANI hybrid materials
The SnS2/NRGO/PANI ternary hybrid materials were prepared by in suit oxidative polymerization of aniline (An) monomers on the surface of the binary composite SnS2/NRGO. Ammonium persulfate ((NH4)2S2O8, APS) was used as oxidizer. The preparation process for the sample with the amount of polyaniline (PANI) takes 80 wt% as an example, in the following statement, named as SnS2/NRGO/PANI-80. Typically, 30 mg of SnS2/NRGO was ultrasonic dissolved in 30 mL of ultrapure water and the suspension for the binary composite SnS2/NRGO (1 mg mL−1) was obtained. 118 μL aniline was first dissolved in 10 mL hydrochloric acid (HCl, 2 mol L−1) and was added dropwise to the above suspension of SnS2/NRGO. The obtained mixture was stirred for 1 h. APS with a molar ratio of 1.5![[thin space (1/6-em)]](https://www.rsc.org/images/entities/char_2009.gif) :1 (aniline:APS) was quickly added to the suspension and the suspension was stirred continually for 10 h in an ice bath (∼4 °C). The obtained precipitates were washed with deionized water and freeze-drying for 24 h. Finally, the ternary composite SnS2/NRGO/PANI-80 was obtained. The other samples were obtained by vary in the amount of aniline monomers during the polymerization processes, which were denoted as SnS2/NRGO/PANI-α and α represented the mass percentage of PANI in the hybrid materials (α = 20, 40, 60 and 80). For comparison, the pure PANI was also prepared by low temperature polymerization.
:1 (aniline:APS) was quickly added to the suspension and the suspension was stirred continually for 10 h in an ice bath (∼4 °C). The obtained precipitates were washed with deionized water and freeze-drying for 24 h. Finally, the ternary composite SnS2/NRGO/PANI-80 was obtained. The other samples were obtained by vary in the amount of aniline monomers during the polymerization processes, which were denoted as SnS2/NRGO/PANI-α and α represented the mass percentage of PANI in the hybrid materials (α = 20, 40, 60 and 80). For comparison, the pure PANI was also prepared by low temperature polymerization.
Characterization
X-ray diffraction (XRD) measurements were conducted by using a Bruker D8 Advance diffraction (Bruker Corporation, Karlsruhe Germany) with Cu Kα radiation. The microscopic morphology of the products were observed with a scanning electron microscopy (SEM; Sirion 200, FEI Company, Amsterdam, The Netherlands) and high-revolution transmission electron microscopy (HRTEM; Tecnai G2TF20 S-TWIN, FEI Company) at a working voltage of 200 kV, and the specimens for TEM observation were prepared by dispersing the material powder into ethanol by ultrasonic treatment. The surface chemical properties were determined by X-ray photoelectron spectrometer (XPS; Escalab 250, Thermo Fisher Scientific, Waltham, Massachusetts). The molecular structure and composition of the products were analysed by KBr method on a Fourier Transform Infrared (FT-IR) spectrometer (Nicolet 5700, Thermo Company, America). The electrochemical performance of the electrode materials was characterized on a CHI660C (Chenhua Instruments Co. Ltd. Shanghai, China) electro-chemical workstation.Electrochemical measurement
The electrochemical performance of the obtained electrode materials were characterized by cyclic voltammetry (CV), galvanostatic charge–discharge (GCD) and electrochemical impedance spectroscopy (EIS). Working electrode was prepared by mixing electroactive materials SnS2/NRGO/PANI-α and PTFE (polytetrafluoro-ethylene) in a mass ratio of 95:5 to form homogeneous slurry. After it was dried at 60 °C for 10 h, pressing 2 mg of the mixed materials onto nickel foam under 15 MPa. In a three-electrode system, the electrochemical tests of the individual electrode were performed by using 6 M KOH as electrolyte, in which a platinum foil electrode and a saturated calomel electrode (SCE) were used as counter electrode and reference electrode, respectively. And the potential window from −0.2 to 0.5 V versus SCE reference electrode was applied to the electrochemical measurements.
The corresponding specific capacitance (Cm in F g−1), energy density (E in W h kg−1), and power density (P in W kg−1) were calculated from the galvanostatic discharge process based on the following equation:
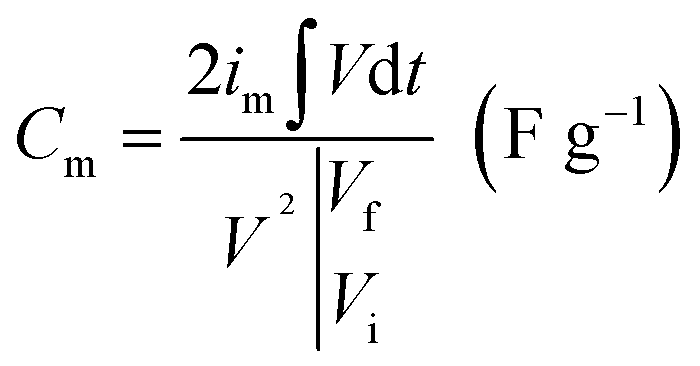 | (1) |
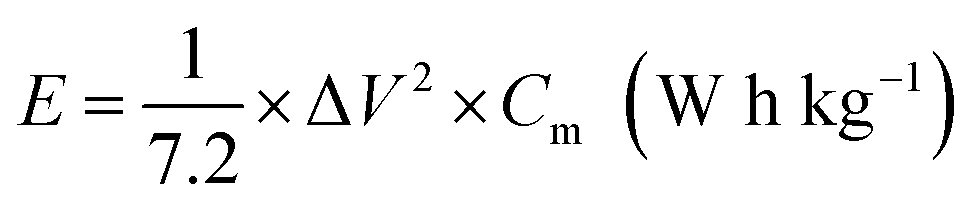 | (2) |
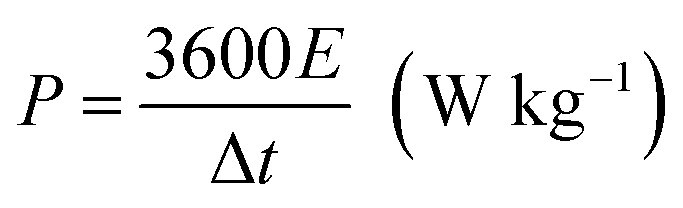 | (3) |
Results and discussion
The XRD patterns of the as-prepared SnS2/NRGO/PANI-60 nanocomposite, SnS2/NRGO and PANI are shown in Fig. 1a. The XRD patterns of the SnS2/NRGO and SnS2/NRGO/PANI-60 have a wide peak centered at 2θ = 26°, corresponding to the characteristic peak of the nitrogen-doped reduced grapheme oxide (NRGO) and no characteristic peak of graphene oxide (GO) at 2θ = 10° is observed.33,34 It displays that the GO has been reduced and NRGO has also been synthesized. In the XRD patterns, all the diffraction peaks can be indexed to SnS2 phase with the refined lattice parameters of a = 3.649 Å, b = 3.649 Å, c = 5.899 Å, are in good consistence with previously reported hexagonal SnS2 (JCPDS no. 023-0677), a layered transition metal disulfide, where the tin atoms are sandwiched between layers of hexagonally close packed sulfur atoms.35 It can be seen that the SnS2 exhibits obvious diffraction peaks at 2θ = 15.0°, 28.2° and 32.1°, corresponding to the (001), (100) and (101) diffraction planes, respectively. For pure PANI sample, three crystalline peaks at 2θ = 15.1°, 20.5° and 25.5°, corresponding to (011), (020) and (200) planes of PANI are observed, suggesting that PANI are existed in emeraldine salt form.36 For the SnS2/NRGO/PANI-60 hybrid material, the characteristic X-ray diffraction peaks of hexagonal SnS2 are similar to that of SnS2/NRGO sample, especially its diffraction peaks (marked with black diamond) are corresponding to the three main intensity peaks of SnS2. In addition, the intensity of the diffraction peaks is lower than those of SnS2/NRGO and pure PANI, suggesting a homogeneous combination between SnS2/NRGO and PANI throughout the whole ternary composite. The other peaks not obvious in the diffraction peaks of SnS2/NRGO/PANI-60 hybrid material are attributed to the mutual interference between different components, which weakens the intensity of those characteristic peaks. Moreover, the weak diffraction peak around 20.5° for PANI is observed, suggesting PANI is existed in a semicrystalline state in the hybrid material.37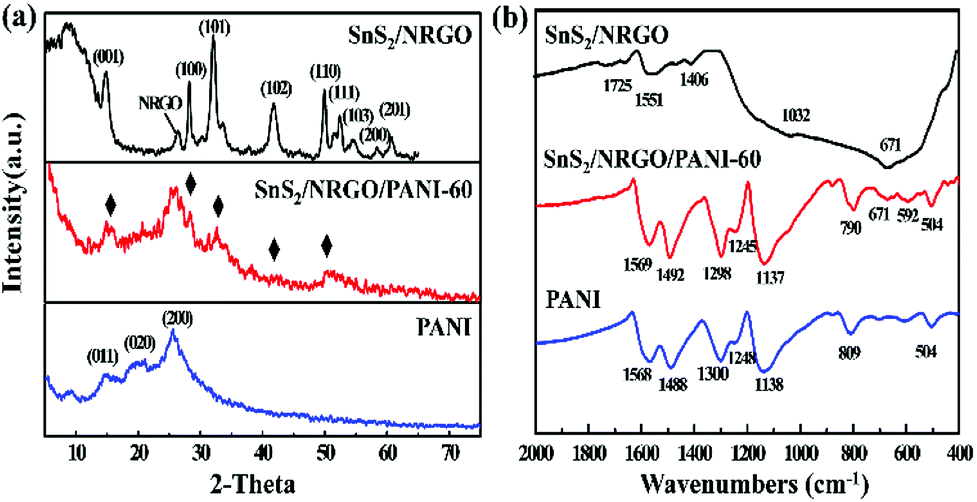 | ||
| Fig. 1 XRD patterns (a) and FT-IR spectra (b) of PANI, SnS2/NRGO and SnS2/NRGO/PANI-60. | ||
The structure and component of SnS2/NRGO/PANI-60 hybrid material is further investigated by FT-IR analysis (Fig. 1b). In the spectrum of SnS2/NRGO, the bands above 671, 1032 and 1725 cm−1 are contributed to the S–O stretching mode, S![[double bond, length as m-dash]](https://www.rsc.org/images/entities/char_e001.gif) O symmetrical stretching mode and CS stretching mode, respectively, which derived from the interaction between sulfur atoms in SnS2 and NRGO.38 For the SnS2/NRGO/PANI-60, the characteristic bands of PANI and SnS2/NRGO can be detected, but their position and intensity are changed obviously. The characteristic peaks of CC stretching mode for the quinoid and benzenoid rings corresponding to 1568 and 1488 cm−1 are transferred to 1569 and 1492 cm−1 in SnS2/NRGO/PANI-60 hybrid material, indicating the oxidized state of the emeraldine salt of PANI.39 The bands at 1295 and 1245 cm−1 are caused by the C–N stretching mode for the benzenoid rings. In addition, the bands at 1137, 790 and 504 cm−1 corresponding to the in-plane bending vibration, out-plane bending vibration and deformation vibration of C–H, respectively. Because the vibration of C–H mode can influence the conductivity and the degree of electron delocalization of PANI, the strong bands intensity suggests the better conductivity and the degree of electron delocalization of PANI. Moreover, the position of C–H bending vibration changes obviously from 1138 and 809 cm−1 of pure PANI to 1137 and 790 cm−1 of SnS2/NRGO/PANI-60 hybrid material because of the synergetic effect between PANI and SnS2/NRGO.40
O symmetrical stretching mode and CS stretching mode, respectively, which derived from the interaction between sulfur atoms in SnS2 and NRGO.38 For the SnS2/NRGO/PANI-60, the characteristic bands of PANI and SnS2/NRGO can be detected, but their position and intensity are changed obviously. The characteristic peaks of CC stretching mode for the quinoid and benzenoid rings corresponding to 1568 and 1488 cm−1 are transferred to 1569 and 1492 cm−1 in SnS2/NRGO/PANI-60 hybrid material, indicating the oxidized state of the emeraldine salt of PANI.39 The bands at 1295 and 1245 cm−1 are caused by the C–N stretching mode for the benzenoid rings. In addition, the bands at 1137, 790 and 504 cm−1 corresponding to the in-plane bending vibration, out-plane bending vibration and deformation vibration of C–H, respectively. Because the vibration of C–H mode can influence the conductivity and the degree of electron delocalization of PANI, the strong bands intensity suggests the better conductivity and the degree of electron delocalization of PANI. Moreover, the position of C–H bending vibration changes obviously from 1138 and 809 cm−1 of pure PANI to 1137 and 790 cm−1 of SnS2/NRGO/PANI-60 hybrid material because of the synergetic effect between PANI and SnS2/NRGO.40
The morphologies of SnS2/NRGO and SnS2/NRGO/PANI-α (α = 20, 40, 60, 80) are investigated by scanning electron microscopy (SEM) and transmission electron microscopy (TEM), which are displayed in Fig. 2. The SEM of SnS2/NRGO shows that tin disulfide (SnS2) are in the shape of flower which are consisted by SnS2 nanosheets as seen in Fig. 2a. Moreover, the NRGO nanosheets are gauzy and evenly wrinkled and partial SnS2 are wrapped up by the NRGO nanosheets (Fig. 2a). When 20% of PANI are doped, SnS2 nanosheets consisted SnS2 flower becomes thicker and NRGO becomes opaque as seen in Fig. 2b. As the mass percentage of PANI increases, the surface morphologies of the nanocomposites have changed a lot. As shown in Fig. 2c, numerous short PANI nanorods appeared on the surface of SnS2/NRGO nanosheets when the mass percentage of PANI is up to 40%. When the doping percentage further increases to 60%, the length of the PANI nanorods further increased and the PANI nanorods completely distributed on the surface of SnS2/NRGO nanosheets as seen in Fig. 2d. When the doping percentage is up to 80% as shown in Fig. 2e, dense and long PANI nanofibers formed, which wrapped on the surface of SnS2/NRGO nanosheets. The TEM image of SnS2/NRGO/PANI-60 hybrid material depicts that an spacing of 0.56 nm can be attributed to the d(001) plane of SnS2 and the organic polymer of PANI nanofibers are also observed on the surface of NRGO nanosheets (Fig. 2f). From the high resolution TEM images, the existing d(001) plane is consistent with the XRD pattern of SnS2/NRGO/PANI-60, which further verifies that SnS2 exists in the surface of NRGO and PANI. The synthetic process and growth mechanism of SnS2/NRGO/PANI ternary composite is also shown in Scheme 1.
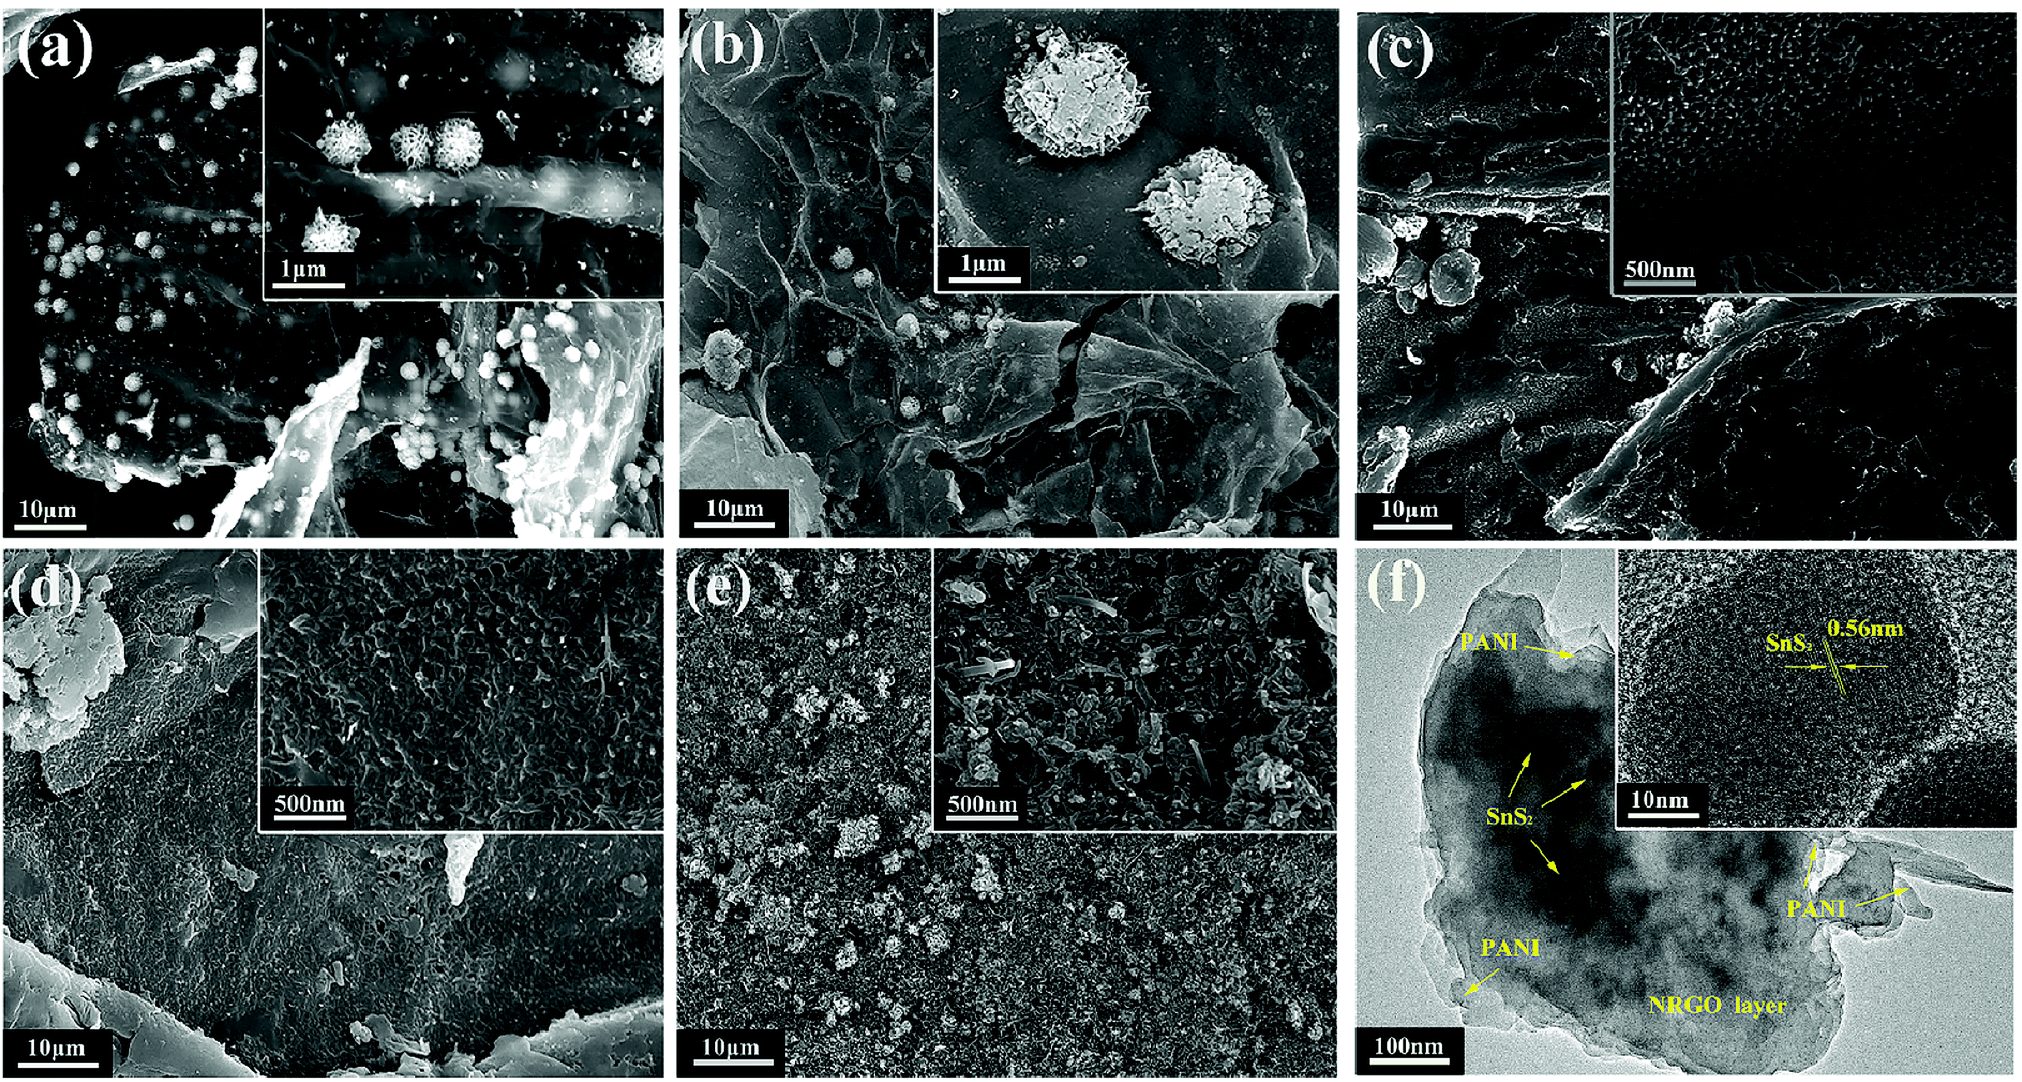 | ||
| Fig. 2 SEM images of (a) SnS2/NRGO, (b) SnS2/NRGO/PANI-20, (c) SnS2/NRGO/PANI-40, (d) SnS2/NRGO/PANI-60, (e) SnS2/NRGO/PANI-80 and TEM images of (f) SnS2/NRGO/PANI-60. | ||
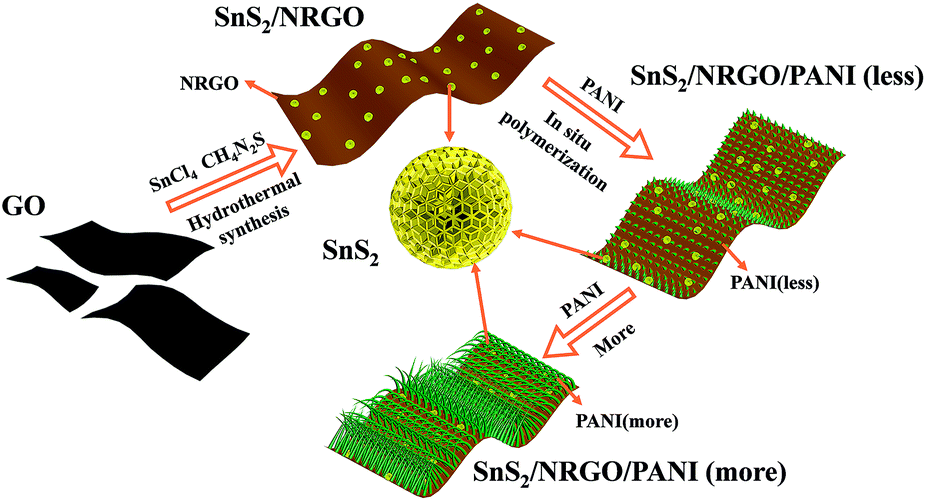 | ||
| Scheme 1 The synthetic process of SnS2/NRGO/PANI composite. | ||
The surface bonding of the SnS2/NRGO/PANI-60 can be further demonstrated by XPS analysis and the spectra are displayed in Fig. 3. The XPS spectrum (Fig. 3a) of the SnS2/NRGO/PANI-60 shows distinct peaks at 164.0 (S 2p), 285.0 (C 1s), 398.4 (N 1s), 487.3 (Sn 3d) and 531.8 (O 1s) eV, simultaneously, the distinct peaks at 24.0 (Sn 4d) and 756.2 (Sn 3p1) eV of the SnS2/NRGO are also exhibited in the XPS spectrum.41 In the survey spectra of SnS2/NRGO/PANI-60, the binding energy intensities of C 1s and N 1s are significantly increased and the binding energy intensities of Sn 3d, Sn 3p1 and Sn 4d are weakened or disappeared, compared with the survey spectra of SnS2/NRGO, indicating that the PANI is loaded on the surface of SnS2/NRGO successfully and it is consistent with the results of XRD and FT-IR. The C 1s spectrum (Fig. 3b) of the SnS2/NRGO/PANI-60 can be categorized into five main peaks located respectively at 284.5 (CC, the graphitic carbon), 285.0 (C–H), 285.4 (C–N), 286.2 (C–O) and 287.8 (CO) eV, and the relatively recorded small peaks at 286.2 and 287.8 eV suggest that GO has been reduced.42 The N 1s spectrum (Fig. 3c) shows four deconvoluted contributions at 398.6 (pyridinic N), 399.5 (graphitic N), 400.2 (pyrrolic N) and 401.2 (Sn–N, interaction between SnS2 and N atom of PANI).42 The O 1s spectrum (Fig. 3d) might be divided into five separate signals: 531.0 (O–Sn, interaction between Sn4+ and O atom of NRGO), 531.8 (OC), 532.6 (O–C), 533.3 (OC–O) and 534.0 (OS) eV, corresponding to oxygen species in the SnS2/NRGO/PANI-60 ternary composite.42 In the Sn 3d spectra (Fig. 3e), the 487.3 and 495.6 eV peaks are assigned to Sn 3d5/2 and Sn 3d3/2, respectively, which corresponds to Sn4+. Additionally, the S 2p spectrum (Fig. 3f) has four binding energy peaks at 163.8 (S 2p1/2), 168.0 (S 2p3/2), 168.8 (SO) and 169.8 (SC) eV, corresponding to the several combinations of sulfur element on the surface of SnS2/NRGO/PANI-60, where the peak of S 2p3/2 has the largest peak area, indicating that the main surface combination of sulfur element is S2−.41 In summary, the binding energy of C, N and S elements in XPS spectra, such as 168.8 (SO), 169.8 (CS), 285.0 (C–H) and 285.4 (C–N) eV, which are consistent with the typical peaks at 1032, 1725, 1137 and 1245 cm−1 in FT-IR pattern, respectively.
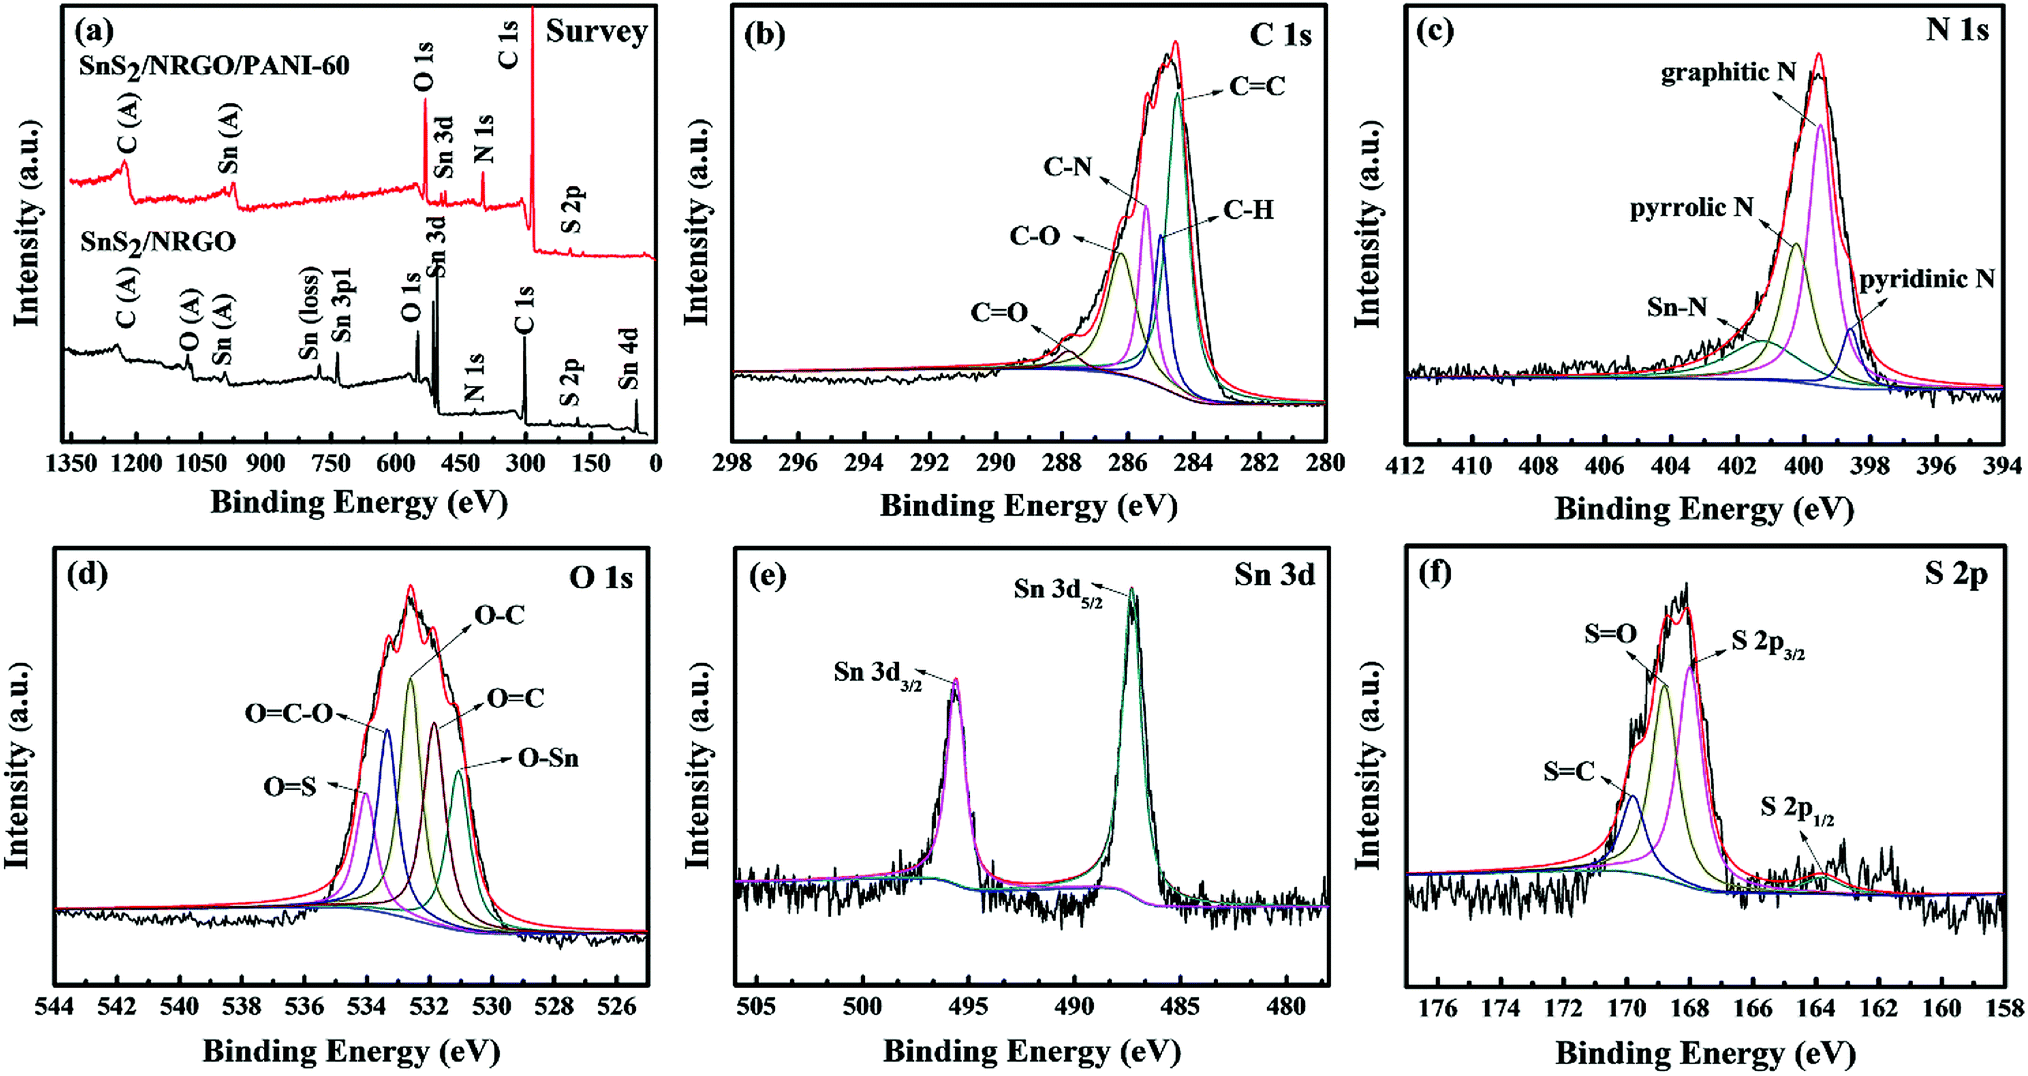 | ||
| Fig. 3 Deconvoluted XPS spectra: (a) survey spectra of SnS2/NRGO/PANI-60 and SnS2/NRGO nanohybrids; high-resolution XPS spectra of SnS2/NRGO/PANI-60: (b) C 1s, (c) N 1s, (d) O 1s, (e) Sn 3d and (f) S 2p. | ||
The electrochemical properties of the precursor SnS2/NRGO, PANI and the ternary composites SnS2/NRGO/PANI with different amounts of PANI are explored by cyclic voltammetry (CV) and galvanostatic charge–discharge (GCD) tests with a three electrode system in 6 M KOH electrolyte. At a scan rate of 5 mV s−1, the CV curves of SnS2/NRGO, PANI and SnS2/NRGO/PANI with different amounts of PANI electrodes are shown in Fig. 4a. The CV profile of SnS2/NRGO within the potential window of −0.2–0.5 V has two characteristic peaks above 0.25 and 0.35 V, respectively corresponding to reduction and oxidation process.23,33 And the oxidation peaks of SnS2/NRGO have two peaks corresponding to 0.35 and 0.4 V. For PANI electrode, a pair of distinct redox peaks around at 0.26 and 0.32 V corresponding to the typical pseudocapacitive features, which is ascribed to the transformation between the leucoemeraldine base (LB) and emeraldine salt (ES) states of PANI.40 In the CV curves of SnS2/NRGO/PANI ternary composites, a pair of evident redox peaks for a series of SnS2/NRGO/PANI with different amounts of PANI can be observed at about 0.25 and 0.35 V, which is similar with the faradaic capacitance of PANI and SnS2/NRGO electrodes. However the peak-intensity of SnS2/NRGO/PANI is more than it of PANI and SnS2/NRGO, which is ascribed to the interaction of the conjugated π bonds between PANI nanofibers and NRGO nanosheets. In addition, the CV curves of SnS2/NRGO/PANI-80 partly overlaps with the faradaic capacitance of PANI, because in SnS2/NRGO/PANI-80 ternary composites PANI nanofiber predominate and the π–π conjugate bonds between PANI nanofibers weakens the interaction force between PANI nanofibers and NRGO nanosheets. On the other hand, a pair of redox peaks has changed significantly for SnS2/NRGO/PANI hybrid electrodes with different amounts of PANI suggesting a contribution of pseudocapacitance from surface redox reaction between PANI nanofibers and KOH electrolyte. In the CV curves, the redox peak at −0.05 V is ascribed to the weaken oxidation from the secondary oxidation between surface of electrode and hydroxide ion in KOH electrolyte.43 Moreover, the integration areas of CV profiles for SnS2/NRGO/PANI hybrid electrodes are larger than that of SnS2/NRGO, indicating a synergistic effect between PANI and SnS2/NRGO. Through comparison, SnS2/NRGO/PANI-60 hybrid electrode has the strongest potential peaks and the largest CV curve area, suggesting that only a moderate amount of PANI doping can improve the capacitance performance of SnS2/NRGO, which may due to that the appropriate loading of PANI nanofibers can offer more active sites for redox charge transfer. The same trend can be observed by comparison of GCD curves for all of the samples at a current density of 1 A g−1 (Fig. 4b). The GCD curves have redox peaks at specified potential, which is corresponding to the combination of the redox characteristics of SnS2/NRGO and PANI. As shown in Fig. 4b, the specific capacitance of SnS2/NRGO/PANI hybrid electrodes gradually increases from 887 F g−1 to 1021.67 F g−1 in company with the amount of PANI increases from 20% to 60%. However, the specific capacitance for SnS2/NRGO/PANI hybrid electrodes decreases slightly when the amounts of PANI achieves 80%, which may be ascribed to the random aggregation of PANI nanofibers on the surface of SnS2/NRGO nanosheets.
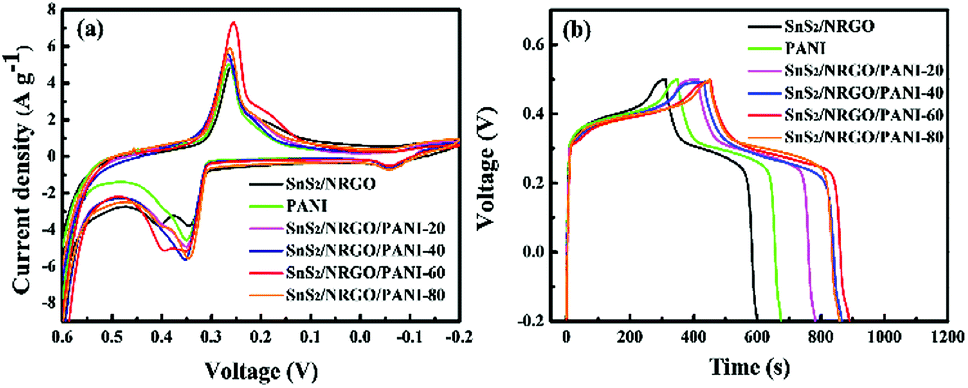 | ||
| Fig. 4 CV profiles at 5 mV s−1 (a) and galvanostatic charge–discharge curves at 1 A g−1 (b) of SnS2/NRGO, PANI, and SnS2/NRGO/PANI with different amounts of PANI electrodes in 6 M KOH electrolyte. | ||
The electrochemical properties of SnS2/NRGO/PANI-60 hybrid electrode are further investigated as seen in Fig. 5. As it can be seen from Fig. 5a that the specific capacitance of SnS2/NRGO/PANI-60 hybrid electrode decreases from 1081.2 to 772.39 F g−1 as the current density increases from 0.3 to 20 A g−1, which is much larger than that of SnS2/NRGO electrode (from 838.7 to 481 F g−1) and pure PANI electrode (from 948 to 592 F g−1). From the capacitance retention graphic, the specific capacitance of SnS2/NRGO/PANI-60 is up to 1021.67 F g−1 at current density of 1 A g−1, which is better than that of the pristine SnS2 (215.9 F g−1 at 0.38 A g−1),44 the binary composites of GO/PANI (425 F g−1 at 0.2 A g−1),40 SnS2/NRGO (562 F g−1 at 0.2 A g−1)23 and the ternary complexes of GO/PANI/Co3O4 (789.7 F g−1 at 1 A g−1).28 Meanwhile, the capacitance retention at current densities from 1 to 20 A g−1 of SnS2/NRGO/PANI-60 is up to 71.4%, which is better than that of SnS2/NRGO (57.5%) and pure PANI (62.5%). Moreover, the rate performance of SnS2/NRGO/PANI-60 composite material is also better than that of other PANI electrode materials such as MnO2/PANI nanofiber (capacitance retention is 35%),45 SnO2@PANI nanowire (capacitance retention is 37%),46 PANI/GO film (capacitance retention is 50%)40 and MoS2/PANI nanosheet (capacitance retention is 53%).47 These results indicate that the SnS2/NRGO/PANI-60 hybrid electrode possesses the excellent rate capability and desirable capacitance compared with SnS2/NRGO and pure PANI. To further explore the reason for these phenomena, the Nyquist plots of SnS2/NRGO, PANI and SnS2/NRGO/PANI-60 hybrid electrode are shown in Fig. 5b. The plots are composed by a semicircle at the higher frequency region and a straight line at the lower frequency region. In higher frequency region, the radius of semicircles corresponding to the values on the real axis determines their charge transfer resistance (Rct) and follows the order: Rct (SnS2/NRGO/PANI-60) < Rct (SnS2/NRGO) < Rct (PANI).48 According to the SEM images in Fig. 2, it is attributed that the appearance of PANI nanofibers in the SnS2/NRGO/PANI-60 composite increases the contact area of the electrode material with the electrolyte and greatly reduces the ions transfer distance between the surface of electrode and electrolyte, which facilitates the capture and conduction of electrons. In lower frequency region, the vertical degree of the straight line with the real axis represents the energy storage capacity of EDLC, so the higher vertical degree is closer to the EDLC.49 The SnS2/NRGO electrode has the smaller Rct and the PANI electrode possesses the higher EDLC, which jointly determine the smallest Rct and the better capacitance behavior of SnS2/NRGO/PANI-60 hybrid electrode. Therefore, SnS2/NRGO/PANI-60 ternary hybrid electrode not only has the conductive pathway and the favorable porosity for ion diffusion from the electrolyte to the PANI nanofibers, but also can maximize the utilization of PANI. It endows the remarkable rate performance and high capacitance behavior for SnS2/NRGO/PANI-60 ternary hybrid electrode. Fig. 5c shows the cycle performance of SnS2/NRGO/PANI-60 ternary hybrid electrode over 1000 charge–discharge cycles at current density of 10 A g−1 compared with those of SnS2/NRGO and pure PANI electrode. In comparison, the SnS2/NRGO electrode maintains a good cycle stability and its capacitance retention is up to 91% after 1000 cycles, which is much higher than the poor capacitance retention of pure PANI electrode about 65%. On the contrary, the specific capacitance of SnS2/NRGO/PANI-60 ternary hybrid electrode possesses improved cycle stability, and its capacitance retention of 82% has been obtained in comparison with pure PANI electrode after 1000 cycles. The improved cycle stability of SnS2/NRGO/PANI-60 is mainly ascribed to the binding sites between PANI and the surface of NRGO and SnS2 verified in XPS and FT-IR spectra, which limits the contraction and expansion of PANI during charge and discharge and makes up the shortcoming of pure PANI. In addition, PANI nanofiber arrays improve the space between SnS2/NRGO nanosheets, which are beneficial to the swelling and shrinking of the nanostructures during the long-term charge–discharge processes.50,51 These factors contributed to the improved cycle stability and excellent capacitance performance of SnS2/NRGO/PANI-60 ternary hybrid electrode.
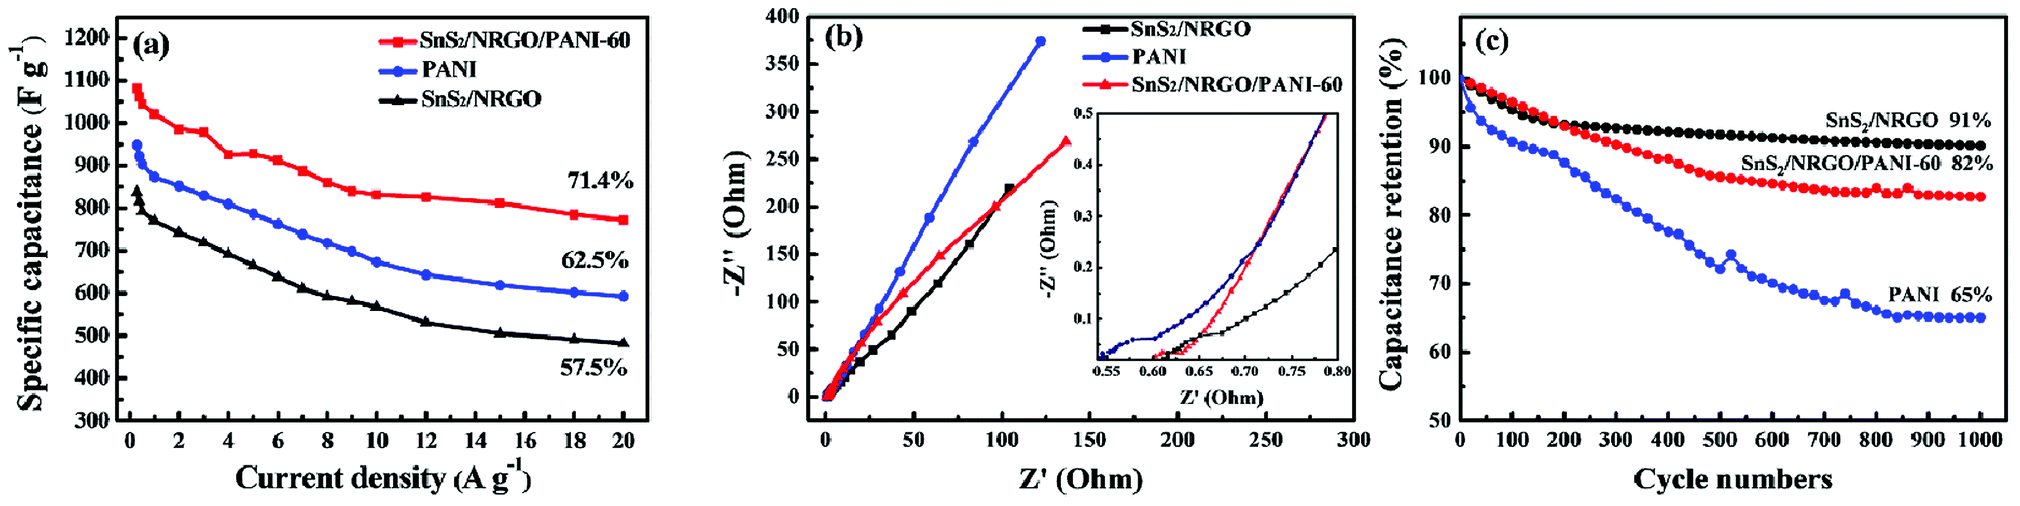 | ||
| Fig. 5 Capacitance retention (a), Nyquist plots measured at frequency range from 100 kHz to 0.01 Hz (inset, the close-up view of the high-frequency region) (b), and cycling performances at 10 A g−1 (c) of SnS2/NRGO, PANI, and SnS2/NRGO/PANI-60 hybrid electrodes in 6 M KOH electrolyte. | ||
To further investigate the reliable capacitive performance of SnS2/NRGO/PANI-60 hybrid electrode, it is employed to assemble a symmetric super capacitor (SC) with 6 M KOH as electrolyte. Fig. 6a shows the CV curves at the voltage window of −0.2–0.5 V, and the redox peaks gradually shift to both sides as the scan rates increasing, which is ascribed to the concentration polarization on the surface of SnS2/NRGO/PANI-60 hybrid electrode. Fig. 6b shows the GCD profiles of SnS2/NRGO/PANI-60 electrode at different current density from 1 to 15 A g−1. The specific capacitance, energy density and power density at a current density of 1 A g−1 for SnS2/NRGO/PANI-60 were 1021.67 F g−1, 69.53 W h kg−1 and 575.46 W kg−1, respectively. In comparison, at the current density of 10 A g−1, the specific capacitance, energy density and power density were 832.08 F g−1, 56.62 W h kg−1 and 4960 W kg−1, respectively. The reason for specific capacitance attenuation is mainly ascribed to the rate of ion migration on the surface of the electrode is slower than that of the electrolyte ions with the current density increasing. Moreover, the cycle performance of SnS2/NRGO/PANI-60 based symmetric SC is investigated by a consecutive charge–discharge technique at a current density of 10 A g−1 as shown in Fig. 6c. The experimental results show that the specific capacitance has an obvious decay at the first 1000 cycles, while no obvious delay has been observed since 3000 cycles and 78% of its initial capacitance is remained during the following 3000–6000 cycles. The 78% capacitance retention of SnS2/NRGO/PANI-60 is better than those supercapacitors based on PANI, such as PANI/GO nanocomposite film (72% after 500 cycles),40 MoO2/PANI nanotube (74% after 2000 cycles),45 SnO2@PANI nanowire (60% after 500 cycles)46 and SnS2@PANI nanosheet (75.4% after 80 cycles).52 The GCD curves of the above characteristic cycle number at a current density of 10 A g−1 are shown in Fig. 6d. As seen in Fig. 6d, there is no obvious IR drop during the different cycling stages and it is coincide with the specific capacitance change trend of Fig. 6c. Therefore the flower-like SnS2/NRGO nanosheets provides a good and favorable method for improving the capacitance retention of PANI electrode.
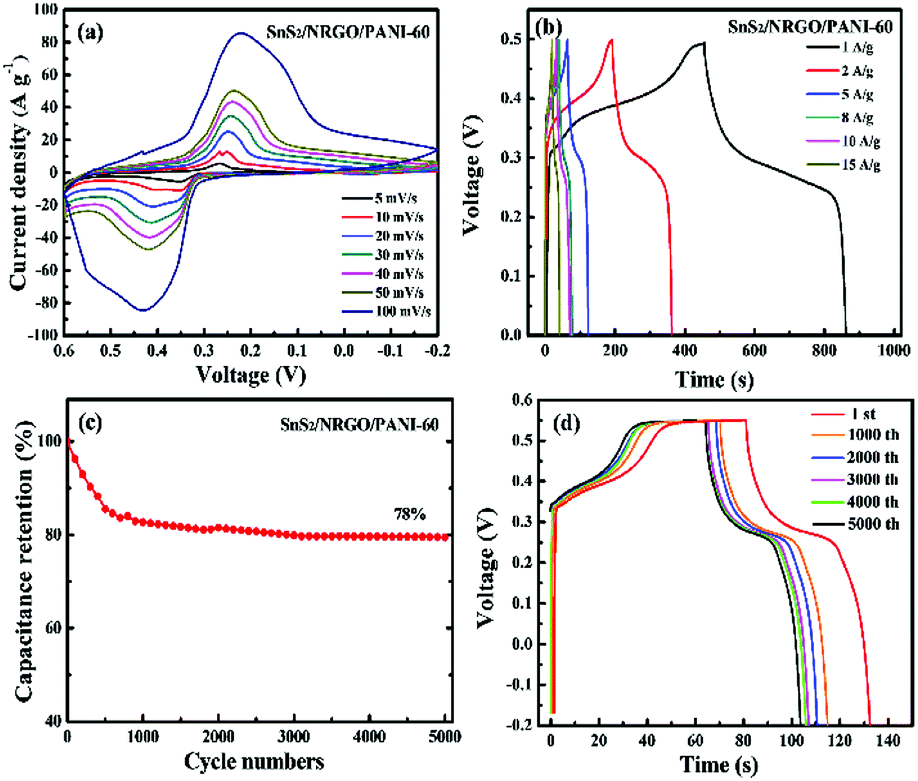 | ||
| Fig. 6 Capacitive performances of SnS2/NRGO/PANI-60 based symmetric supercapacitor in 6 M KOH electrolyte: (a) CV profiles at different scan rates, (b) galvanostatic charge–discharge curves from 1 to 15 A g−1, (c) cycling performance at 10 A g−1, and (d) galvanostatic charge–discharge curves at 1st, 1000th, 2000th, 3000th, 4000th and 5000th cycles. | ||
Conclusions
Tin disulfide/nitrogen-doped reduced graphene oxide/polyaniline ternary composites was synthesized by in situ polymerization of aniline monomers to PANI nanofiber arrays on the surface of SnS2/NRGO binary composite. The variations of the amounts of PANI can influence the morphologies, capacitance performance and cycle stability of the prepared composites. It is found that the composite with 60 wt% PANI possesses excellent capacitance performance and good cycle stability. The specific capacitance, energy density and power density at a current density of 1 A g−1 for SnS2/NRGO/PANI-60 were 1021.67 F g−1, 69.53 W h kg−1 and 575.46 W kg−1, respectively. It is attributed that PANI nanofibers facilitate the capture and conduction of electrons. After 5000 galvanostatic charge–discharge cycles at a current density of 10 A g−1, 78% of the specific capacitance can be maintained. It is ascribed to the binding sites between PANI and the surface of NRGO and SnS2 limit the contraction and expansion of PANI during charge and discharge. The excellent electrochemical performance of SnS2/NRGO/PANI-60 hybrid electrode is mainly ascribed to the surface interaction between PANI nanofiber arrays and SnS2/NRGO nanosheets, while PANI nanofiber arrays plays an important role in ion transport and storage, as well as withstands the volume change on cycling, which makes this type of materials has remarkable rate performance and high capacitance behavior. Therefore, the typical method of doping PANI nanofibers is useful to improve the practical capacitance and cycling stability of other conducting polymers as promising supercapacitor electrode materials.Conflicts of interest
There are no conflicts to declare.Acknowledgements
This work was supported by the National Natural Science Foundation of China (No. 21403130, 21403129, 21576159), the Natural Science Foundation of Shandong Province (ZR2014BQ028, 2015ZRB01765).Notes and references
- C. Wu, X. Lu, L. Peng, K. Xu, X. Peng, J. Huang, G. Yu and Y. Xie, Nat. Commun., 2013, 4, 2431–2437 CrossRef PubMed.
- X. He, P. Ling, J. Qiu, M. Yu, X. Zhang, C. Yu and M. Zheng, J. Power Sources, 2013, 240, 109–113 CrossRef CAS.
- M.-T. Lee, Y.-S. Li, I. W. Sun and J.-K. Chang, J. Power Sources, 2014, 246, 269–276 CrossRef CAS.
- B. Fang, H. Zhou and I. Honma, J. Phys. Chem. B, 2006, 110, 4875–4880 CrossRef CAS PubMed.
- P. Cao, J. Peng, J. Li and M. Zhai, J. Power Sources, 2017, 347, 210–219 CrossRef CAS.
- Y.-S. Sun, C.-F. Lin and S.-T. Luo, J. Phys. Chem. C, 2017, 121, 14795–14802 CrossRef CAS.
- K.-S. Kim and S.-J. Park, J. Power Sources, 2013, 244, 792–798 CrossRef CAS.
- P. B. Pawar, S. Shukla and S. Saxena, J. Power Sources, 2016, 321, 102–105 CrossRef CAS.
- R. Liu, J. Duay and S. B. Lee, ACS Nano, 2010, 4, 4299–4307 CrossRef CAS PubMed.
- X. Chen, H. Zhu, Y. C. Chen, Y. Shang, A. Cao, L. Hu and G. W. Rubloff, ACS Nano, 2012, 6, 7948–7955 CrossRef CAS PubMed.
- R. Zhao, L. Zhang, C. Wang and L. Yin, J. Power Sources, 2017, 353, 77–84 CrossRef CAS.
- Y. Wei, S. Chen, D. Su, B. Sun, J. Zhu and G. Wang, J. Mater. Chem. A, 2014, 2, 8103–8109 RSC.
- X. Lim, Y. Zhu, F. C. Cheong, N. M. Hanafiah, S. Valiyaveettil and C.-H. Sow, ACS Nano, 2008, 2, 1389–1395 CrossRef CAS.
- Y. Yamauchi, M. Yoshizawa and M. Fujita, J. Am. Chem. Soc., 2008, 130, 5832–5833 CrossRef CAS PubMed.
- Y. Zhai, J. Zhai, Y. Wang, S. Guo, W. Ren and S. Dong, J. Phys. Chem. C, 2009, 113, 7009–7014 CrossRef CAS.
- X. Tan, W. Zhao and T. Mu, Green Chem., 2018, 20, 3625–3633 RSC.
- A. R. Abdel Hamid, R. Mhanna, P. Catrou, Y. Bulteau, R. Lefort and D. Morineau, J. Phys. Chem. C, 2016, 120, 11049–11053 CrossRef CAS.
- Y. Li, D. Cao, Y. Wang, S. Yang, D. Zhang, K. Ye, K. Cheng, J. Yin, G. Wang and Y. Xu, J. Power Sources, 2015, 279, 138–145 CrossRef CAS.
- X. Jiang, X. Yang, Y. Zhu, J. Shen, K. Fan and C. Li, J. Power Sources, 2013, 237, 178–186 CrossRef CAS.
- T. Zhou, W. K. Pang, C. Zhang, J. Yang, Z. Chen, H. K. Liu and Z. Guo, ACS Nano, 2014, 8, 8323–8333 CrossRef CAS PubMed.
- K. C. Christoforidis, A. Sengele, V. Keller and N. Keller, ACS Appl. Mater. Interfaces, 2015, 7, 19324–19334 CrossRef CAS PubMed.
- M. Liu, J. Yang, Q. Qu, P. Zhu and W. Li, J. Power Sources, 2015, 273, 848–856 CrossRef CAS.
- D. H. Youn, S. K. Stauffer, P. Xiao, H. Park, Y. Nam, A. Dolocan, G. Henkelman, A. Heller and C. B. Mullins, ACS Nano, 2016, 10, 10778–10788 CrossRef CAS PubMed.
- K. Chang, Z. Wang, G. Huang, H. Li, W. Chen and J. Y. Lee, J. Power Sources, 2012, 201, 259–266 CrossRef CAS.
- X. Bian, X. Lu, Y. Xue, C. Zhang, L. Kong and C. Wang, J. Colloid Interface Sci., 2013, 406, 37–43 CrossRef CAS PubMed.
- K. Mohanraju, V. Sreejith, R. Ananth and L. Cindrella, J. Power Sources, 2015, 284, 383–391 CrossRef CAS.
- A. Petrovski, P. Paunović, R. Avolio, M. E. Errico, M. Cocca, G. Gentile, A. Grozdanov, M. Avella, J. Barton and A. Dimitrov, Mater. Chem. Phys., 2017, 185, 83–90 CrossRef CAS.
- H. Wang, Z. Guo, S. Yao, Z. Li and W. Zhang, Int. J. Electrochem. Sci., 2017, 12, 3721–3731 CrossRef CAS.
- C. Pan, H. Gu and L. Dong, J. Power Sources, 2016, 303, 175–181 CrossRef CAS.
- S. Zhu, M. Wu, M.-H. Ge, H. Zhang, S.-K. Li and C.-H. Li, J. Power Sources, 2016, 306, 593–601 CrossRef CAS.
- P. Xiong, H. Huang and X. Wang, J. Power Sources, 2014, 245, 937–946 CrossRef CAS.
- W. S. Hummers and R. E. Offeman, J. Am. Chem. Soc., 1958, 80, 1339 CrossRef CAS.
- D. Long, W. Li, L. Ling, J. Miyawaki, I. Mochida and S.-H. Yoon, Langmuir, 2010, 26, 16096–16102 CrossRef CAS PubMed.
- Z. Lin, G. Waller, Y. Liu, M. Liu and C.-P. Wong, Adv. Energy Mater., 2012, 2, 884–888 CrossRef CAS.
- J.-w. Seo, J.-t. Jang, S.-w. Park, C. Kim, B. Park and J. Cheon, Adv. Mater., 2008, 20, 4269–4273 CrossRef CAS.
- W. Wu, Y. Li, G. Zhao, L. Yang and D. Pan, J. Mater. Chem. A, 2014, 2, 18058–18069 RSC.
- K. Wang, X. Zhang, C. Li, H. Zhang, X. Sun, N. Xu and Y. Ma, J. Mater. Chem. A, 2014, 2, 19726–19732 RSC.
- D. G. Clerc and D. A. Cleary, Chem. Mater., 1992, 4, 1344–1348 CrossRef CAS.
- J. Zhang, J. Wang, J. Yang, Y. Wang and M. B. Chan-Park, ACS Sustainable Chem. Eng., 2014, 2, 2291–2296 CrossRef CAS.
- G. Xu, N. Wang, J. Wei, L. Lv, J. Zhang, Z. Chen and Q. Xu, Ind. Eng. Chem. Res., 2012, 51, 14390–14398 CrossRef CAS.
- Y. Zhang, P. Zhu, L. Huang, J. Xie, S. Zhang, G. Cao and X. Zhao, Adv. Funct. Mater., 2015, 25, 481–489 CrossRef CAS.
- C. Sha, B. Lu, H. Mao, J. Cheng, X. Pan, J. Lu and Z. Ye, Carbon, 2016, 99, 26–34 CrossRef CAS.
- Q. Hao, X. Xia, W. Lei, W. Wang and J. Qiu, Carbon, 2015, 81, 552–563 CrossRef CAS.
- R. K. Mishra, G. W. Baek, K. Kim, H.-I. Kwon and S. H. Jin, Appl. Surf. Sci., 2017, 425, 923–931 CrossRef CAS.
- H. Jiang, J. Ma and C. Li, J. Mater. Chem., 2012, 22, 16939–16942 RSC.
- L. Wang, L. Chen, B. Yan, C. Wang, F. Zhu, X. Jiang, Y. Chao and G. Yang, J. Mater. Chem. A, 2014, 2, 8334–8341 RSC.
- L. Ren, G. Zhang, Z. Yan, L. Kang, H. Xu, F. Shi, Z. Lei and Z. H. Liu, ACS Appl. Mater. Interfaces, 2015, 7, 28294–28302 CrossRef CAS PubMed.
- J. Wang, C. Luo, J. Mao, Y. Zhu, X. Fan, T. Gao, A. C. Mignerey and C. Wang, ACS Appl. Mater. Interfaces, 2015, 7, 11476–11481 CrossRef CAS PubMed.
- P. Sharma and T. S. Bhatti, Energy Convers. Manage., 2010, 51, 2901–2912 CrossRef CAS.
- J. Luo, W. Zhong, Y. Zou, C. Xiong and W. Yang, J. Power Sources, 2016, 319, 73–81 CrossRef CAS.
- F. Zhang, T. Ding, Y. Zhang, Z. Yang and H. Xue, Mater. Lett., 2017, 192, 149–152 CrossRef CAS.
- G. Wang, J. Peng, L. Zhang, J. Zhang, B. Dai, M. Zhu, L. Xia and F. Yu, J. Mater. Chem. A, 2015, 3, 3659–3666 RSC.
| This journal is © The Royal Society of Chemistry 2018 |