 Open Access Article
Application of a novel Mass Bio System to remove low-concentration ammonia nitrogen from water bodies
Salma Tabassum *
*
Chemistry Department, Faculty of Science, Taibah University, Yanbu Branch, 46423, Yanbu, Saudi Arabia. E-mail: salmazenith@gmail.com; stabassum@taibahu.edu.sa
First published on 19th December 2018
Abstract
Water pollution due to ammonia is one of the most serious problems faced by the human beings and other life forms worldwide. With the rapid development of economy, pollution of water resources by ammonium (NH4+) pollutants has increased severely. The water supply system has exceeded its capacity with regard to both quantity and quality of water. Many countries have already established a standard for strict limitation of ammonium nitrogen (NH4+-N) or NH3 content in drinking water. In this study, a novel Mass Bio System (MBS), a suspended biologically activated carbon granular carrier cubic particle with 2–5 mm side length and a specific gravity of 1.02–1.08, was used for water treatment. In order to find a suitable method for ammonium removal from water resources, synthetic water containing NH4+-N at a concentration of about 10 ppm was treated by MBS. NH4+-N was nitrified to nitrate nitrogen (NO3−-N) by MBS in an inner-circulated fluidized bed reactor continuously. MBS showed an efficient and stable NH4+-N nitrifying performance at temperature of 20–30 °C and DO of 3–4 mg L−1. With an influent concentration of NH4+-N at 10–15 mg L−1, the concentration of effluent NH4+-N and nitrite nitrogen (NO2−-N) was below 0.25 mg L−1, showing an average removal efficiency of above 90% within a hydraulic retention time (HRT) of 30 min. The pH value of effluent water remained at 7.2–7.3 automatically. Removal of load could reach 256.1 mg-N per (L-pellet h) and oxygen uptake rate increased to 1170.9 mg-O2 per (L-pellet h). The nitrifying process fits to zero-order degradation kinetics. High biomass retention was observed by scanning electron microscopy (SEM).
1. Introduction
The most endangered ecosystem in the world at present is the freshwater ecosystem. Fresh water only accounts for less than 0.01% of the world's water resources and about 0.8% of the Earth's surface.1,2 Humans have very limited freshwater resources, and four billion people face severe water scarcity worldwide.3 Evolving industrialization and social and economic development worldwide have led to increased pollution in water resources.4Due to the lack of knowledge, a large number of water resources are becoming unsuitable for drinking and other purposes.5 Nitrogenous compounds are among such water pollutants. Nitrogen, in its various forms,6 can cause deterioration of aquatic ecosystems,7–10 eutrophication11 and a high risk of polluting drinking water resources,10 thus exhibiting a public health hazard.
According to the EPA report,12 the effects of excess nitrogen pollutants can be seen in the form of massive dead zones in coastal areas such as those in the Gulf of Mexico and Chesapeake Bay. In the United States, poor water quality has been reported in more than 100![[thin space (1/6-em)]](https://www.rsc.org/images/entities/char_2009.gif) 000 miles of rivers and streams, close to 2.5 million acres of lakes, reservoirs and ponds, and more than 800 square miles of bays and estuaries due to pollution caused by nitrogenous compounds.
000 miles of rivers and streams, close to 2.5 million acres of lakes, reservoirs and ponds, and more than 800 square miles of bays and estuaries due to pollution caused by nitrogenous compounds.
New Zealand's Environmental Reporting Series: Environmental indicators Te taiao Aotearoa reported that the median nitrate-nitrogen, total nitrogen, and ammoniacal nitrogen concentrations were higher at sites in the urban land-cover class, compared with the sites in the pastoral, exotic forest, or native land cover classes from 2009 to 2013. Model-based estimation showed that nitrate-nitrogen, nitrogen, and ammoniacal nitrogen concentrations of 31.8%, 39.4%, and 33.6% of river length, respectively, did not meet the Australian and New Zealand Guidelines for Fresh and Marine Water Quality (ANZECC) trigger values for slightly disturbed upland ecosystems (upland and lowland).13–17
According to Environmental Protection Agency (EPA), the short-term exposure of acute ammonia criteria should be 2.9 or 5.0 mg N per L and chronic criteria should be 0.26 or 1.8 mg N per L for long-term exposure.18 Long-time exposure of lower concentration of ammonia could kill or adversely affect the aquatic life.19 The toxicity to fish depends on the period of exposure to ammonia.20 The fish showed sluggish behaviour and came to the surface of the water body for gasping air due to ammonia poisoning. The safe level of ammonia in marine environment is below 1 mg L−1.21,22
Owing to the various hazards of nitrogen pollution, it is imperative to adopt corresponding measures for nitrogen removal. Nitrogen hazards are diverse, and almost all other forms of nitrogen except molecular N2, especially ammonia and nitrate, can adversely affect human health and the environment.23
Nitrogen removal methods fall broadly into two categories: physico-chemical and biological treatment methods. Physical and chemical methods for nitrogen removal24 that have been long known include ammonia stripping and distillation,25–27 precipitation,28 ion exchange,29 chemical oxidation,30,31 and chemical reduction.32 The biological method of nitrogen removal includes conventional biological technologies and novel biological processes.33
The methods of chemical precipitation, blow-off, and adsorption are commonly used for the treatment of ammonia nitrogen wastewater at low concentrations. All methods have their own characteristics, but each has its limitations or has different levels of equipment investments, high operating costs, causes secondary pollution, and has other shortcomings.34–37 When applied to engineering practice, it is necessary to consider that the application is convenient, efficient, safe, economical and stable for the treatment of the polluted water.
Compared with the conventional processes, the embedding immobilization technology has several advantages38–40 such as enhanced degradation rate, protection of microbes against toxicity, operation stability, protection from extreme conditions and economic.41–43 A considerable number of previous studies on immobilized microbial technology are directed towards the treatment of high-concentration ammonia-nitrogen wastewater or wastewater containing toxic and harmful compounds.44 However, with the continuous increase in the ammonia nitrogen concentration in surface water bodies and drinking water, the problem of low-concentration ammonia nitrogen has attracted considerable attention worldwide. Even if the concentration of ammonia nitrogen in the water supply network is very low, it will bring a series of problems such as promoting bacterial proliferation, consuming dissolved oxygen, producing odour, taste and nitrous acid, consuming chlorine to produce toxic and harmful by-products and non-ionic ammonia.
The application of Mass Bio System (MBS) technology for the removal of low-concentration ammonia nitrogen in micro-polluted source water (synthetic water) is further understood in this present study. MBS is an advanced biological water purification product. It is in the form of cubic particle consisting of microbial liquid, bamboo powder-activated carbon and waterborne polyurethane gel mixed in proper ratio.45 The MBS was prepared in our lab. The detailed description regarding the preparation of MBS can be studied in our recent work.45 The main aim of this study includes: (1) removal of ammonia nitrogen at various stages (embedding and acclimation section of MBS (phase I); improvement of the influent load and nitrogen removal capacity (phase II); and efficient and stable operation section (phase III)), (2) analysis of nitrous acid effluent from phases II and III, (3) comparison of respiration activity between acclimated and high-efficiency phases, (4) examining the pH change during the whole experiment, (5) analysis of the nitrification characteristics of MBS in a representative cycle and kinetic degradation. Finally, the microbial morphology and distribution of the MBS were further observed by scanning electron microscopy (SEM).
2. Materials and methods
2.1. Raw water quality
Synthetic wastewater with NH4+-N concentration of 10 mg L−1 (this concentration was determined for the actual groundwater micro-polluted water source in a certain place) was used. The composition of the water sample is shown in Table 1.| Test items | Concentration (mg L−1) |
|---|---|
| a When the concentration of ammonia nitrogen changes, the components can be proportioned. | |
| NH4Cl | 38.25 |
| NaHCO3 | 117 |
| Na2HPO4·12H2O | 11.6 |
| NaCl | 5.13 |
| KCl | 2.40 |
| CaCl2·2H2O | 2.40 |
| MgSO4·7H2O | 8.40 |
2.2. Process illustration and operating conditions
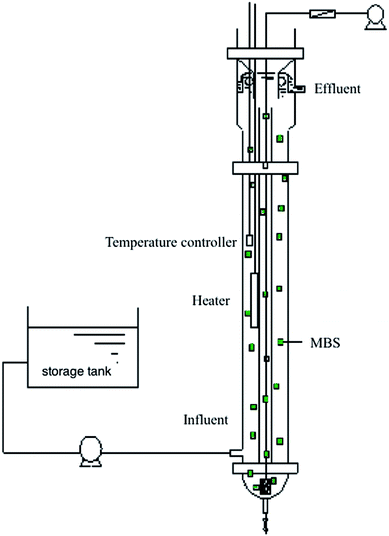
The reaction device used in this experiment was an inner-circulated fluidized bed reactor, as shown in Fig. 1. The reactor was made of plexiglass with an inner diameter of 145 mm, an effective height of 1100 mm, and an effective volume of about 18 L; MBS was added at a volume filling rate of 10%, and a built-in heater and temperature controller were also present. A microporous aeration head was arranged at the bottom of the reactor, air was supplied by a blower and the air volume was controlled by the rotameter.In the reactor, air was blown to the bottom of the inner tube of the reactor by the air pump (the volume of gas in the water was 0.08 L when aeration was applied). It provides the amount of oxygen required for the nitration reaction, and the raw water was pumped into the bottom side of the reactor. The MBS was lifted together to the top through the inner tube, and then settled to the bottom by the outer tube under the action of gravity to form an inner circulation of fluid so that the MBS filled the entire reactor, and also the matrix and the carrier were sufficiently mixed. The water body was finally separated into solid and liquid by the top sedimentation zone. During summer, the reactor can be operated at room temperature, while in winter, the heater and temperature controller are required to control the temperature at 20 to 30 °C. The dissolved oxygen concentration in the reactor was usually controlled at 3 to 4 mg L−1.
The mass velocity was fast. Once the wastewater entered the bottom of the inner-circulated fluidized bed reactor, it was quickly mixed and diluted so that the impact load resistance was strong and the volume load was high. Since the MBS is in a state of vigorous circulation in the reactor, the gas–solid–liquid interface is continuously maintained, and the mass transfer effect is good, which is beneficial for the adsorption and degradation of the pollutants by the microorganisms, and hence accelerates the biochemical reaction rate. The detailed composition about MBS can be studied from our previous research.45
2.3. Analytical methods
Ammonium nitrogen (NH4+-N) was determined by photometric determination using Nessler reagent, nitrate-nitrogen (NO3−-N) was determined by UV spectrophotometry, and nitrite-nitrogen (NO2−-N) was determined by N-(1-naphthyl)-ethylenediamine spectrophotometry. The pH measurements were performed using an electrode (Crison Instruments, S.A., 52–03) equipped with an automatic compensatory temperature device (Crison Instruments, S.A., 21-910-01) and connected to a measure instrument (pH mV−1). Microorganisms in the biomass were observed using a scanning electron microscope (Digital SEM Leica 440 at 20 kV) controlled with a computer system. Dissolved oxygen (DO) and pH were measured daily.3. Results and discussion
The whole process was divided into three stages: the cultivation and acclimation section of the MBS (phase I), the improvement of the influent load and the denitrification capacity section (phase II), and the efficient and stable operation section (phase III).3.1. Removal of ammonia nitrogen at various stages
The MBS used in this experiment was stored at low temperature for 2 months before entering the reactor, and ammonia nitrogen was not added as a nutrient during storage. Therefore, the internal nitrifying bacteria in the MBS were in an inert state, and anaerobic microorganisms predominated. The MBS was greyish brown and smelly. Therefore, at the beginning of the experiment, domestication and acclimation of the MBS were necessary for biological growth, and the nitrifying bacteria turned into dominant species.44
Inner tube circulation structure ensures thorough mixing of the matrix with the carrier inside the reactor. The amount of aeration was 2 L (L min)−1, which was the amount of gas that can at least agitate the MBS. If the MBS was not fluidized, the amount of aeration could be appropriately increased (maximum 4 L (L min)−1), as it is seen in the recent studies that increasing aeration rate can achieve good removal efficiency of nitrogen.46 The ammonia nitrogen removal in the acclimation section is shown in Fig. 2a.
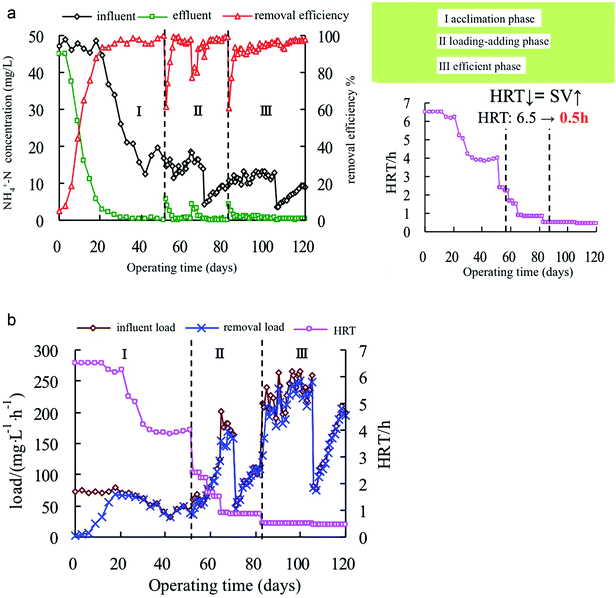 | ||
| Fig. 2 (a) Ammonia nitrogen concentration and HRT in the three phases. (b) Ammonia nitrogen removal load in the three phases. | ||
In the initial stage of the test, the MBS was cultured in an inorganic ammonia-nitrogen nutrient solution at 45–50 mg L−1. The ammonia nitrogen removal rate was over 90% on the 20th day of acclimation. The nitrifying bacteria embedded in the MBS continuously proliferated and the biological concentration was increased. The influent ammonia nitrogen concentration was reduced (from 50 mg L−1 to 20 mg L−1), and the HRT was also reduced (from 6.5 h to 4.0 h). The removal rate on the 13th day of operation was still above 93%. It showed that the nitrifying bacteria were not affected and could better adapt to this change. At the end of domestication, the influent ammonia nitrogen concentration was 10–20 mg L−1.
After 18 days of operation, the entire section of the removal load and the influent load curve was almost completely fitted, and the effluent ammonia nitrogen was stable below 1 mg L−1. At the end of acclimation, compared with the influent of 16.9 mg L−1, ammonia nitrogen was not detected in the effluent after 4 h, and the removal rate was close to 100%. It can be seen that the system was easy to start. The MBS has shown higher nitrification activity, and the colour of the particles also changed from the initial taupe colour to pale yellow, which can be considered as the end of domestication.
As can be seen from Fig. 2a, when the influent ammonia nitrogen concentration was 10–20 mg L−1, the HRT reduced from 4.0 h to 0.85 h, and the effluent concentration recovered quickly after the fluctuation in the effluent concentration. The removal load (Fig. 2b) increased from 37 mg (L h)−1 to 170 mg (L h)−1, indicating that the MBS have strong impact load resistance and the nitrification also improved. When the influent (ammonia nitrogen) was lower than 10 mg L−1, the HRT was fixed at 0.85 h. The influent load increased from 50 mg (L h)−1 to 110 mg (L h)−1 by increasing the influent concentration. For the internal circulation upflow bioreactor, the effects of the influent load and the influent concentration on the removal of ammonia nitrogen was compared.47–49 After 3 days of adaptation, the removal load and the influent load were quite the same and increased simultaneously, the removal rate was maintained above 97%, and the effluent NH4+-N concentration was below 0.3 mg L−1, demonstrating that the MBS matrix had good permeability and was not restricted by low-concentration mass transfer.
3.2. The nitrous acid effluent from phase II and phase III
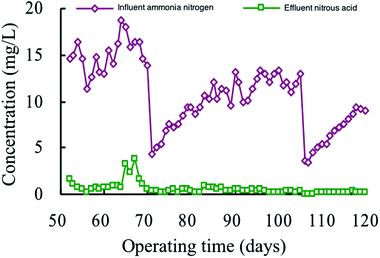
It can be seen from Fig. 3 that the concentration of NO2−-N in the effluent in phase II was 0–5 mg L−1. Fluctuations in influent can be seen clearly, the effluent NO2−-N in phase III stabilized at a relatively low level. When the influent ammonia nitrogen concentration was changed from 10 to 15 mg L−1, the effluent NO2−-N concentration was always below 0.5 mg L−1 after the adaptation of the MBS. Especially, when the influent ammonia nitrogen was below 10 mg L−1, the effluent NO2−-N concentration can be stabilized below 0.2 mg L−1. It can be seen that the nitrification was more thorough when the low-concentration ammonia nitrogen was removed using the MBS.3.3. Comparison of respiration activity between acclimated and high-efficiency phases
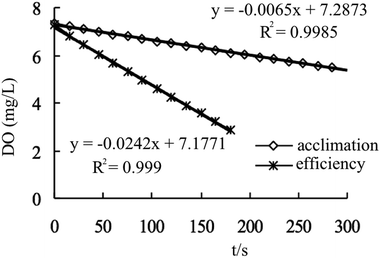
The ammonia nitrogen water (the composition and ratio of the water mixture), which has been previously aerated and oxygenated to a saturated state, was placed in a 250 mL hemostatic dissolved oxygen bottle and heated to 30–35 °C (corresponding to the conditions of the continuity test), and the MBS was in a certain amount of weight and volume (about 18.6 mL) that has been accurately weighed beforehand.MBS were placed in the same dissolved oxygen bottle, sealed in a dissolved oxygen meter probe, and slowly stirred by a magnetic stirrer. The dissolved oxygen concentration in the bottle was measured at regular intervals, and the obtained data and the corresponding time were plotted to determine the respiration activity.
It can be seen from Fig. 4 that when the dissolved oxygen concentration in the bottle was above 2 mg L−1, the oxygen concentration in the culture acclimation phase and the high-efficiency operation phase decreased linearly with time, and the slope (oxygen degradation rate) represents the MBS nitrification. The respiration activity of the MBS is the oxygen consumption of certain amount of MBS per unit time. If the dissolved oxygen was below 2 mg L−1, the oxygenation concentration inhibited the nitrification of the MBS. Since the dissolved oxygen in the process was sufficient at 3–4 mg L−1, the DO was below 2 mg L−1. From the slope calculation in the above linear relationship (respiration activity = slope × bottle volume 250 mL/MBS volume 18.6 mL), the respiration activity increased from 314.5 mg (L h)−1 in the acclimation phase to 1170.9 mg (L h)−1 in the high efficiency phase. According to the stoichiometric formula (1 g NH4+-N consuming 4.57 g O2), the removal load can be increased from 69.9 mg-N (L h)−1 to 256.2 mg-N (L h)−1. The values are consistent with the results of continuous denitrification experiments of MBS in the fluidized bed. It can be seen that the activity of the MBS was greatly enhanced, and it was feasible to treat the low-concentration ammonia nitrogen wastewater.
3.4. pH change during the whole experiment
During the nitration reaction, H+ was released to lower the pH.| NH4+ + O2 → NO2− + H2O + H+, NH4+ + O2 → NO3− + H2O + H+ |
Nitrifying bacteria are sensitive to the pH.51 The optimal pH for nitrification activity is between 7.5 and 8.5.52 In order to maintain an optimal pH value of 7–8,53 NaHCO3 should be added to the simulated aqueous solution to maintain sufficient alkalinity (Table 1). The pH plays an important role for the concentration of ammonia and nitrate as Ammonia Oxidizing Bacteria (AOB), Nitrosomonas and some chemolithotrophic AOB preferably used free ammonia than ammonium for their energy.
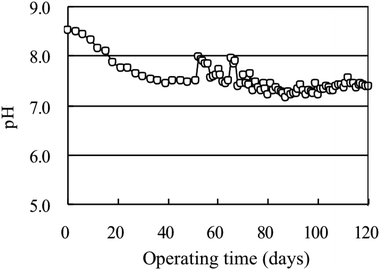
Anthonisen et al.54 stated that nitrifying organism were inhibited by the non-ionized form of ammonia and nitrous acid. During biological treatment, Gerardi55 showed that, if the pH was below 6.8 and above 7.5, numerous operational problems such as inhibition of nitrification, decreased enzymatic activity, increased ammonia production, interrupted floc formation, and undesired growth of fungi and nocardioforms were observed. According to Isaka et al.,56 at high pH, unbalanced activity in AOB was observed. As seen in Fig. 5 at the initial stage of acclimation, the pH was high at 8.1–8.6, and the free ammonia produced at higher pH has a certain inhibitory effect on the microbial nitration activity.54 After that, the pH gradually decreased below 8.0, indicating that the nitrifying bacteria gradually adapted to the environment and the nitrification activity was enhanced. Therefore, the acid produced by the nitrification process is neutralized by the alkalinity, making the solution close to neutral and suitable for the growth of microorganisms.
Under the coordination effect of a certain amount of Na2HPO4·12H2O, the pH value was automatically maintained between 7.0 and 8.0 in the whole test process except for the initial period of domestication, especially in the high efficiency phase. The pH value was stable at 7.2–7.3. This neutral environment was conducive for the survival of the microorganism and for the treatment of water.51,55
3.5. Study on the nitrification characteristics of MBS in a representative cycle
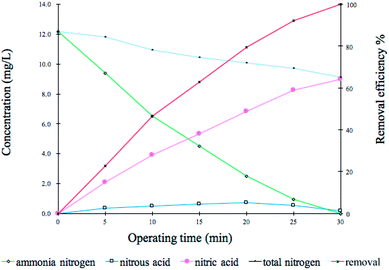
The nitrification process of treating low-concentration ammonia nitrogen by MBS in a representative cycle is shown in Fig. 6. The experiment was carried out in an inner circulated fluidized bed reactor and MBS from high efficiency phase (III) was placed, and the characteristics of the synthetic wastewater are same as shown in Table 1. The concentrations of NH4+-N, NO2−-N and NO3−-N in the reactor were measured at regular intervals, and the reaction time was plotted on the horizontal axis.It was mentioned in the literature by several authors54,57 that free ammonia concentration strictly depends on the pH value and the temperature; these factors directly influence the kinetics of the nitrification process and, consequently, the volumetric ammonium loading rate of the treatment plants. Strotmann et al.50 who studied the degradation kinetics of ammonium with immobilized bacteria showed that the ammonia nitrogen in the feed water was below 15 mg-N per L, the nitration reaction was a first-order reaction, and the reaction rate was mainly controlled by the ammonia nitrogen substrate concentration. Later, Moussa58 studied the nitrification in saline industrial wastewater. The result in the representative cycle for two nitrifying SBR reactors for NH4+, NO2− and NO3− concentrations showed that the full oxidation of ammonia and nitrite occurred within 2 h under steady state conditions (30 °C and pH 7.5).
However, in this present study, the data showed that the ammonia nitrogen concentration decreased almost linearly with time, which was similar to the zero-order reaction, C = C0 − kt (slope k was the average nitrification rate, which was used to reflect the ability of nitrifying bacteria to remove ammonia nitrogen). The MBS has strong nitrification activity, and at this concentration, they are not restricted by the mass transfer of low-concentration ammonia nitrogen, and so, they exhibit a simple linear law. The initial NH4+-N concentration was 12.3 mg L−1. After 30 min, ammonia nitrogen was not detected, the removal rate was close to 100%, and the removal load was 246 mg (L h)−1. The results of the intermittent experiment of oxygen respiration activity were consistent. The nitrite nitrogen reached a maximum of 0.7 mg L−1 at 20 min, and the concentration was below 0.1 mg L−1 after 30 min. At the same time, the total nitrogen concentration in the effluent showed a decreasing trend with time.
3.6. Scanning electron microscopy
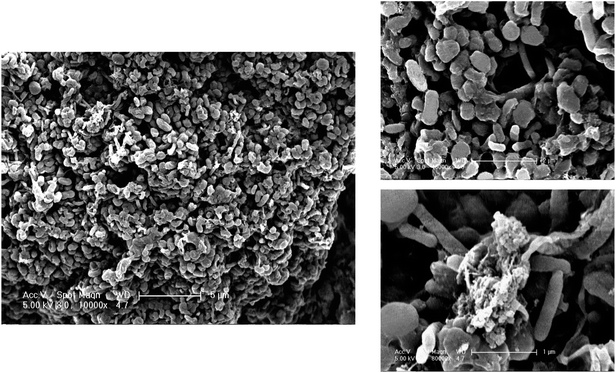
Scanning electron microscopy (Fig. 7) shows that the MBS have high surface nutrient level, sufficient oxygen supply and high bacterial density. The cubic particle (MBS) has a porous network structure and bacteria were not easy to be lost.45 The contact surface with nutrients was good, and the nitrification ability was extremely strong, so the ammonia nitrogen could be removed efficiently and quickly.Ammonia-oxidizing bacteria (AOB) and ammonia-oxidizing archaea (AOA) play an important role during the ammonia oxidation.51,59 They use ammonia and nitrite as the electron donor and carbon dioxide as the carbon source.60 The spheroidal, rod-shaped and spiral bacteria are involved in nitrification.61 The bacteria responsible for nitrification were not only present in wide variety and showed rapid growth rate, but also have good genetic characteristics, strong adaptability and impact load capacity.
4. Conclusion
This study presents a laboratory attempt to explore the possibility of applying MBS as a sustainable technology for wastewater treatment with low-concentration ammonia nitrogen. The effect of continuous removal of low-concentration ammonia nitrogen in water by MBS in the inner circulated upflow fluidized bed reactor was studied. The MBS showed easy acclimation and the system was easy to start for low-concentration ammonia nitrogen. For 10–15 mg L−1 influent NH4+-N concentration, the removal rate of NH4+-N was over 90% (HRT 30 min); when it was less than 10 mg L−1, the concentration of NH4+-N and NO2−-N in the effluent was below 0.25 mg L−1 after 27 min. The impact resistance of the MBS was strong, and the removal load could be rapidly increased immediately following the increase in the influent load up to 251.6 mg-N per (L-pellet h). When the low-concentration ammonia nitrogen was removed using MBS, the nitrification was more thorough, and it was not easy to generate NO2−-N accumulation.The biological activity of the MBS was greatly enhanced after the cultivation and acclimation section and the load section was increased. The respiration activity was increased from 319.4 mg-N per (L-pellet h) in the acclimated phase to 1170.9 mg per (L-pellet h) in the high-efficiency section. After theoretical conversion, the removal load equivalent to the particle was increased from 69.9 mg-N (L h)−1 in the acclimated phase to 256.2 mg-N (L h)−1 in the high-efficiency phase. The results of continuous denitrification experiments of MBS in a fluidized bed were consistent. The pH value of the system can be automatically maintained between 7.0 and 8.0, and the high-efficiency period was stable between 7.2 and 7.3, which was beneficial for the biological growth, reproduction and the treatment of the water supply system. The nitrification reaction of the MBS approached the zero-order reaction kinetics. The ammonia nitrogen concentration decreased linearly with time, and its slope reflected the ability to remove load. In the batch test, it was about 246 mg-N per (L-pellet h), which was similar to the continuity test and the respiration activity experiment.
Nitrogen hazards are diverse, and almost all other forms of nitrogen except molecular N2, especially ammonia and nitrate, can adversely affect human beings and their environment. This study will lay a foundation for the treatment of ammonia nitrogen in low concentration.
Conflicts of interest
There are no conflicts to declare.Acknowledgements
The author expresses her gratitude to Ge Xiaohong for her valuable contribution in this experimental study and also cooperation in contributing to the success of this study. The author would also like to thank Taibah university.References
- G. Elert, The physics Factbook, 2009, http://hypertextbook.com/facts Search PubMed.
- D. Dudgeon, A. H. Arthington, M. O. Gessner, Z.-I. Kawabata, D. J. Knowler, C. Lévêque, R. J. Naiman, A.-H. Prieur-Richard, D. Soto and M. L. J. Stiassny, Biol. Rev., 2006, 81, 163–182 CrossRef PubMed.
- M. M. Mekonnen and A. Y. Hoekstra, Sci. Adv., 2016, 2, e1500323 CrossRef PubMed.
- D. H. Kumar Reddy and S. M. Lee, J. Environ. Anal. Toxicol., 2012, 2, e103 Search PubMed.
- K. Jayaswal, V. Sahu and B. R. Gurjar, in Water Remediation, Springer, 2018, pp. 11–27 Search PubMed.
- Studies in Environmental Science, ed. B. Halling-Sorensen and S. E. Jorgensen, Elsevier, 1993, vol. 54, pp. 3–40 Search PubMed.
- J. A. Camargo and Á. Alonso, Environ. Int., 2006, 32, 831–849 CrossRef CAS PubMed.
- R. A. Duce, J. LaRoche, K. Altieri, K. R. Arrigo, A. R. Baker, D. G. Capone, S. Cornell, F. Dentener, J. Galloway, R. S. Ganeshram, R. J. Geider, T. Jickells, M. M. Kuypers, R. Langlois, P. S. Liss, S. M. Liu, J. J. Middelburg, C. M. Moore, S. Nickovic, A. Oschlies, T. Pedersen, J. Prospero, R. Schlitzer, S. Seitzinger, L. L. Sorensen, M. Uematsu, O. Ulloa, M. Voss, B. Ward and L. Zamora, Science, 2008, 320, 893 CrossRef CAS PubMed.
- J. N. Galloway, A. R. Townsend, J. W. Erisman, M. Bekunda, Z. Cai, J. R. Freney, L. A. Martinelli, S. P. Seitzinger and M. A. Sutton, Science, 2008, 320, 889 CrossRef CAS PubMed.
- B. Qin, G. Zhu, G. Gao, Y. Zhang, W. Li, H. W. Paerl and W. W. Carmichael, Environ. Manage., 2010, 45, 105–112 CrossRef.
- Q. H. Cai and Z. Y. Hu, Acta Hydrobiol. Sin., 2006, 30(1), 7–11 CAS.
- Mississippi River/Gulf of Mexico Watershed Nutrient Task Force, Gulf Hypoxia Action Plan 2008 for Reducing, Mitigating, and Controlling Hypoxia in the Northern Gulf of Mexico and Improving Water Quality in the Mississippi River Basin, Washington, DC, 2008, http://https://www.epa.gov/ms-htf/gulf-hypoxia-action-plan-2008 Search PubMed.
- T. H. Snelder and B. J. F. Biggs, J. Am. Water Resour. Assoc., 2002, 38, 1225–1239 CrossRef.
- R. W. McDowell, Grazed pastures and surface water quality, Nova Publishers, 2008 Search PubMed.
- S. Larned, et al., Analysis of water quality in New Zealand lakes and rivers: data sources, data sets, assumptions, limitations, methods and results. Prepared for the Ministry for the Environment, NIWA Client Report no. CHC2015-033, http://https://data.mfe.govt.nz.2015 Search PubMed.
- S. T. Larned, T. Snelder, M. J. Unwin and G. B. McBride, N. Z. J. Mar. Freshwater Res., 2016, 50, 389–417 CrossRef CAS.
- S. Larned, T. Snelder and M. Unwin, Water quality in New Zealand rivers: Modelled water quality state. Prepared for the Ministry for the Environment, NIWA Client Report no. CHC2016-070., NIWA, Wellington, 2017, http://archive.stats.govt.nz/browse_for_stats/environment/environmental-reporting-series/environmental-indicators/Home/Freshwater/river-water-quality-clarity.aspx Search PubMed.
- U. S. Epa, Update of ambient water quality criteria for ammonia, EPA-822/R-99-014, Office of Water, Washington, DC, 1999 Search PubMed.
- S. F. Brinkman, J. D. Woodling, A. M. Vajda and D. O. Norris, Transactions of the American Fisheries Society, 2009, 138, 433–440 CrossRef CAS.
- S. M. Levit, Center for Science in Public Participation Bozeman, Montana, https://www.conservationgateway.org/ConservationByGeography/NorthAmerica/UnitedStates/alaska/sw/cpa/Documents/L2010ALR122010.pdf, 2010 Search PubMed.
- C. Domeño, A. n. Rodríguez-Lafuente, J. M. Martos, R. Bilbao and C. Nerín, Environ. Sci. Technol., 2010, 44, 2585–2591 CrossRef PubMed.
- X. Luo, Q. Yan, C. Wang, C. Luo, N. Zhou and C. Jian, Int. J. Environ. Res. Public Health, 2015, 12, 11975–11987 CrossRef CAS PubMed.
- J. J. Hanway, J. B. Herrick, T. L. Willrich, P. C. Bennett and J. T. McCall, 1963.
- A. G. Capodaglio, P. Hlavínek and M. Raboni, Rev. Ambiente Agua, 2015, 10, 481–498 CAS.
- G. Tchobanoglous, F. L. Burton and H. D. Stensel, Wastewater engineering treatment and reuse, McGraw-Hill Higher Education, Boston, US, 2003 Search PubMed.
- M. Orentlicher, S. Brown and C. Hall, Proceedings of the Water Environment Federation, 2009, 2009, 546–555 CrossRef.
- P. Viotti and R. Gavasci, Rev. Ambiente Agua, 2015, 10, 240–252 CAS.
- C. Garcia-Belinchón, T. Rieck, L. Bouchy, A. Galí, P. Rougé and C. Fàbregas, Water Practice and Technology, 2013, 8, 119–130 CrossRef.
- M. Zabochnicka-Świątek and K. Malińska, Global NEST J., 2010, 12, 256–261 Search PubMed.
- T. Asada, T. Ohkubo, K. Kawata and K. Oikawa, J. Health Sci., 2006, 52, 585–589 Search PubMed.
- S. He, Q. Huang, Y. Zhang, L. Wang and Y. Nie, Ind. Eng. Chem. Res., 2015, 54, 1447–1451 CrossRef CAS.
- S. Lee, S. Maken, J.-H. Jang, K. Park and J.-W. Park, Water Res., 2006, 40, 975–980 CrossRef CAS PubMed.
- G. Zhu, Y. Peng, B. Li, J. Guo, Q. Yang and S. Wang, in Reviews of environmental contamination and toxicology, Springer, 2008, pp. 159–195 Search PubMed.
- H. Yang and H. Cheng, Sep. Purif. Technol., 2007, 56, 392–396 CrossRef CAS.
- Z. Guo, Z. Zheng, C. Gu and Y. Zheng, Radiat. Phys. Chem., 2008, 77, 702–707 CrossRef CAS.
- M. Islam and R. Patel, Desalination, 2010, 256, 120–128 CrossRef CAS.
- G. Markou, D. Vandamme and K. Muylaert, Bioresour. Technol., 2014, 155, 373–378 CrossRef CAS PubMed.
- H. Asano, H. Myoga, M. Asano and M. Toyao, Water Sci. Technol., 1992, 26, 1037–1046 CrossRef CAS.
- T. Sumino, H. Nakamura, N. Mori, Y. Kawaguchi and M. Tada, Appl. Microbiol. Biotechnol., 1992, 36, 556–560 CrossRef CAS.
- M. Morita, N. Kudo, H. Uemoto, A. Watanabe and H. Shinozaki, Eng. Life Sci., 2007, 7, 587–592 CrossRef CAS.
- X. Wu, H. He, W. L. Yang, J. Yu and C. Yang, Appl. Microbiol. Biotechnol., 2018, 102, 7597–7610 CrossRef CAS PubMed.
- J. Yu, H. He, W. L. Yang, C. Yang, G. Zeng and X. Wu, Bioresour. Technol., 2018, 260, 196–203 CrossRef CAS PubMed.
- C. Zhu, W. L. Yang, H. He, C. Yang, J. Yu, X. Wu, G. Zeng, S. Tarre and M. Green, Chemosphere, 2018, 200, 380–387 CrossRef CAS PubMed.
- S. Tabassum, Y. Li, L. Chi, C. Li and Z. Zhang, J. Cleaner Prod., 2018, 172, 368–384 CrossRef CAS.
- S. Tabassum, Y. Wang, X. Zhang and Z. Zhang, RSC Adv., 2015, 5, 88692–88702 RSC.
- Y. Chen, H. He, H. Liu, H. Li, G. Zeng, X. Xia and C. Yang, Bioresour. Technol., 2018, 249, 890–899 CrossRef CAS PubMed.
- H. J. Laanbroek and S. Gerards, Arch. Microbiol., 1993, 159, 453–459 CrossRef CAS.
- X. Li, W. L. Yang, H. He, S. Wu, Q. Zhou, C. Yang, G. Zeng, L. Luo and W. Lou, Bioresour. Technol., 2018, 251, 274–279 CrossRef CAS PubMed.
- Q. Zhou, Y. Lin, X. Li, C. Yang, Z. Han, G. Zeng, L. Lu and S. He, Bioresour. Technol., 2018, 249, 457–463 CrossRef CAS PubMed.
- U. J. Strotmann and G. Windecker, Chemosphere, 1997, 35, 2939–2952 CrossRef CAS.
- J. O. Raoeliaritiana, Master’s thesis, University of Stavanger, 2016.
- R. I. Sedlak, Phosphorus and nitrogen removal from municipal wastewater: principles and practice, CRC press, 1991 Search PubMed.
- A. V. Quinlan, Water Res., 1984, 18, 561–566 CrossRef CAS.
- A. C. Anthonisen, R. C. Loehr, T. B. S. Prakasam and E. G. Srinath, J.–Water Pollut. Control Fed., 1976, 835–852 CAS.
- M. H. Gerardi, Nitrification and denitrification in the activated sludge process, John Wiley & Sons, 2003 Search PubMed.
- K. Isaka, S. Yoshie, T. Sumino, Y. Inamori and S. Tsuneda, Biochem. Eng. J., 2007, 37, 49–55 CrossRef CAS.
- J. Groeneweg, B. Sellner and W. Tappe, Water Res., 1994, 28, 2561–2566 CrossRef.
- M. S. Moussa, Nitrification in saline industrial wastewater, CRC Press, 2014 Search PubMed.
- M. Könneke, A. E. Bernhard, J. R. de la Torre, C. B. Walker, J. B. Waterbury and D. A. Stahl, Nature, 2005, 437, 543–546 CrossRef PubMed.
- B. E. Rittmann and P. L. McCarty, Environmental biotechnology: principles and applications, Tata McGraw-Hill Education, 2012 Search PubMed.
- M. Von Sperling, Basic Principles of Wastewater Treatment, IWA Publishing, 2007 Search PubMed.
| This journal is © The Royal Society of Chemistry 2018 |

