
 Open Access Article
 This Open Access Article is licensed under a Creative Commons Attribution-Non Commercial 3.0 Unported Licence
Removal of arsenic(V) from aqueous solutions using sulfur-doped Fe3O4 nanoparticles†
Junhui Liua,
Long Kong*a,
Xueqiong Huanga,
Min Liua and
Liang Li *ab
*ab
aSchool of Environmental Science and Engineering, Shanghai Jiao Tong University, 800 Dongchuan Road, Shanghai 200240, China. E-mail: liangli117@sjtu.edu.cn; longmao88@sjtu.edu.cn
bShanghai Institute of Pollution Control and Ecological Security, 1239 Siping Road, Shanghai 200092, China
First published on 5th December 2018
Abstract
In this study, magnetic sulfur-doped Fe3O4 nanoparticles (Fe3O4:S NPs) were applied as adsorbents for the removal of As(V). Fe3O4:S NPs were fabricated by a two-step route, which included low-temperature mixing and high-temperature sintering. The as-prepared Fe3O4:S NPs could effectively remove As(V) under a wide pH range of 2–10 and presented a high As(V) adsorption capacity of 58.38 mg g−1, which was much better than undoped Fe3O4 nanoparticles (20.24 mg g−1). Adsorption experiments exhibited a pseudo-second-order model of adsorption kinetics and a Langmuir isotherm model of adsorption isotherms. Additionally, the coexisting ions such as NO3−, SO42−, and CO32− had no significant effect on As(V) adsorption and the adsorbent worked well in actual smelting wastewater. XPS and FTIR spectra of Fe3O4:S NPs before and after As(V) adsorption showed that Fe–OH groups played a significant role in the adsorption mechanisms. Moreover, the magnetic Fe3O4:S NPs adsorbents after adsorption could be rapidly separated from wastewater with an external magnetic field. Therefore, Fe3O4:S NPs could be an ideal candidate for the removal of As(V) from water.
1. Introduction
Arsenic is a persistent and toxic metalloid existing in the aquatic environment.1–3 Arsenic may cause poisoning and death in humans as a result of contaminated water.4–7 Recently, arsenic contamination problems were reported in India, Chile, Bangladesh, Vietnam, and other parts of the world.8–10 In China, chronic arsenic exposure has caused very severe health problems.11–13 Nearly 14.6 million people are exposed to contaminated water with arsenic concentration of 0.03 mg L−1 or higher every day.14Varieties of technologies, such as coagulating sedimentation by CaO,15 ion exchange,16 and adsorption17 have been used to remove arsenic from water. In spite of the low cost of coagulation process, it produces bulky sludge, and furthermore, the arsenic level in the water after treatment could not reach the strict standard of World Health Organization (WHO).18 The problems of ion exchange process including high cost and the difficulty of regeneration have prevented it from wide application. On the contrary, adsorption process seems to be a promising technology because of the less sludge producing operation and high removal efficiency.19,20 A lot of adsorbents have been developed to efficiently remove As(V) from water in the recent years.21–29 As a sort of cheap adsorbents, iron oxides have been used for arsenic removal because of iron's affinity to inorganic arsenic species.30 However, in certain situations, iron oxide presents low arsenic adsorption capacity, long adsorption process, and only works in a narrow pH range, which have greatly limited its application.31,32 Hence, specific strategies such as surface modification and elements doping have attracted attentions to conquer these weaknesses.
In this study, sulfur-doped Fe3O4 nanoparticles (Fe3O4:S NPs) with excellent adsorption capacity and separation properties33 were used for the removal of As(V) from water. Compared with undoped Fe3O4 NPs, the sulfur-doped nanoparticles exhibited a widely applicable pH range of 2–10 for As(V) removal. The prepared Fe3O4:S NPs were characterized using X-ray diffraction (XRD), transmission electron microscope (TEM), energy dispersive X-ray fluorescence (ED-XRF), Fourier transform infrared (FTIR), vibrating sample magnetometer (VSM), and X-ray photoelectron spectroscopy (XPS) analyses. The adsorption properties of Fe3O4:S NPs were investigated including the effects of initial pH, adsorption kinetics, adsorption isotherms, and the effects of coexisting ions. On account of these results, the possible mechanisms for the removal of As(V) were discussed.
2. Materials and methods
2.1 Materials and preparation
Sodium arsenate heptahydrate (Na2HAsO4·7H2O), iron(III) nitrate nonahydrate (Fe(NO3)3·9H2O), 1-butylamine, and thiourea were supplied by Aladdin Chemical (Shanghai, China). All the chemicals were of analytical reagent grade and were used without any further purification. A 50 mg L−1 As(V) stock solution was prepared by dissolving 104.12 mg Na2HAsO4·7H2O into 500 mL of distilled water (DI) (>18 MΩ cm). As(V) solution was prepared by diluting As(V) stock solution to a given concentration with distilled water. The industrial wastewater sample was taken from a smelting plant located in Hubei, China.Fe3O4:S NPs were synthesized based on our previous report.33 Typically, 60 mmol of thiourea and 20 mmol of Fe(NO3)3 were dissolved into 100 mL 1-butylamine, separately. After ultrasonic dispersion, the two solutions were mixed in a 250 mL three-neck flask under stirring. The mixture was heated to 60 °C with continuous stirring for 2 h in the atmosphere of flowing nitrogen. After cooling it to room temperature, the dark brown colored product was washed with methanol and acetone several times and was dried in a vacuum oven for 1 h at 60 °C. Then, the product was sintered at 300 °C for 2 h in the atmosphere of flowing nitrogen, and it was labeled as Fe3O4:S. For comparison, bare Fe3O4 NPs were prepared following the same procedure without the addition of thiourea. To prove that the Fe3O4 NPs and Fe3O4:S NPs were successfully prepared, XRD spectra and EDX spectra were recorded and provided in ESI (Fig. S2 and S4).†
2.2 Adsorption experiments
Adsorption experiments were conducted by adding adsorbents into As(V) solutions and stirring them continuously. At certain time intervals, the solutions were sampled and filtered through a 0.22 μm membrane to analyze the concentration of As(V). From the obtained results, the effects of initial pH on As(V) adsorption, adsorption kinetics, adsorption isotherms, and the effects of competing ions were studied.The effect of initial solution pH on As(V) adsorption was investigated to determine the optimum pH of As(V) adsorption. The initial pH of the solutions was adjusted from 2 to 10 using 0.1 M HCl and NaOH. The as-prepared adsorbent (30 mg) was added to 60 mL of As(V) solution (20 mg L−1) under continuous stirring at 30 °C for 24 h.
Adsorption kinetic experiments were conducted under the following conditions: The initial pH was set to the obtained optimum value. The as-prepared adsorbent (50 mg) was added to 100 mL of As(V) solution (20 mg L−1) under continuous stirring at 30 °C for 24 h. Samples were gathered at certain intervals.
For Adsorption isotherm experiments, the concentrations of As(V) solutions were adjusted ranging from 5 mg L−1 to 50 mg L−1. The as-prepared adsorbent (20 mg) was added to 40 mL of As(V) solution under continuous stirring at 30 °C. Samples were taken after 24 h.
To investigate the influence of coexisting ions, 20 mg of adsorbent was added to 40 mL of As(V) solution (30 mg L−1) containing competing ions of NO3−, PO43−, SO42−, and CO32− under continuous stirring (30 °C, 24 h). The concentrations of the competing ions were fixed at 0.4 mM and 0.8 mM to control the molar ratios of competing ions to As(V) at 1 and 2, respectively. Moreover, a control group was conducted under the same condition in the absence of competing ions.
The industrial wastewater samples (As 0.349 mg L−1, Cu 0.095 mg L−1, Ni 0.449 mg L−1, 20 mL) from a smelting plant were mixed with the as-prepared adsorbent whose dosage range was from 0.25 g L−1 to 1 g L−1. Under continuous stirring at 30 °C for 24 h, samples were compared with the original one. Chinese national standard (GB) of arsenic was also utilized as a reference.
The concentrations of As and total iron in the filtrates were analyzed using Inductive Coupled Plasma Emission Spectrometer (ICP-OES 5110, Agilent, USA) and Atomic Adsorption Spectrometer (ControlAA700, Analytik Jena AG, Germany). After adsorption, the adsorbents were separated from the solution by high-speed centrifuge, and then were dried in a vacuum oven at 60 °C to determine the adsorption mechanisms.
2.3 Characterization
The ED-XRF (EDX-720) analysis was conducted to determine the concentrations of Fe, O, and S in the resulted Fe3O4:S NPs. To analyze the crystalline structures of nanoparticles, the XRD measurement of Fe3O4:S adsorbent before and after adsorption was recorded on a Shimadzu XRD-6100 (Japan). Morphologies of the samples before and after adsorption were characterized using a TEM (JEM-2100F operating at 200 kV, Japan). FTIR spectra of Fe3O4:S NPs before and after adsorption were recorded by a Thermo Nicolet 6700 spectrometer (USA) over the wavelength range of 4000–400 cm−1, using KBr as a reference. The magnetic measurement was conducted on a PPMS-9T (EC-II) of Quantum Design with a magnetic field up to 3 T. To measure the binding energies and atomic ratios, XPS analysis was performed on a Thermo Scientific Escalab 250Xi Photoelectron Spectrometer (USA) with a monochromatic Al Kα radiation source.3. Results and discussion
3.1 Adsorption performance
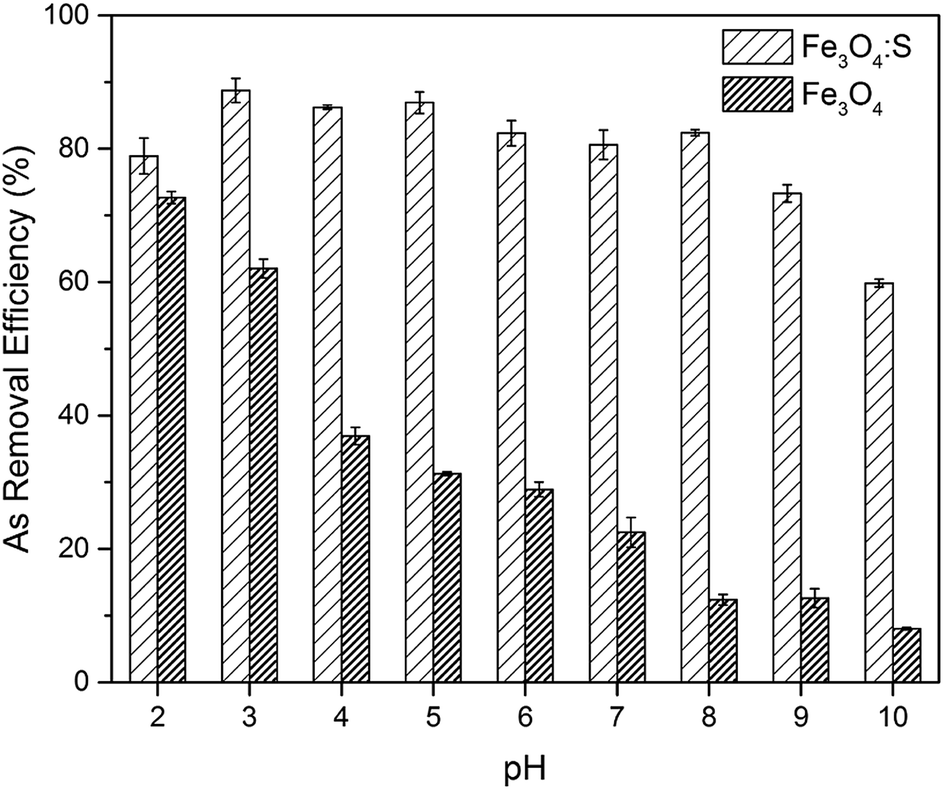 | ||
| Fig. 1 The pH dependence for As(V) adsorption on Fe3O4:S NPs and Fe3O4 NPs. Experimental conditions: initial As(V) concentration was 20 mg L−1 (60 mL), adsorbent dosage was 30 mg, pH 2–10, contact time was 24 h, temperature was 30 °C. | ||
 | ||
| Fig. 2 (a) Adsorption kinetics of As(V) on Fe3O4:S NPs and Fe3O4 NPs; (b) Fe releasing kinetics of Fe3O4:S NPs and Fe3O4 NPs. Experimental conditions: initial As(V) concentration was 20 mg L−1 (100 mL), adsorbent dosage was 50 mg, pH 6, contact time was 24 h, temperature was 30 °C. | ||
Pseudo-first-order model and pseudo-second-order model, as two different kinds of kinetic models, were utilized to simulate the kinetic experiments data of Fe3O4:S NPs and Fe3O4 NPs. The equations are mentioned below:35,36
ln(qe − qt) = ln![[thin space (1/6-em)]](https://www.rsc.org/images/entities/char_2009.gif) qe − k1t qe − k1t |
where qt and qe are the amount of As(V) adsorbed at any time t and the equilibrium time (mg g−1), respectively. k1 (min−1) and k2 (g mg−1 min−1) refer to the rate constants of the two fitting models. From the two fitting models, we obtained the adsorption parameters and correlation coefficient (R2) and listed them in Table 1. For both Fe3O4:S and Fe3O4 NPs, the plots of t/qt versus t exhibited better linear dependence in the pseudo-second-order model (Fig. 3). As(V) adsorption capacity calculated using pseudo-second-order model was close to the experimental value, suggesting that chemical reaction was the critical rate-determining step.37 In our experiments, chemisorption played a significant role in the removal of As(V) on Fe3O4:S NPs and Fe3O4 NPs.
| Adsorbent | Kinetic model | The rate constant | qe (mg g−1) | R2 |
|---|---|---|---|---|
| Fe3O4:S | Pseudo-first-order model | 5.67 × 10⁻³ (min−1) | 16.08 | 0.906 |
| Pseudo-second-order model | 1.93 × 10⁻³ (g mg−1 min−1) | 42.44 | 0.999 | |
| Fe3O4 | Pseudo-first-order model | 2.44 × 10⁻³ (min−1) | 12.51 | 0.915 |
| Pseudo-second-order model | 8.35 × 10⁻⁴ (g mg−1 min−1) | 19.51 | 0.988 |
 | ||
| Fig. 3 (a) The pseudo-second-order model for As(V) adsorption on Fe3O4:S NPs; (b) the pseudo-second-order model for As(V) adsorption on Fe3O4 NPs. | ||
where Ce is the As(V) equilibrium concentration (mg L−1), qe is the amount of As(V) adsorbed at equilibrium (mg g−1), qm is the theoretical maximum adsorption capacity, KL is the Langmuir constant relating to the energy of As(V) adsorption. KF is the theoretical maximum adsorption capacity, and n is related to the Freundlich adsorption intensity parameter. The fitting plots based on Langmuir and Freundlich isotherm models are shown in Fig. 4(b) and (c), and the parameters of Langmuir isotherm model are listed in Table 2. It is clear that the removal of As(V) by Fe3O4:S NPs and Fe3O4 NPs is better simulated by Langmuir model with a higher correlation coefficient (R2) of 0.990 and 0.935, respectively. It indicated that the As(V) adsorption was mainly a monolayer sorption on the surfaces of Fe3O4:S and Fe3O4 NPs.40 The theoretical maximum adsorption capacity (qm) of Fe3O4:S NPs was 58.38 mg g−1, which is much higher than that of Fe3O4 NPs (20.24 mg g−1).

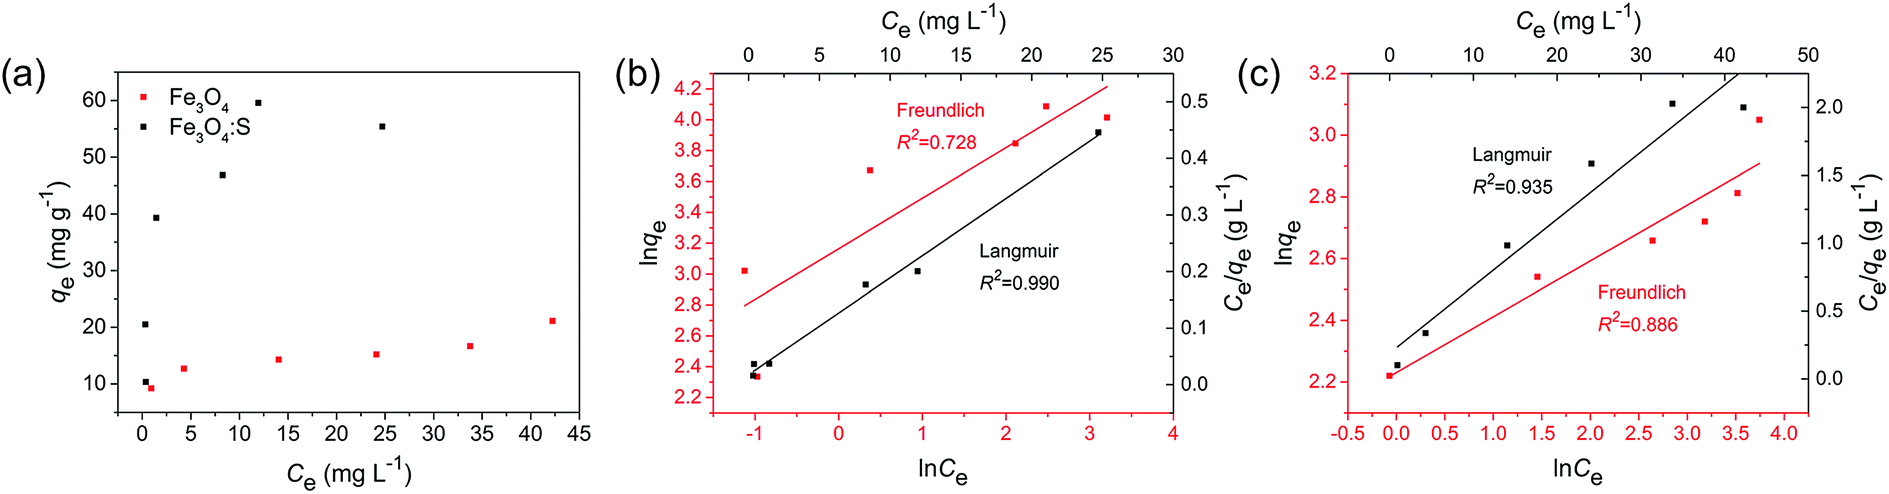 | ||
| Fig. 4 (a) Adsorption isotherm of As(V) on Fe3O4:S NPs and Fe3O4 NPs; (b) the fitting of Langmuir and Freundlich models of Fe3O4:S NPs; (c) the fitting of Langmuir and Freundlich models of Fe3O4 NPs. Experimental conditions: initial concentration was 5–50 mg L−1 (40 mL), adsorbent dosage was 20 mg, pH 6, contact time was 24 h, temperature was 30 °C. | ||
| Adsorbent | qm (mg g−1) | KL (L mg−1) | R2 |
|---|---|---|---|
| Fe3O4:S | 58.38 | 0.971 | 0.990 |
| Fe3O4 | 20.24 | 0.260 | 0.935 |
The feasibility of Langmuir isotherm adsorption can be expressed by separation factor, RL, which is defined by RL = 1/(1 + KLC0),41 where C0 is the initial concentration of As(V). The calculated values of RL in our experiments are 0.171 and 0.435 under the initial concentration of 5 mg L−1, respectively, which are in the range of 0–1, indicating the type of favorable adsorption. A comparison of maximum adsorption capacity (qm) of As(V) among Fe3O4:S NPs and other adsorbents are listed in Table 3.
Compared to Fe3O4 NPs, the adsorption capacity of Fe3O4:S NPs increased by 2.9 times, which was obvious and might attribute to sulfur doping. Compared to other iron-based adsorbents reported in recent years (Table 3), the distinct increase of adsorption capacity could be beneficial for their application.
 | ||
| Fig. 5 The effect of competing anions on As(V) removal by Fe3O4:S NPs. Experimental conditions: initial As(V) concentration was 30 mg L−1 (40 mL), adsorbent dosage was 20 mg, pH 6, contact time was 24 h, temperature was 30 °C. | ||
 | ||
| Fig. 6 The removal of As, Cu, and Ni by Fe3O4:S NPs in industrial wastewater. Experimental conditions: adsorbent dosage was 0.25–1 g L−1, contact time was 24 h, temperature was 30 °C (GB 31574-2015:47 Emission standards of pollutants for secondary copper, aluminum, lead, and zink industry; GB 3838-2002:48 Environmental quality standards for surface water). | ||
3.2 Adsorption mechanisms
To elucidate the major adsorption mechanisms of As(V) by Fe3O4:S NPs, XRD and TEM analyses were first conducted. Fig. 7 shows the XRD spectra of Fe3O4:S NPs before and after the As(V) adsorption. The peaks of Fe3O4:S NPs at 30.20°, 35.48°, 43.32°, 53.74°, 57.32°, and 62.78° correspond to the (220), (311), (400), (422), (511), and (440) lattice planes of magnetite Fe3O4 (JCPDS 19-0629), respectively, proving that the Fe3O4:S NPs were prepared successfully and were well-crystallized. The characteristic diffraction peaks of Fe3O4:S NPs slightly shifted to a smaller angle compared with Fe3O4 NPs (Fig. S2†). After As(V) adsorption, it is clear that compared with the Fe3O4:S NPs before adsorption, there was neither any shift in characteristic peaks nor a new peak occurred, which meant the well-crystallized nanoparticles were stable in the As(V) removal process.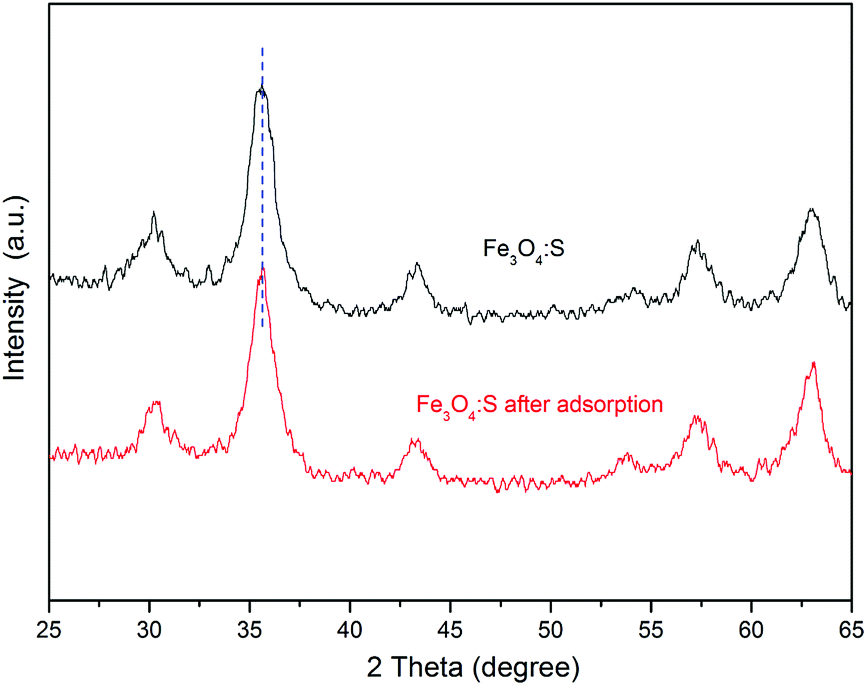 | ||
| Fig. 7 XRD spectra of Fe3O4:S NPs before and after As(V) adsorption. Experimental conditions: initial As(V) concentration was 50 mg L−1 (100 mL), adsorbent dosage was 60 mg, pH 6, contact time was 24 h, temperature was 30 °C. | ||
The morphologies of Fe3O4:S NPs before and after As(V) adsorption are shown in Fig. 8. The well-crystallized nanoparticles had a size ranging from 4.34 nm to 13.46 nm with an average size of 7.84 nm. We didn't observe obvious changes on the morphologies and size distribution of these Fe3O4:S NPs after adsorption experiments, which is consistent with the XRD pattern. The lattice fringes with a d-spacing of 0.248 nm are assigned to the (311) planes of Fe3O4, and they remained almost unchanged after As(V) adsorption (Fig. 8(b) and (d)). The above XRD and TEM data indicate that the adsorption of As(V) most likely happened on the surface of Fe3O4:S NPs and didn't cause the crystal structure change. Thus, the FTIR analyses were conducted to check the surface changes of Fe3O4:S NPs.
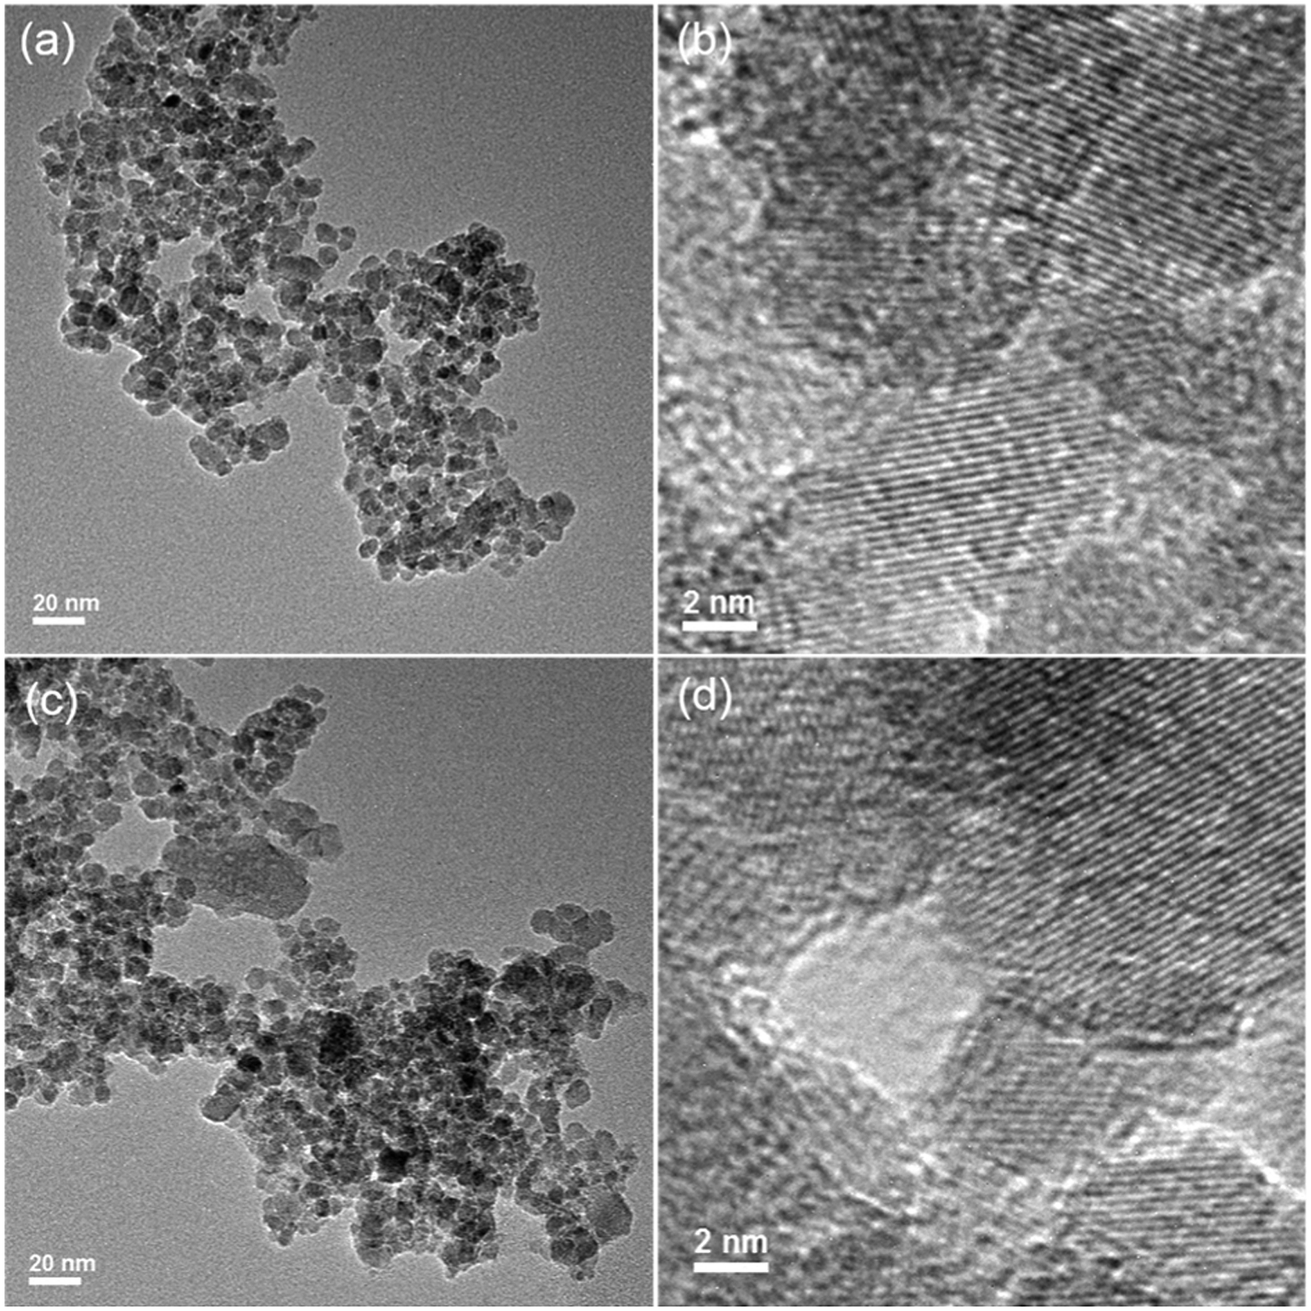 | ||
| Fig. 8 TEM images of Fe3O4:S NPs before and after As(V) adsorption. (a and b) TEM and the corresponding HR-TEM image of Fe3O4:S NPs; (c and d) TEM image and the corresponding HR-TEM image of Fe3O4:S NPs after adsorption. Experimental conditions were the same as above. | ||
The FTIR spectra of Fe3O4:S NPs before and after As(V) adsorption are shown in Fig. 9. For the sample before adsorption, it can be seen that the broad peak at wavenumbers 3402 cm−1 represents –OH stretching vibration, and the peak at 1621 cm−1 represents –OH bending vibration.49 They exhibit certain changes at 3420 cm−1 and 1633 cm−1 after As(V) adsorption, respectively. A strong peak at 1041 cm−1 was observed from the sample before adsorption, which was assigned to the bending vibration of hydroxyl group (Fe–OH),50,51 and it evidently weakened after adsorption, which might be attributed to the involvement of the Fe–OH groups in the adsorption process. The peak at 566 cm−1 represented Fe–O vibration.29 After As(V) adsorption, it had a small shift at 577 cm−1. In addition, a new peak at 822 cm−1 occurred, which corresponded to the stretching vibration of As–O.51 According to these changes in Fe3O4:S NPs after As(V) adsorption, it was confirmed that As(V) was adsorbed onto the adsorbent and Fe–OH played a significant role in the adsorption process.52
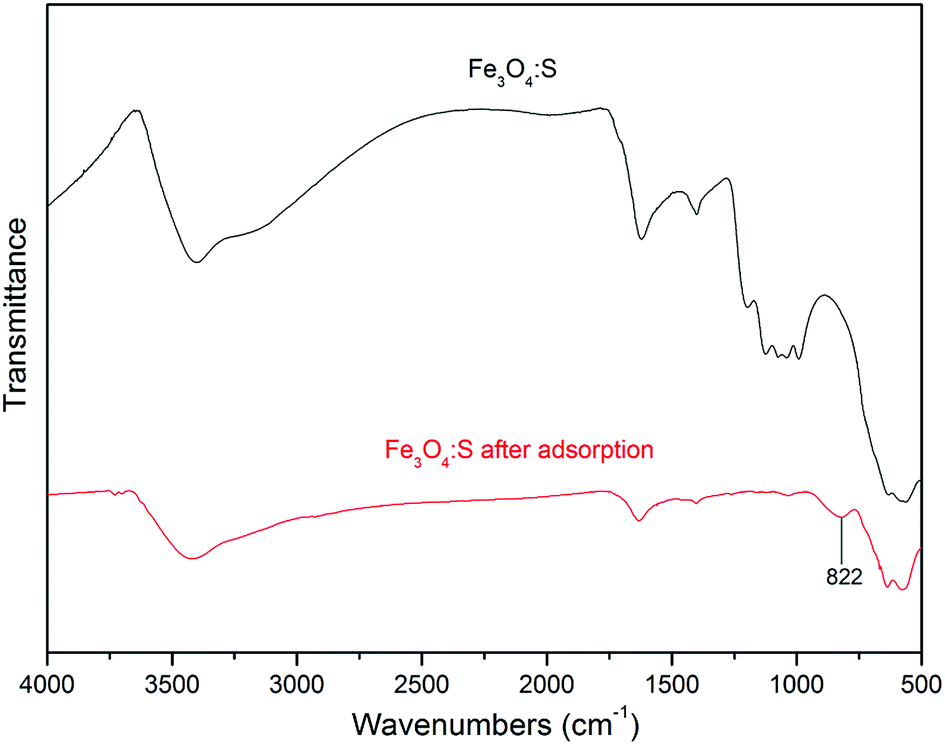 | ||
| Fig. 9 FTIR spectra of Fe3O4:S NPs before and after As(V) adsorption. Experimental conditions were the same as above. | ||
In addition, we observed the surface structure of Fe3O4:S NPs before and after As(V) adsorption by XPS analysis. The XPS spectra of the survey scan and As3d are shown in Fig. 10(a) and (b), respectively. As shown in Fig. 10(a), the detected As species confirms that As was successfully adsorbed on the Fe3O4:S NPs. In the high resolution XPS spectra of As3d (Fig. 10(b)), the adsorbed As on Fe3O4:S NPs was mainly assigned to As(V), since the peak at 45.5 eV for As(V) is much higher than that at 44.9 eV for As(III). As shown in Fig. 10(a), the peak of S2p nearly disappeared after As(V) adsorption. The weight percentage of Fe, O, S, and As before and after adsorption measured by XRF are summarized in Table 4. As shown in Table 4, the amount of S in Fe3O4:S NPs after adsorption decreased to a large extent, which was consistent with the XPS spectrum. Considering the above-mentioned Fe release and the sulfur decrease in Fe3O4:S NPs after adsorption, we believe that the main role of sulfur was to break the magnetite structure in order to activate the Fe atoms and to acquire more Fe–OH absorption sites for As(V) adsorption.53
 | ||
| Fig. 10 (a) Full-range XPS spectra of Fe3O4:S before and after As(V) adsorption; (b) As XPS spectra of Fe3O4:S before and after adsorption. Experimental conditions were the same as above. | ||
| Sample | Fe | O | S | As |
|---|---|---|---|---|
| Fe3O4:S | 64.98 | 33.23 | 1.78 | — |
| Fe3O4:S after adsorption | 63.66 | 33.29 | 0.24 | 2.79 |
Magnetic properties of Fe3O4:S NPs and Fe3O4 NPs are presented in Fig. 11. The saturation magnetization of Fe3O4 NPs was 51.4 emu g−1, and the saturation magnetization of Fe3O4:S NPs before and after adsorption were 37.1 emu g−1 and 39.9 emu g−1 with an external magnetic field at 3 T, respectively. The increase in saturation magnetization after adsorption might be attributed to the loss of sulfur during the adsorption process. Herein, Fe3O4:S NPs could be separated efficiently from aqueous solution after the adsorption of As(V) with an external magnetic field, which would be beneficial for their application. Separation experiments were conducted as shown in Fig. S1.† The adsorbent was dispersed in aqueous solution under continuous stirring. After adsorption, it took a long time for the adsorbent to precipitate naturally (Fig. S1(b)†). However, the separation process of magnetic Fe3O4:S nanoparticles was conducted effectively within a few minutes with the help of an external magnetic field (Fig. S1(c)†).
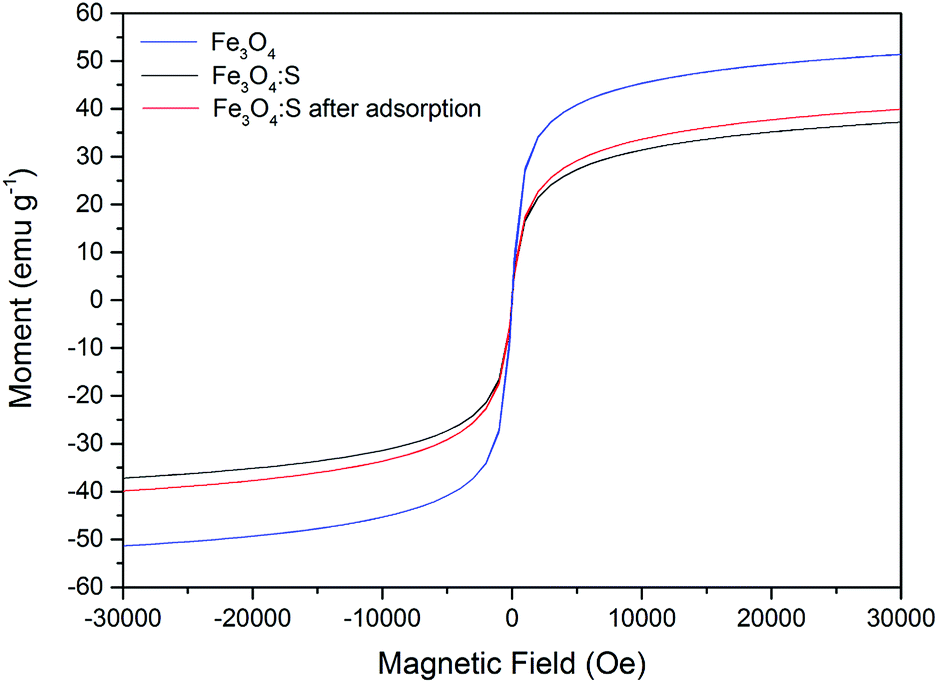 | ||
| Fig. 11 Magnetization curves of Fe3O4:S before and after As(V) adsorption. Experimental conditions were the same as above. | ||
4. Conclusions
An iron-based adsorbent, sulfur-doped Fe3O4 nanoparticles were prepared for the removal of As(V). Batch adsorption experiments indicated that the Fe3O4:S NPs show a highly efficient removal of As(V) compared with undoped Fe3O4 NPs. The pseudo-second-order kinetic model fitted well (R2 = 0.999) for As(V) adsorption. The Langmuir isotherm model was much more accurate (R2 = 0.990) than the Freundlich model in describing the As(V) adsorption process. XPS and FTIR spectra of Fe3O4:S NPs before and after adsorption proved that the adsorption of As(V) was through the Fe–OH adsorption site, in which As(V) replaced the –OH group and formed stable Fe arsenates. The main role of sulfur doping was believed to affect the magnetite structure and activate the Fe atoms to acquire more Fe–OH absorption sites. Besides, the adsorbent could be efficiently separated from the As(V) solution with an external magnetic field. Thus, Fe3O4:S NPs have considerable potential for As(V) adsorption in wastewater.Conflicts of interest
There are no conflicts to declare.Acknowledgements
This work is supported by the Major National Science and Technology Special Project of Water Pollution Control and Remediation (2017ZX07202) and National Natural Science Foundation of China (21773155).References
- B. K. Mandal and K. T. Suzuki, Talanta, 2002, 58, 201–235 CrossRef CAS
.
- W. R. Cullen and K. J. Reimer, Chem. Rev., 1989, 89, 713–764 CrossRef CAS
- P. Bhattacharya, A. H. Welch, K. G. Stollenwerk, M. J. McLaughlin, J. Bundschuh and G. Panaullah, Sci. Total Environ., 2007, 379, 109–120 CrossRef CAS PubMed
- M. M. Hassan, Arsenic in Groundwater: Poisoning and Risk Assessment, Crc Press, 2018 Search PubMed
- W. Ma, Y. Lin and Z. X. Feng, China J. Mod. Med., 2018, 13, 29–32 Search PubMed
- S. Loewenberg, Lancet, 2016, 388, 2336–2337 CrossRef
- S. Kapaj, H. Peterson, K. Liber and P. Bhattacharya, Environ. Lett., 2006, 41, 2399–2428 CAS
- J. Q. Jiang, Water Sci. Technol., 2001, 44, 89–98 CrossRef CAS PubMed
- J. M. Borgoño, P. Vicent, H. Venturíno and A. Infante, Environ. Health Perspect., 1977, 19, 103 Search PubMed
- M. Berg, H. C. Tran, T. C. Nguyen, H. V. Pham, R. Schertenleib and W. Giger, Environ. Sci. Technol., 2001, 35, 2621–2626 CrossRef CAS PubMed
- P. N. Williams, M. Lei, G. Sun, Q. Huang, Y. Lu, C. Deacon and Y. G. Zhu, Environ. Sci. Technol., 2009, 43, 637–642 CrossRef CAS PubMed
- H. A. Michael, Science, 2013, 341, 852–853 CrossRef CAS PubMed
- H. Guo, Y. Wang, G. M. Shpeizer and S. Yan, J. Environ. Sci. Health, Part A: Toxic/Hazard. Subst. Environ. Eng., 2003, 38, 2565–2580 CrossRef
- L. Zhang and C. Chen, J. Hyg. Res., 1997, 26, 310–313 CAS
- X. Guo, Z. Wu and M. He, Water Res., 2009, 43, 4327–4335 CrossRef CAS PubMed
- L. Ruixia, G. Jinlong and T. Hongxiao, J. Colloid Interface Sci., 2002, 248, 268–274 CrossRef PubMed
- H. S. Altundoğan, S. Altundoğan, F. Tümen and M. Bildik, Waste Manag., 2002, 22, 357–363 CrossRef
- WHO, Guidelines for drinking-water quality. Volume 2: health criteria and other supporting information, 2nd edn, USA, 1996 Search PubMed
- A. Audhya, M. Foti and S. D. Emr, Int. Conf. Mater. Renewable Energy Environ., 2011, 2, 1213–1216 Search PubMed
- Y. Chammui, P. Sooksamiti, W. Naksata, S. Thiansem and O. A. Arqueropanyo, Chem. Eng. J., 2014, 240, 202–210 CrossRef CAS
- USEPA, Technologies and Costs for Removal of Arsenic from Drinking Water, Books Llc, 2012 Search PubMed
- Y. Meng, J. N. Wang, C. Cheng, X. Yang and A. M. Li, Chin. Chem. Lett., 2012, 23, 863–866 CrossRef CAS
- S. Goldberg and C. T. Johnston, J. Colloid Interface Sci., 2001, 234, 204–216 CrossRef CAS
- Y. Bai, T. Yang, J. Liang and J. Qu, Water Res., 2016, 98, 119–127 CrossRef CAS PubMed
- M. L. Pierce and C. B. Moore, Water Res., 1982, 16, 1247–1253 CrossRef CAS
- L. Yan, S. Hu and C. Jing, J. Environ. Sci., 2016, 49, 74–85 CrossRef PubMed
- N. Horzum, M. M. Demir, M. Nairat and T. Shahwan, RSC Adv., 2013, 3, 7828–7837 RSC
- H. H. Li, W. F. Yan, Q. Liang, E. Zheng-yang and K. J. Ge, Nat., Environ. Pollut. Technol., 2017, 16, 627–632 CAS
- H. Genç-Fuhrman, J. C. Tjell and D. McConchie, Environ. Sci. Technol., 2004, 38, 2428–2434 CrossRef
- G. T. Burstein, Mineral. Mag., 1997, 61, 740–741 CrossRef
- T. H. Hsia, S. L. Lo, C. F. Lin and D. Y. Lee, Colloids Surf., A, 1994, 85, 1–7 CrossRef CAS
- J. A. Muñoz, A. Gonzalo and M. Valiente, Environ. Sci. Technol., 2002, 36, 3405–3411 CrossRef
- X. Huang, L. Kong, S. Huang, M. Liu and L. Li, Sci. China: Chem., 2018, 61, 164–171 CrossRef CAS
- Y. Zhang, M. Yang and X. Huang, Chemosphere, 2003, 51, 945–952 CrossRef CAS PubMed
- L. Kong, L. Yan, Z. Qu, N. Yan and L. Li, J. Mater. Chem. A, 2015, 3, 15755–15763 RSC
- C. Ling, F. Q. Liu, C. Xu, T. P. Chen and A. M. Li, ACS Appl. Mater. Interfaces, 2013, 5, 11808–11817 CrossRef CAS PubMed
- Y. S. Ho and G. McKay, Process Biochem., 1999, 34, 451–465 CrossRef CAS
- Y. Li, Q. Du, X. Wang, P. Zhang, D. Wang, Z. Wang and Y. Xia, J. Hazard. Mater., 2010, 183, 583–589 CrossRef CAS PubMed
- M. M. Motsa, B. B. Mamba, J. M. Thwala and T. A. Msagati, J. Colloid Interface Sci., 2011, 359, 210–219 CrossRef CAS PubMed
- M. Dastkhoon, M. Ghaedi, A. Asfaram, A. Goudarzi, S. M. Langroodi, I. Tyagi and V. K. Gupta, Sep. Purif. Technol., 2015, 156, 780–788 CrossRef CAS
- G. Mckay, H. S. Blair and J. R. Gardner, J. Appl. Polym. Sci., 1982, 27, 3043–3057 CrossRef CAS
- A. S. K. Kumar and S. J. Jiang, J. Environ. Chem. Eng., 2016, 4, 1698–1713 CrossRef CAS
- L. Feng, M. Cao, X. Ma, Y. Zhu and C. Hu, J. Hazard. Mater., 2012, 217, 439–446 CrossRef PubMed
- J. Lan, Res. Chem. Intermed., 2015, 41, 3531–3541 CrossRef CAS
- S. A. Baig, T. T. Sheng, C. Sun, X. Xue, L. Tan and X. Xu, PLoS One, 2014, 9, e100704 CrossRef PubMed
- S. A. Wasay, S. Tokunaga and S. W. Park, Sep. Sci. Technol., 1996, 31, 1501–1514 CrossRef CAS
- SEPA, Emission standards of pollutants for secondary copper, aluminum, lead and zink industry (GB31574-2015), Beijing, 2015 Search PubMed
- SEPA, Environmental quality standards for surface water (GB3838-2002), Beijing, 2002 Search PubMed
- J. D. Russell, Clay Miner., 1979, 14, 109–114 CrossRef CAS
- J. T. Keiser, C. W. Brown and R. H. Heidersbach, J. Electrochem. Soc., 1982, 129, 2686–2689 CrossRef CAS
- K. Nakamoto, Infrared and Raman spectra of inorganic and coordination compounds, 1978 Search PubMed
- S. Tokunaga, M. J. Haron, S. A. Wasay, K. F. Wong, K. Laosangthum and A. Uchiumi, Int. J. Environ. Stud., 1995, 48, 17–28 CrossRef
- Y. Zhang, M. Yang, X. M. Dou, H. He and D. S. Wang, Environ. Sci. Technol., 2005, 39, 7246–7253 CrossRef CAS PubMed
Footnote |
| † Electronic supplementary information (ESI) available: XRD patterns of Fe3O4 NPs and Fe3O4:S NPs. EDX patterns of Fe3O4 NPs and Fe3O4:S NPs. See DOI: 10.1039/c8ra08699k |
| This journal is © The Royal Society of Chemistry 2018 |