 Open Access Article
Facile synthesis of a flame retardant melamine phenylphosphate and its epoxy resin composites with simultaneously improved flame retardancy, smoke suppression and water resistance
Yilun Shia,
Zhengzhou Wang *ab and
Jian-an Zhouc
aSchool of Materials Science and Engineering, Tongji University, Shanghai 201804, People's Republic of China. E-mail: zwang@tongji.edu.cn
bKey Laboratory of Advanced Civil Engineering Materials (Tongji University), Ministry of Education, Shanghai 201804, People's Republic of China
cState Key Laboratory of Refractories & Metallurgy, Wuhan University of Science and Technology, Wuhan, Hubei 430081, People's Republic of China
First published on 23rd November 2018
Abstract
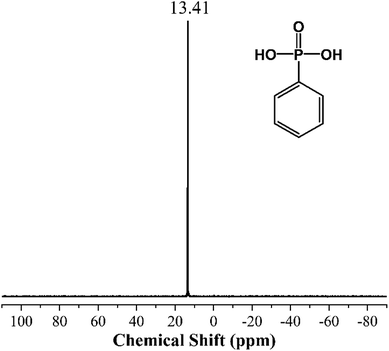
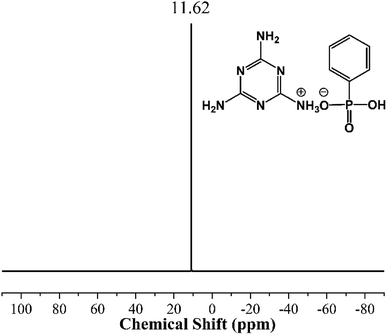
A flame retardant melamine phenylphosphate (MPhP) was facilely synthesized by the reaction of phenylphosphoric acid (PPA) and melamine (MEL), and was characterized by FTIR and NMR. Epoxy resin (EP) composites containing MPhP were prepared, and the effect of MPhP content on flame retardancy, smoke suppression, mechanical properties and thermal stability of the composites was investigated. It is observed that the LOI of the EP composite with 20 wt% MPhP (EP/MPhP20) is 26.5%, and the composite EP/MPhP20 reaches a UL 94 V-0 rating. Cone calorimeter test results show that the peak heat release rate, total heat release and total smoke release of EP/MPhP20 decrease by 51%, 34%, and 24%, respectively compared with those of pure EP. The flame retardancy of the EP/MPhP composites after the water treatment at 80 °C for 72 h is basically maintained, indicating that the composites have good water resistance. The mechanical strengths of the EP/MPhP composites decrease gradually with an increase in the MPhP content. Moreover, the thermal stability of the EP/MPhP composites was studied.
Introduction
Epoxy resin (EP) is one of the most commonly used thermoset polymers because of its excellent mechanical properties, chemical stability, corrosion resistance and adhesion. It is widely used as composites, adhesives, coatings, and so on. However, the LOI of EP is only 20–21%, which restricts its use in some applications.1–5The incorporation of halogen-containing compounds as additives into EP has been proven to be a very effective method to improve its fire resistance. However, the corrosive and toxic gases (such as hydrogen halides, dibenzodioxins and dibenzofurans) and the large amount of fumes generated during combustion limit the applications of halogen-containing flame retardants.6,7 In this situation, halogen-free flame retardation of EP is of great importance.
The commonly used halogen-free flame retardants for EP include phosphorus-containing compounds, nitrogen-containing compounds, phosphorus- and nitrogen-containing compounds, silicone-containing compounds etc.8–13 They can generally be divided into two categories: organic and inorganic compounds. As for organic halogen-free flame retardants, organic phosphonic acids and their derivatives are widely used in EP. For example, 9,10-dihydro-9-oxa-10-phosphaphenanthrene-10-oxide (DOPO) is commonly used in EP because it has reactive P–H bond, which can react with many kinds of groups including epoxide groups in EP.14,15 For example, Perret et al. prepared DOPO-based flame retardants, DOPP and DOPI, and found that the LOI of the EP composites with 20 wt% DOPP and 23 wt% DOPI reach up to 37.9% and 34.2%, respectively, and the peak heat release rate of the composites decrease by 31% and 49%, respectively and total heat release 40% and 44%, respectively, compared with the ones of pure EP resin.11 It was reported that a flame retardant TGIC–DOPO prepared by the reaction of DOPO and triglycidyl isocyanurate (TGIC) had good flame retardancy, and the LOI of the EP composite with 10 wt% TGIC–DOPO reached to 35.2%.12 Zhang et al. observed that polyhedral oligomeric silsesquioxanes containing DOPO (DOPO–POSS) and octaphenyl polyhedral oligomeric silsesquioxane/DOPO (OPS/DOPO) were effective flame retardants in EP, and the EP composite containing 2.5 wt% DOPO–POSS and 1.1/1.8 wt% OPS/DOPO can pass UL-94 V-0 test, with a LOI of 32.7% and 35%, respectively.13
Ammonium polyphosphate (APP), a commonly used inorganic phosphorus- and nitrogen-containing compound, is also an effective flame retardant in EP. Wang et al. investigated the effect of APP on flame retardancy of low molecular weight polyamide (LWPA) cured epoxy resin (diglycidyl ether of bisphenol A), and found that the LOI values of the epoxy resins containing 15 wt% APP increased from 29.6% to 32.0% with a decrease in the content of LWPA from 28.3 wt% to 19.6 wt%, but the FR cured epoxy resins all passed UL 94 V-0 rating.16 Tan and co-workers prepared a piperazine-modified APP (PAz-APP) as a flame retardant hardener for EP, and they found that EP/PAz-APP composites have much better flame retardancy than EP/Paz.17 Song et al. prepared EP composites containing APP and lanthanum trioxide (La2O3), and their results show that the EP composite with 20 wt% of APP can reach UL 94 V-0 rating and the addition of La2O3 in EP/APP composites led to formation of more compact char.18
Nevertheless, APP is easily attacked by water and exuded, which leads to in a decrease in the flame retardancy of its flame retarded polymer composites during their service life.19 In order to overcome this problem, Liu et al. used epoxy resin as a shell material to prepare microencapsulated APP (MCAPP), and found that the solubility of MCAPP in water at 25 °C and 80 °C was much lower than the one of APP, and that the water resistance and mechanical properties of the EP/MCAPP composites improved a lot in comparison with those of the EP/APP composites.20 Tang et al. observed that APP microencapsulated with glycidyl methacrylate (GMA) improved its hydrophobicity and the flame retardancy of the EP composite containing the microencapsulated APP was better than the one of the EP/APP composite at the same additive content.21
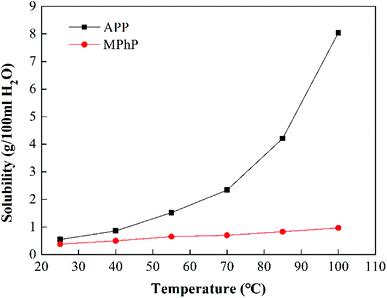
In fact, flame retardants with lower water solubility, excellent flame retardancy and better compatibility with EP are anticipated. In this study, a phosphorus and nitrogen-containing flame retardant named melamine phenylphosphate (MPhP) was synthesized by the reaction of melamine and an organic phosphorus-containing acid, i.e. phenylphosphonic acid. The water resistance of MPhP was investigated through the test of solubility. The effect of MPhP on flame retardancy, mechanical properties, hot water resistance and thermal stability of epoxy resin was investigated in this work.
Experimental
Materials
Phenylphosphoric acid (PPA), analytical grade, was purchased from Sinopharm Chemical Reagent Co., Ltd. Melamine (MEL), analytical grade, was purchased from Anhui Hongsifang Co., Ltd. Epoxy resin (E-51) with an epoxy equivalent weight (EEW) of 186 g eq.−1, was purchased from Sinopec Group Company. Curing agent (T-31) was a commercial product with an amine value of 520 mg KOH per g. Defoamer (BYK-A530) was purchased from BYK Additives & Instruments.Preparation of melamine phenylphosphate (MPhP)
First, 32 g of phenylphosphoric acid (PPA) was added into a 1000 ml three-necked flask equipped with a mechanical stirrer. Then 400 ml deionized water was added and continuously stirred until the PPA was completely dissolved. After that, 25.5 g melamine (MEL) (the molar ratio of PPA/MEL 1![[thin space (1/6-em)]](https://www.rsc.org/images/entities/char_2009.gif) :
:![[thin space (1/6-em)]](https://www.rsc.org/images/entities/char_2009.gif) 1) was added into the above mixture afterwards, the temperature of the resultant solution was raised to 95 °C and maintained at that temperature for 4 h. Finally, the resultant product was filtered, washed several times with hot deionized water and dried, and the white powder MPhP was obtained. The synthetic route of MPhP is shown in Fig. 1.
1) was added into the above mixture afterwards, the temperature of the resultant solution was raised to 95 °C and maintained at that temperature for 4 h. Finally, the resultant product was filtered, washed several times with hot deionized water and dried, and the white powder MPhP was obtained. The synthetic route of MPhP is shown in Fig. 1.
Preparation of EP and the EP/MPhP composites
To prepare the samples, EP was mixed with MPhP according to the formulations in Table 1. And a defoamer (0.5 wt% of the total amount of epoxy resin and curing agent) was added to EP. After being mixed uniformly, the mixture was thoroughly mixed with the curing agent T-31 (35 wt% of the epoxy resin) and poured into polytetrafluoroethylene (PTFE) molds for curing. After curing for 1 h at 25 °C and for 3 h at 70 °C, MPhP-modified epoxy resin samples were obtained.| Sample code | EP (wt%) | Curing agent (wt%) | MPhP (wt%) |
|---|---|---|---|
| EP0 | 74.1 | 25.9 | 0 |
| EP/MPhP5 | 70.4 | 24.6 | 5.0 |
| EP/MPhP10 | 66.7 | 23.3 | 10.0 |
| EP/MPhP15 | 63.0 | 22.0 | 15.0 |
| EP/MPhP20 | 59.3 | 20.7 | 20.0 |
| EP/MPhP25 | 55.6 | 19.4 | 25.0 |
Characterization
Fourier transform infrared (FTIR) spectra were performed on a Hyperion 2000 instrument (Bruker Optics, Germany). The spectral range is 7500–370 cm−1, and resolution is less than 0.5 cm−1.Nuclear magnetic resonance (NMR) analysis was measured by AVANCE III NMR instrument (Bruker, Switzerland) to detect phosphorus spectrum (31P NMR) of the samples which were dissolved in deuterated dimethyl sulfoxide (d6-DMSO).
The limiting oxygen index (LOI) was measured with a sample dimension of 100 × 6.5 × 3 mm3 according to GB/T 2406-2009 standard.
Vertical burning tests (UL-94) were performed on a CZF-3 vertical combustion tester (Jiangning Analytical Instrument Factory, China) according to GB/T 2408-2008, and the sample dimension was 125 × 13 × 3 mm3.
Cone calorimeter (CC) tests were measured on a cone calorimeter (Fire Testing Technology) at a heat flux of 35 kW m−2 with a sample dimension of 100 × 100 × 3 mm3 according to ISO 5660 standard.
Thermogravimetric (TG) analysis was carried out on a STD Q600 thermal gravimetric analyzer (TA, USA) at a heating rate of 10 °C min−1 under nitrogen atmosphere.
Scanning electron microscopy (SEM) was conducted by S-4800 instrument (Hitachi, Japan) to characterize the fracture surface morphology of pure EP and the EP/MPhP composites before and after boiling. The samples were previously coated with a conductive layer of gold.
The tensile strength was measured by CMT5105 universal testing machine with test part dimension of 80 × 10 × 4 mm3 according to GB/T 1040-2006 standard, and at least five samples were tested to get an average value. The impact strength was measured by SANS E21 pendulum impact testing machine with dimension of 80 × 10 × 4 mm3 according to GB/T 1043-2008 standard, and at least five samples were tested to get an average value.
Results and discussion
Characterization of MPhP
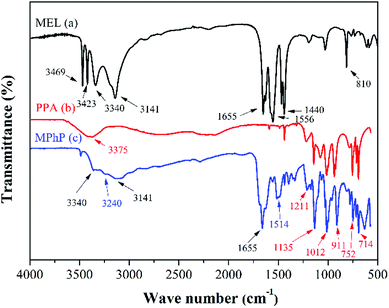
![[double bond, length as m-dash]](https://www.rsc.org/images/entities/char_e001.gif) O, and the peaks at 1012 cm−1 and 911 cm−1 are attributed to the stretching vibration of P–O.25–28 In addition, the peaks at 752 cm−1 and 714 cm−1 are the absorptions of C–H on the phenyl rings. As for the FTIR of MPhP (Fig. 2c), the peaks at 3340 cm−1 and 3141 cm−1 attributed to the stretching vibration of N–H with hydrogen bonds still can be found. The peak at 1655 cm−1 attributed to the deformation vibration of N–H still exists, and the typical absorptions from the triazine rings also exist. The disappearance of the peaks at 3469 cm−1 and 3423 cm−1 and the new adsorption peak at 3240 cm−1 indicate the formation of NH3+.29,30
O, and the peaks at 1012 cm−1 and 911 cm−1 are attributed to the stretching vibration of P–O.25–28 In addition, the peaks at 752 cm−1 and 714 cm−1 are the absorptions of C–H on the phenyl rings. As for the FTIR of MPhP (Fig. 2c), the peaks at 3340 cm−1 and 3141 cm−1 attributed to the stretching vibration of N–H with hydrogen bonds still can be found. The peak at 1655 cm−1 attributed to the deformation vibration of N–H still exists, and the typical absorptions from the triazine rings also exist. The disappearance of the peaks at 3469 cm−1 and 3423 cm−1 and the new adsorption peak at 3240 cm−1 indicate the formation of NH3+.29,30
Effect of MPhP on flame retardancy of the EP/MPhP composites
The flame retardancy of the EP/MPhP composites was characterized by limiting oxygen index (LOI) and UL-94 vertical burning test, and the test results are listed in Table 2. The LOI of pure EP is 20.5%. The LOI values of the EP/MPhP composites increase with an increase in the MPhP content. When the loading of MPhP is 20 wt% and 25 wt%, the LOI values of the EP/MPhP composites (samples EP/MPhP20 and EP/MPhP25) reach to 26.5% and 27.5%, respectively. Moreover, both sample EP/MPhP20 and sample EP/MPhP25 pass the UL-94 V-0 rating. The flame retardant mechanism of MPhP in EP may be due to the following two aspects. On one hand, MPhP decomposes on heating to form non-combustible gases such as N2 and NH3, which dilute the combustible gases and oxygen in the gas phase. On the other hand, the phosphorus-containing acids generated during the decomposition of MPhP promote EP to form carbonaceous char.17,35| Sample | LOI (%) | UL-94 |
|---|---|---|
| EP0 | 20.5 | NR |
| EP/MPhP5 | 22.5 | NR |
| EP/MPhP10 | 23.5 | NR |
| EP/MPhP15 | 24.5 | V-1 |
| EP/MPhP20 | 26.5 | V-0 |
| EP/MPhP25 | 27.5 | V-0 |
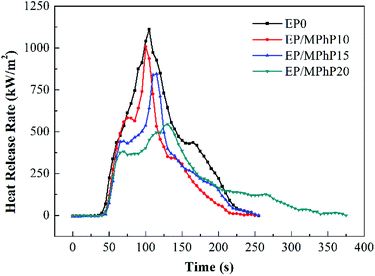
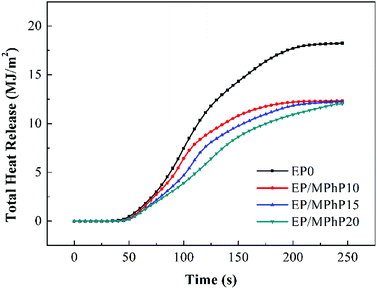
Cone calorimeter (CC) is a very useful method to study the combustion behavior of flame retardant polymers.36 Heat release rate (HRR), characterized by heat release at per unit surface area of burning materials has a great influence on fire hazard.37 HRR curves of pure EP resin and the EP/MPhP composites are shown in Fig. 6. Peak HRR (PHRR) of pure EP resin is about 1111 kW m−2. The PHRR values of the EP/MPhP composites decrease with an increase in the MPhP content. For example, the PHRR values of the EP/MPhP composites with 15% and 20% MPhP decrease by 24% and 51%, respectively. Total heat release (THR) curves of pure EP resin and the EP/MPhP composites are shown in Fig. 7. And THR values of the EP/MPhP composites also decrease compared with the one of the pure resin. Moreover, the time to ignition (TTI) of the EP/MPhP composites is all higher than that of the pure resin, which indicates that the combustion of the EP/MPhP composites is prolonged in comparison with pure EP resin. As for smoke release during the combustion, it is seen from the Table 3 that total smoke release (TSR) of the EP/MPhP composites decreases with an increase in the MPhP loading. From Fig. 6, it can be found that pure EP resin has one HRR peak, while the EP/MPhP composites burn with two HRR peaks, which is similar to some intumescent flame retardant systems.38–41 The first peak is usually caused by the combustion of polymer resins, and the second peak may be due to the further cracking and effective pyrolysis of formed char.42
| Sample code | TTIa (s) | PHRR (kW m−2) | THR (MJ m−2) | TSR (m2 m−2) |
|---|---|---|---|---|
| a TTI: Time to ignition; PHRR: peak of heat release rate; THR: total heat release; TSR: total smoke release. | ||||
| EP0 | 32 | 1111 ± 50 | 18.2 ± 0.3 | 3457 ± 300 |
| EP/MPhP10 | 38 | 1008 ± 50 | 12.4 ± 0.3 | 2901 ± 300 |
| EP/MPhP15 | 40 | 846 ± 50 | 12.2 ± 0.3 | 2640 ± 300 |
| EP/MPhP20 | 41 | 545 ± 50 | 12.0 ± 0.3 | 2623 ± 300 |
The SEM images of the residues of pure EP and the EP/MPhP composites are shown in Fig. 8. From Fig. 8a, it can be seen that there are only few char crumbs on the surface of the char layers and the char crumbs are non-continuous. When MPhP is added into the EP resin, the char becomes thicker and more compact with the increase in the MPhP content (from Fig. 8b to d). The compact char layers can form protective shields on the surface of EP composites to limit the transfer of heat and flammable compounds.16 Therefore, the PHRR, THR and TSR values of the EP/MPhP composites are reduced.
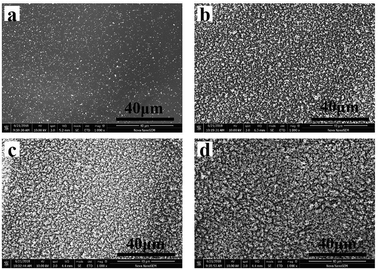 | ||
| Fig. 8 SEM micrographs of the residue chars after the CC test: (a) EP0; (b) EP/MPhP10; (c) EP/MPhP15; (d) EP/MPhP20. | ||
Water resistance of the EP/MPhP composites
In order to investigate water resistance of the EP/MPhP composites, samples of the composites were immersed into hot water at 80 °C for 72 h. The LOI values and UL-94 ratings of the samples after the water treatment are listed in Table 4. It can be seen from Table 4 that the LOI values of the EP/MPhP composites after the treatment changed little compared with the values of the corresponding untreated composites (Table 2). Moreover, UL-94 test results of the EP/MPhP composites before and after the treatment are the same. The above results indicate that the water treatment has little influence on the flame retardancy of the EP/MPhP composites.| Sample | LOI (%) | UL-94 |
|---|---|---|
| EP0 | 20.5 | NR |
| EP/MPhP5 | 22.0 | NR |
| EP/MPhP10 | 23.5 | NR |
| EP/MPhP15 | 24.0 | V-1 |
| EP/MPhP20 | 26.5 | V-0 |
| EP/MPhP25 | 27.5 | V-0 |
SEM was used to study the surface fracture of pure EP resin (EP0) and the EP/MPhP20 composite after the hot water treatment, and its micrographs are shown in Fig. 9. As for pure EP resin, a smooth fracture surface with river-like lines can be observed (Fig. 9a), which shows a typical characteristic of brittle fracture.43 The fracture surface of pure EP after the treatment (Fig. 9b) remains the same, indicating that epoxy resin itself has good water resistance. It is due to the high crosslinking degree of the resin, which leads to a good sealing property and makes it less susceptible to water erosion.44 The fracture surface of the untreated EP/MPhP20 composite (Fig. 9c) is much rougher compared with EP0, and the cracks are tortuous and nonlinear.45 It can be seen that some MPhP particles are located onto the fracture surface of the composite. The result suggests that the addition of MPhP changes the stress distribution and leads to local stress concentration during stress, resulting in disturbing the oriented fracture patterns of epoxy. This phenomenon was observed in some other publications.21 The morphology of the treated EP/MPhP20 composite (Fig. 9d) is quite similar to the one of the untreated EP/MPhP20 composite. After the water treatment, the MPhP particles are still on the fracture surface of the composite, indicating that the EP/MPhP composite has good resistance of water, which may be due to the existence of P–C bonds in MPhP: the P–C bonds are hydrolysis resistant, and thus they reduce the influence of water in some aspects.46
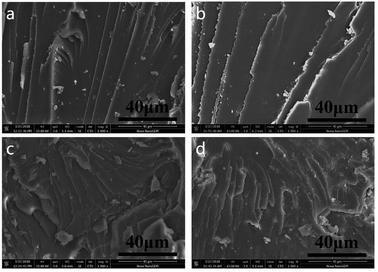 | ||
| Fig. 9 SEM micrographs of fracture surfaces: (a) pure EP; (b) pure EP (treated in 80 °C water for 72 h); (c) EP/MPhP20; (d) EP/MPhP20 (treated in 80 °C water for 72 h). | ||
Effect of MPhP on mechanical properties of the EP/MPhP composites
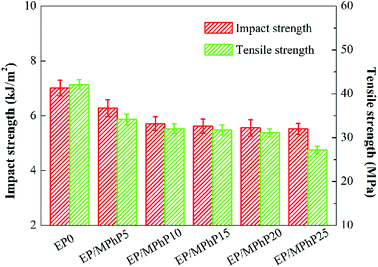
Fig. 10 shows the impact and tensile strengths of pure EP and the EP/MPhP composites. The impact and tensile strengths of pure EP is 7.0 kJ m−2 and 42.1 MPa, respectively. The strengths of the EP/MPhP composites decrease gradually with an increase in the MPhP content. For example, the impact strength and the tensile strength of EP/MPhP20 composite decrease 20.7% and 26.0%, respectively compared with those of pure EP. The decrease of the mechanical strengths is possibly due to the weak interfacial interaction between MPhP particles and EP matrix, which makes the particles easy to be separated at the interface under external force.47 Moreover, the viscosity of EP composites increases with the increase of MPhP content, and thus the particles cannot be evenly dispersed in EP matrix, causing obvious stress concentration in the EP/MPhP composites, which results in a decrease in the mechanical properties of the EP/MPhP composites under the external force.48Thermal decomposition of the EP/MPhP composites
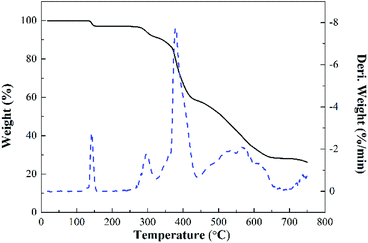
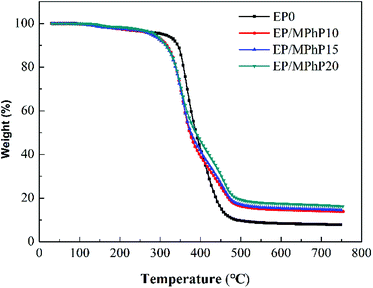
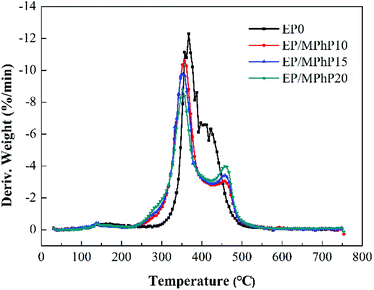
Fig. 11 shows the TG and DTG curves of MPhP. It can be seen from DTG curve that MPhP has four distinctive decomposition stages. The first stage occurs between 140 °C and 160 °C, and the weight loss is approximately 2.9%, which may be due to the evaporation of bound water. The second stage occurring in the range 270–320 °C with a weight loss of 5.5%, which may be caused by the dehydration and deamination of the hydroxyl groups to form polyphosphates.49 As the temperature continues to increase, the decomposition of MPhP enters into the third stage. The maximum weight loss temperature is 378 °C, and the weight loss at this stage is about 22.7%. The main reason for the weight loss is due to the decomposition of the melamine's structure in MPhP molecules producing N2 and NH3. At the temperature above 450 °C, the phosphorus and nitrogen compounds produced at previous stages decompose further to form aromatic compounds.50Fig. 12 and 13 show the TG and DTG curves of pure EP and the EP/MPhP composites. The temperature of 10% weight loss (T10%), the mid-point temperature of the degradation (T50%), the temperature at the maximal weight loss rate (Tmax), and the weight of residue at 750 °C are summarized in Table 5. Pure EP has two steps of degradation under nitrogen atmosphere.51,52 The first step occurs before 300 °C, and the degradation is due to the elimination of hydrated water. The second step happens in the range 300–500 °C with a Tmax of 367 °C, and the weight loss is 30.1%, which is caused by the chain scission of isopropylidene linkages releasing small molecule products.15
| Sample | T10% (°C) | T50% (°C) | Tmax (°C) | Residue at 750 °C (%) |
|---|---|---|---|---|
| EP0 | 342 | 388 | 367 | 7.8 |
| EP/MPhP10 | 313 | 371 | 357 | 13.9 |
| EP/MPhP15 | 313 | 374 | 353 | 14.5 |
| EP/MPhP20 | 313 | 387 | 352 | 16.2 |
The degradation of the EP/MPhP composites has two steps. Compared with pure EP, the EP/MPhP composites decompose earlier at lower temperatures, which is mainly due to the decomposition of MPhP. Although T10%, T50%, and Tmax of the EP/MPhP composites are lower than the values of pure EP resin, the rates of the decomposition of the EP/MPhP composites slow down in the range 400–500 °C, and the residue left at 750 °C increases significantly. The weight of residue at 750 °C for EP/MPhP20 is 16.2%, which is about 2 times higher than that of EP.
Conclusions
In this paper, a flame retardant melamine phenylphosphate (MPhP) was successfully synthesized, and characterized by FTIR and NMR. MPhP has a lower water solubility compared with the commonly used APP. The effect of MPhP on flame retardancy, mechanical properties and water resistance of epoxy resin (EP) was investigated. The LOI values of the EP/MPhP composite increase with an increase in the MPhP content. The LOI of the EP composite containing 20 wt% MPhP (EP/MPhP20) is 26.5%, and the EP composite reaches to UL 94 V-0 rating. The LOI values of the EP/MPhP composites after the water treatment at 80 °C for 72 h are basically unchanged, and the UL 94 ratings are still maintained. The peak heat release rate, total heat release and total smoke release of EP/MPhP20 decrease by 51%, 34%, and 24%, respectively compared with those of pure EP. The impact and tensile strengths of the EP/MPhP composites decrease with an increase in the MPhP content. The incorporation of MPhP into EP leads to a decrease in the initial decomposition temperature and an increase in the residue at high temperatures.Conflicts of interest
There are no conflicts to declare.Acknowledgements
This work was financially supported by the National Natural Science Foundation of China (21174106).References
- F. Xiao, K. Wu, F. B. Luo, Y. Y. Guo, S. H. Zhang, X. X. Du, Q. Q. Zhu and M. G. Lu, J. Mater. Sci., 2017, 52, 13992–14003 CrossRef CAS.
- J. l. Zhuo, L. B. Xie, G. D. Liu, X. L. Chen and Y. G. Wang, J. Therm. Anal. Calorim., 2017, 129, 357–366 CrossRef CAS.
- W. Wang, Y. C. Kan, Y. Pan, Y. Yuan, L. M. Liew and Y. Hu, Ind. Eng. Chem. Res., 2016, 56, 1341–1348 CrossRef.
- Y. Wang, C. Yang, Q. X. Pei and Y. Zhang, ACS Appl. Mater. Interfaces, 2016, 8, 8272–8279 CrossRef CAS PubMed.
- Y. Xu, Y. Li, W. Hua, A. Zhang and J. Bao, ACS Appl. Mater. Interfaces, 2016, 8, 24131–24142 CrossRef CAS PubMed.
- X. M. Wen, B. G. Li and Y. L. Yin, Tianjin Chem. Ind., 2013, 27, 1–4 CAS.
- Y. X. Ou, X. M. Fang and Q. Shen, Fine Chem., 2007, 24, 1232–1235 CAS.
- R. K. Jian, P. Wang, W. Duan, J. S. Wang, X. L. Zheng and J. B. Weng, Ind. Eng. Chem. Res., 2016, 55, 11520–11527 CrossRef CAS.
- P. Müller, M. Morys, A. Sut, C. Jäger, B. Illerhaus and B. Schartel, Polym. Degrad. Stab., 2016, 130, 307–319 CrossRef.
- Q. Hu, P. R. Peng, S. Peng, J. Y. Liu, X. Q. Liu, L. Y. Zou and J. Chen, J. Therm. Anal. Calorim., 2016, 128, 1–10 Search PubMed.
- B. Perret, B. Scharte, K. Stöβ, M. Ciesielski, J. Diederichs, M. Döring, J. Krämer and V. Altstädt, Eur. Polym. J., 2011, 47, 1081–1089 CrossRef CAS.
- L. Qian, Y. Qiu and N. Sun, Polym. Degrad. Stab., 2014, 107, 98–105 CrossRef CAS.
- W. Zhang, X. Li and R. Yang, Polym. Degrad. Stab., 2014, 99, 118–126 CrossRef CAS.
- W. Yan, J. Yu, M. Q. Zhang, T. Wan, C. Z. Wen, S. H. Qin and W. J. Huang, J. Polym. Res., 2018, 25, 72 CrossRef.
- X. Wang, Y. Hu, L. Song, W. Y. Xing, H. D. Lu, P. Lv and G. X. Jie, Polymer, 2010, 51, 435–2445 Search PubMed.
- J. Wang, D. Wang, Y. Liu, X. Ge and Y. Wang, J. Appl. Polym. Sci., 2008, 108, 2644–2653 CrossRef CAS.
- Y. Tan, Z. B. Shao, L. X. Yu, J. W. Long, M. Qi, L. Chen and Y. Z. Wang, Polym. Chem., 2016, 7, 3003–3012 RSC.
- L. Song, K. Wu, Y. Wang, Z. Z. Wang and Y. Hu, J. Macromol. Sci., Part A: Pure Appl.Chem., 2009, 46, 290–295 CrossRef CAS.
- K. Wu, Z. Z. Wang and Y. Hu, Polym. Adv. Technol., 2010, 19, 1118–1125 CrossRef.
- L. Liu, Y. N. Zhang, L. Li and Z. Z. Wang, Polym. Adv. Technol., 2011, 22, 2403–2408 CrossRef CAS.
- Q. Tang, B. Wang, Y. Shi, L. Song and Y. Hu, Ind. Eng. Chem. Res., 2013, 52, 5640–5647 CrossRef CAS.
- Z. J. Zhang, X. J. Mei and L. R. Feng, Chin. J. Appl. Chem., 2003, 20, 1035–1038 CAS.
- R. B. Wang, Z. X. Ge, Z. L. Yao and H. L. Liu, Appl. Chem. Ind., 2009, 38, 1826–1827 CAS.
- P. M. Wang and Q. W. Xu, Material Research Methods, Science Press, Beijing, 2010 Search PubMed.
- S. Mahmoud, E. Bassam, N. D. Jamal, S. Amneh, K. Monther and E. Mohammad, Phosphorus Sulfur Silicon Relat. Elem., 2014, 189, 558–575 CrossRef.
- Z. Wahab, E. A. Foley, P. J. Pellechia, B. L. Anneaux and H. J. Ploehn, J. Colloid Interface Sci., 2015, 450, 301–309 CrossRef CAS PubMed.
- H. Nijs, A. Clearfield and E. F. Vansant, Microporous Mesoporous Mater., 1998, 23, 97–110 CrossRef CAS.
- J. Svoboda, V. Zima, L. Beneš, K. Melánová, M. Vlček and M. Trchová, J. Phys. Chem. Solids, 2008, 69, 1439–1443 CrossRef CAS.
- L. Costa and G. Camino, J. Therm. Anal., 1988, 34, 423–429 CrossRef CAS.
- S. Gao and G. Liu, J. Appl. Polym. Sci., 2018, 135, 46274 CrossRef.
- R. H. Ye, Y. Chen, Y. L. Liu, L. M. Zhu, Z. Q. Li, Y. F. Sun and W. L. Pan, J. Instrum. Anal., 2011, 30, 624–628 CAS.
- S. Jahromi, w. Gabriëlse and A. Braam, Polymer, 2003, 44, 25–37 CrossRef CAS.
- X. M. Fu, Y. Liu, Q. Wang, Z. J. Zhang, Z. Y. Wang and J. Y. Zhang, J. Macromol. Sci. Part D Rev. Polym. Process., 2011, 50, 1527–1532 CAS.
- W. Chen, L. Wang and G. Liu, Polym. Degrad. Stab., 2012, 97, 2567–2570 CrossRef CAS.
- B. Schartel, A. Weiß, F. Mohr, M. Kleemeier and A. Hartwig, J. Appl. Polym. Sci., 2010, 118, 1134–1143 CAS.
- M. L. Bras, M. Bugajny, J. Lefebvre and S. Bourbigot, Polym. Int., 2015, 49, 1115–1124 CrossRef.
- Y. Liu Y, C. L. Deng, J. Zhao, J. S. Wang, L. Chen and Y. Z. Wang, Polym. Degrad. Stab., 2011, 96, 363–370 CrossRef.
- S. Bourbigot, M. L. Bras, S. Duquesne and M. Rochery, Macromol. Mater. Eng., 2004, 289, 499–511 CrossRef CAS.
- M. J. Chen, X. Wang, X. L. Li, X. Y. Liu, L. Zhong, H. Z. Wang and Z. G. Liu, RSC Adv., 2017, 7, 35619–35628 RSC.
- J. S. Wang, Y. Liu, H. B. Zhao, J. Liu, D. Y. Wang, Y. P. Song and Y. Z. Wang, Polym. Degrad. Stab., 2009, 94, 625–631 CrossRef CAS.
- C. Ma, B. Yu, N. Hong, Y. Pan and W. Hu, Ind. Eng. Chem. Res., 2016, 55, 10868–10879 CrossRef CAS.
- B. Schartel and T. R. Hull, Fire Mater., 2010, 31, 327–354 CrossRef.
- M. Naderi, M. Hoseinabadi, M. Najafi, S. Motahari and M. Shokri, J. Appl. Polym. Sci., 2018, 135, 46201 CrossRef.
- J. Ding, Int. J. Electrochem. Sci., 2016, 11, 6256–6265 CrossRef CAS.
- J. Ding, O. U. Rahman, W. Peng, H. Dou and H. Yu, Appl. Surf. Sci., 2018, 427, 981–991 CrossRef CAS.
- J. W. Yang and Z. Z. Wang, Fire Mater., 2018, 5, 1–7 Search PubMed.
- C. G. H. Manjunatha, J. Mater. Environ. Sci., 2017, 8, 1661–1667 Search PubMed.
- L. G. Lu, Y. H. Chen, Z. Cheng, S. S. Yang and G. S. Shao, J. Mater. Sci. Eng., 2015, 43, 50–55 CrossRef CAS.
- X. Y. Li, Z. Z. Wang and H. J. Liang, Polym. Mater. Sci. Eng., 2007, 23, 145–148 Search PubMed.
- C. Breen, N. D'Mello and J. Yarwood, J. Mater. Chem., 2002, 12, 273–278 RSC.
- X. Wang, Y. Hu, L. Song, W. Xing and H. Lu, J. Polym. Sci., Part B: Polym. Phys., 2010, 48, 693–705 CrossRef CAS.
- X. B. Wang and S. S. Yang, Plast. Sci. Technol., 2010, 38, 47–49 CAS.
| This journal is © The Royal Society of Chemistry 2018 |


