DOI:
10.1039/C8RA08488B
(Paper)
RSC Adv., 2018,
8, 41163-41171
Kinetic and mechanistic investigations of the degradation of propranolol in heat activated persulfate process†
Received
13th October 2018
, Accepted 3rd December 2018
First published on 10th December 2018
Abstract
This study investigated the heat activated persulfate (heat/PS) process in the degradation of propranolol from water. Various factors (e.g., temperature, persulfate dose, initial pH and natural water constituent) on PRO degradation kinetics have been investigated. The results showed that the PRO degradation followed a pseudo-first-order kinetics pattern. As temperature rises, the pseudo-first-order rate constant (kobs) was improved significantly, and the kobs determined at 40–70 °C satisfied the Arrhenius equation, yielding an activation energy of 99.0 kJ mol−1. The radical scavenging experiments and the EPR tests revealed that both SO4˙− and ·OH participated in degrading PRO, with SO4˙− playing a dominant role. Higher PS concentration and neutral pH favored PRO degradation. The impact of Cl− and HCO3− were concentration-dependent. A lower concentration of Cl− and HCO3− could accelerate PRO degradation, while the presence of HA showed inhibitory effects. Seven degradation products were recognized through LC/MS/MS analysis. Cleavage of ether bond, hydroxylation, and ring-opening of naphthol moiety are involved in the PRO's degradation pathway. Finally, the formation of disinfection byproducts (DBPs) before and after pre-treated by heat/PS was also evaluated. Compared with direct chlorination of PRO, the heat/PS pre-oxidation greatly impacted the DBPs formation. The higher PRO removal efficiency in natural water indicated the heat/PS process might be capable of treating PRO-containing water samples, however, its impacts on the downstream effect on DBPs formation should be also considered.
1. Introduction
Propranolol (PRO), one of the common β-blockers, is extensively applied to treat angina, anxiety, cardiac arrhythmia and hypertension.1 It is employed in veterinary situations as well. The PRO was often discharged into wastewater in consequence of its extensive and long-term use, which was subsequently detected in surface water.2,3 PRO is also considered the most commonly detected β-blocker in water.4 As ecotoxicology suggested, among the classes of β-blockers, PRO had the highest acute and chronic toxicity.5 It has been reported that PRO is prone to bioaccumulation and a high degree of persistence in water, which will cause harm to aquatic life (e.g., algae, fish, and invertebrates, even at low concentrations).6,7
Pharmaceutical wastewater, effluents from hospitals, discarded drugs from private households, and livestock impoundments have been recognized as the main source of PRO in aqueous environments.8 Because of the wide usage and inefficient elimination in traditional wastewater treatment plants (WWTPs), much attention has been paid to the worldwide detection of PRO in aqueous environments. For example, PRO was removed only about 20% by WWTPs.9 Therefore, it is urgent and essential to develop novel methods with higher removal efficiency of PRO from aqueous environments.
A number of methods have been attempted to degrade PRO in water, such as graphene oxide, membranes, ferrate (IV), ozonation, photocatalysis, electro-Fenton reactions, etc.10–15 In these methods, AOPs have received more and more attention due to the efficient elimination and mineralization of target organic contaminants by the strong oxidizing agents, i.e., hydroxyl radicals (·OH). Nowadays, since the generated sulfate radicals (SO4˙−), show similar oxidation ability (E0 = 2.6 V) as compared with ·OH (E0 = 2.8 V), and can readily react with organic compounds through electron-transfer, activated persulfate oxidation has served as a popular strategy for removal of reluctant organic contaminants in water recently.16 UV, heat, and transition metals, have been commonly used to activate persulfate to produce SO4˙−. Among these approaches, heat activated persulfate (heat/PS) was recognized as a simple and effective method to produce SO4˙−.17 Heat/PS process has been widely used to remove emerging contaminants.17–20 The second-order reaction rate constant between SO4˙− and PRO was nearly 2.94 × 10¹⁰ M−1 s−1, suggesting that heat/PS process should be effective in degrading PRO.21 Besides, some researchers have been focusing on investigating the SO4˙−-based oxidation process for the control of disinfection byproducts (DBPs) formation recently, since most of the pharmaceutical and personal care products (PPCPs) are typical DBPs precursors during disinfection process by using chlorine as disinfectant.22,23 Therefore, it is of interest to investigate the impact of SO4˙−-induced oxidation of PRO on downstream DBPs formation during chlorination.
Thus far, information relevant to the parameters of PRO degradation by heat/PS process together with related degradation mechanism of PRO was little, so it needs to be explored and confirmed. Besides, β-blockers including PRO were also potential DBP precursors, and seldom studies have focusing on the impact of heat/PS pre-oxidation on DBPs formation during post-chlorination. Therefore, our objective was to investigate the PRO degradation performance of heat/PS process under various conditions including temperature, persulfate dose, pH, common anions and natural organic matter. Radical scavenging tests and electron paramagnetic resonance (EPR) analyses were performed for determining the existing radical species. The possible reaction pathways of PRO in heat/PS were proposed in accordance with the degradation products identified by LC/MS/MS. Subsequently, the impact of heat/PS pre-oxidation on the formation of DBPs during post-chlorination was evaluated. Finally, the degradation of PRO in natural water matrix was also assessed.
2. Materials and methods
2.1. Chemicals and materials
Propranolol hydrochloride (CAS No: 318-98-9; ≥99%) and DBPs standard solutions, and 5,5-dimethyl-1-pyridine N-oxide (DMPO) were purchased from Sigma-Aldrich (St. Louis, MO, USA). Sodium persulfate (≥99%) and sodium hypochlorite (NaOCl) containing 5% free chlorine were obtained from Sinopharm Chemical Reagent Co., Ltd. (Shanghai, China). All other chemicals were at least of analytical grade and were used without further purification. Ultrapure water produced from a Milli-Q water purification system (Millipore, USA) were applied for the preparation of all the solutions. Two raw water samples were collected from Jinze reservoir and Yangtze River from Yangshupu drinking water treatment plant in the city of Shanghai in July of 2018, respectively, and immediately filtered through 0.45 μM acetate membrane filters (Millipore, USA). Characteristics of water samples are listed in Table S1.†
2.2. Experimental procedures
Degradation experiments were performed in a glass bottle reactor containing 100 mL PRO solution at chosen temperatures (40–70 °C), which were controlled by a constant-temperature water bath shaker. The PRO solution was pre-heated to the desired temperature before the addition of persulfate. The pH was adjusted to 5.5–9 using 10 mM phosphate buffer, while the pH 3 and 11 were adjusted by H2SO4 (0.1 M) and NaOH (0.1 M), respectively. Samples were collected at predetermined time interval, quenched using excess ethanol and subsequently analyzed.
For the examination of the formation potentials of DBPs during chlorination, the PRO reaction solution was transferred to a 40 mL brown glass bottles with headspace-free conditions after treated by heat/PS. In order to achieve enough residual chlorine, chlorination experiments were carried out by adding a relatively high chlorine dose of 0.5 mM. After 24 h chlorination reaction in the dark at constant temperature of 25 ± 0.5 °C, the chlorine residuals were quenched by ascorbic acid with a normality twice as high as the chlorine. And DBPs yield was determined according to eqn (1).
| |
 | (1) |
2.3. Analytical methods
The PRO concentration was measured by HPLC (Waters 2010, USA) with a Waters Symmetry C18 column (5 μm, 4.6 mm × 250 mm) at a flow rate of 0.8 mL min−1 coupled with a UV detector at 213 nm. The mobile phase for propranolol comprised 35%/65% (v/v) acetonitrile/pH 2.5 KH2PO4 buffer.
To confirm the generation of radicals, EPR investigation was conducted by using DMPO as spin-trapping agent over a JES-FA 200 ESR spectrometer (Japan).
Total organic carbon (TOC) was measured with a Shimadzu TOC 5050A analyzer.
The degradation products formed from PRO were analyzed by LC/MS/MS. The instrument consists of a Waters 2010 HPLC system (USA) and a Thermo TSQ Quantum mass spectrometer (USA). The separation was accomplished on a Thermo Hypersil Gold C18 column (5 μm, 150 × 2.1 mm) using 10 mM ammonium acetate in water as mobile phase A and acetonitrile as mobile phase B with a flow rate of 0.25 mL min−1. The gradient started at 1% B for the first 2 min, linearly grew to 95% B in the next 20 min and then returned to the initial condition and kept at 1% B for another 6 min. Mass spectral analysis was conducted in positive mode using an electrospray ionization (ESI) source with the following experimental parameters: spray voltage of 3500 V, vaporizer temperature of 300 °C, capillary temperature of 300 °C, sheath gas pressure of 30 arbitrary units and scan range m/z 50–350. Once a possible product was identified, products ion scan MS/MS was performed.
Free chlorine was measured by a HACH DR2800 portable spectrophotometer (USA). DBPs of concern were quantified using an Eclipse 4660 Purge & Trap Sample Concentrator (OI, USA) and QP2010 GC/MS (Shimadzu, Japan). Details analytical information of DBPs are available elsewhere.24
3. Results and discussion
3.1. Effect of temperature
Temperature is a key factor for PRO degradation by heat/PS process, since increasing the reaction temperature can accelerate the decomposition of PS to produce more SO4˙−, thus favoring the PRO degradation.25,26
The results of PRO degradation under different temperature ranges from 40 to 70 °C are shown in Fig. 1. As seen, increase in temperature enhanced the PRO removal efficiency. The results indicated that at reaction time 45 min, by increasing the temperature from 40 to 60 °C, PRO removal efficiency increases from 25.4% to 96.0%. And almost all of PRO was removed within 30 reaction time under temperature of 70 °C. Besides, we observed no PRO degradation in the absence of persulfate at 70 °C (control). The degradation of PRO at different temperatures well fitted the pseudo-first-order kinetics pattern (eqn (2)).
| |
 | (2) |
where
kobs is the pseudo-first-order rate constant, and [PRO]
t is the concentration of PRO at reaction time
t.
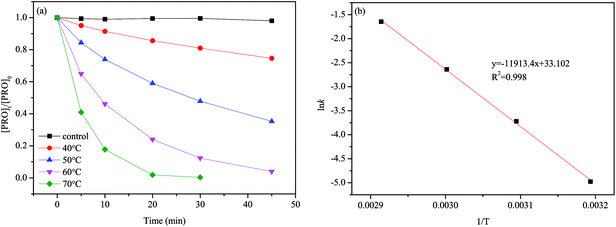 |
| | Fig. 1 (a) Effect of temperature on PRO degradation by heat/PS process. (b) Plot of ln![[thin space (1/6-em)]](https://www.rsc.org/images/entities/char_2009.gif) kobs vs. 1/T for Ea determination with an Arrhenius equation. Conditions: [PRO]0 = 0.025 mM, [PS]0 = 1 mM, pH = 7. kobs vs. 1/T for Ea determination with an Arrhenius equation. Conditions: [PRO]0 = 0.025 mM, [PS]0 = 1 mM, pH = 7. | |
The kobs can be calculated by linear regression of plot of ln([PRO]t/[PRO]0) vs. t. And the calculated kobs increased significantly from 0.0069 to 0.193 min−1 as temperature elevated from 40 to 70 °C. The acceleration of PRO degradation lies in that greater amount of reactive species may be produced at higher temperature that causing more rapid degradation of PRO. Arrhenius equation (eqn (3)) was further employed to estimate the temperature dependence of kinetic constant of PRO degradation.
| |
 | (3) |
where
A is the pre-exponential factor,
Ea is the apparent activation energy (kJ mol
−1),
R is the universal gas constant (8.314 J mol
−1 K
−1), and
T is the absolute temperature (K).
The Ea was calculated to be 99.0 kJ mol−1 according to the linear slope revealed in Fig. 1(b). This value is lower than that of another β-blockers, 112.6 kJ mol−1 for atenolol, suggesting that PRO was less refractory than atenolol in the heat/PS system.27
3.2. Identification of predominant reactive radical species
To determine the radical species responsible for PRO degradation, we selected DMPO as a trapping reagent and employed EPR for the identification of the generated radicals in heat/PS system. Fig. 2(a) shows there is no signals in the control samples that with PS under ambient temperature. However, by measuring sample obtained at 60 °C, a four-line signal and a six-line signal were observed, which are the typical spectra of DMPO-OH and DMPO-SO4, respectively. This suggested the coexistence of ·OH and SO4˙− in the system, which has been proved in the other reports as well.28–30
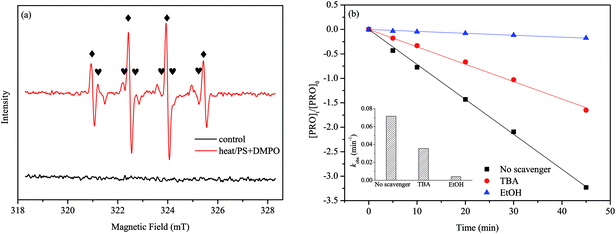 |
| | Fig. 2 (a) EPR spectra obtained from DMPO experiments after 5 min. (b) Identification of predominant radical species in heat/PS system. Conditions: [PRO]0 = 0.025 mM, [PS]0 = 1 mM, pH = 7, T = 60 °C, [DMPO]0 = 0.1 M, [Scavenger]0/[PS]0 = 400![[thin space (1/6-em)]](https://www.rsc.org/images/entities/char_2009.gif) : :![[thin space (1/6-em)]](https://www.rsc.org/images/entities/char_2009.gif) 1. 1. | |
To understand the role of radical species in the degradation of PRO in depth, we separately added excessive doses of two radical scavengers, i.e., tert-butyl alcohol (TBA) and ethanol (EtOH), to the reaction solutions. EtOH is usually used for scavenging both SO4˙− (1.6–7.7 × 10⁷ M−1 s−1) and ·OH (1.2–2.8 × 10⁹ M−1 s−1), whereas TBA is an effective quencher for ·OH (3.8–7.6 × 10⁸ M−1 s−1) but not for SO4˙− (4.0–9.1 × 10⁸ M−1 s−1).28,29 Accordingly, the different reactivity of SO4˙− and ·OH in alcohol help us to differentiate the leading radical species in the system. Fig. 2(b) clearly shows that the presence of either TBA or EtOH inhibited the PRO degradation, and EtOH had the stronger inhibitory effect than TBA. Compared with no scavenger controls (0.0715 min−1), the kobs of PRO degradation reduced by 50.2% (0.0356 min−1) and 94.5% (0.00396 min−1) with the addition of TBA and EtOH, respectively. As the above results suggested, both SO4˙− and ·OH responsible for the PRO degradation in our system, while SO4˙− was the primary radical species dominating the PRO degradation.
3.3. Effect of persulfate dose
Since PS is the source of SO4˙−, the amount of PS is critical factor in heat/PS system as well. Thus, the impact of different PS doses on PRO degradation was studied, and results are shown in Fig. 3. As the results suggested, PRO had higher degradation rate at higher PS doses. When the PS dose rose from 0.25 to 8 mM, the kobs rose from 0.0155 to 0.474 min−1. Moreover, kobs showed a good linear relationship with the PS dose as showed in the inset of Fig. 3, suggesting that the degradation rate of PRO is in a positive proportion to PS dose at a fixed temperature. Some studies had shown that the kobs would not continually increase when a high persulfate dose is applied, there is existing an optimal PS dose.31,32 Usually, at a higher PS dose, more SO4˙− would be produced whereas the excess SO4˙− may scavenge by itself or S2O82− due to the high reaction rate described in eqn (4) and (5).32 However, this phenomenon was not observed in this study probably due to the fact that the impact of any side reactions of SO4˙− and S2O82− was insignificant compared to the reaction between SO4˙− and the target compounds under the tested PS dose range. Similar phenomenon was also observed for ATL during heat/PS oxidation.27| | |
SO4˙− + SO4˙− → S2O82−, k = 4–8.1 × 10⁸ M−1 s−1
| (4) |
| | |
SO4˙− + S2O82− → SO42− + S2O8˙−, k = 1.2 × 10⁶ M−1 s−1
| (5) |
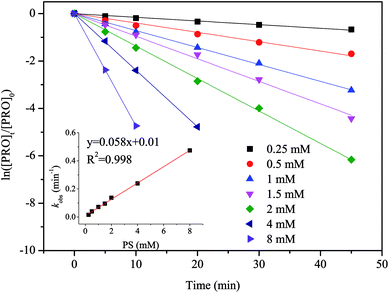 |
| | Fig. 3 Effect of PS dose on PRO degradation by heat/PS process. Conditions: [PRO]0 = 0.025 mM, pH = 7, T = 60 °C. | |
3.4. Effect of pH
Solution pH can affect the predominant radical species in SO4˙−-based system as well as the existing form of organic compounds with ionizable functional moieties (for PRO, pKa = 9.53).33 Thus, the impact of pH on PRO degradation should be evaluated, and the results are shown in Fig. 4. This figure suggests that the value of kobs for PRO degradation highly depends on the solution pH. The optimal PRO degradation rate was achieved at pH 7 (0.0715 min−1), followed by 9 (0.0359 min−1), 11 (0.0302 min−1), 5.5 (0.0234 min−1) and 3 (0.014 min−1). The slower PRO degradation rate achieved at acidic conditions (pH 3 and 5.5) was probably because acid-catalyzed decomposition could consume PS through non-radical pathways instead of producing SO4˙−, thereby reducing SO4˙− available for PRO decomposition.34 According to eqn (6) and (7), parts of SO4˙− can be transformed to ·OH with increasing pH.35,36 During the test pH ranges, PRO primarily exists in its protonated form when pH <9.53, and the deprotonation form of PRO increased as the pH increased. It has been reported that the deprotonation of amines group in PRO structure improved its oxidation by radicals in AOPs due to the weaker electron-withdrawing effect on amines moiety, which can explain the relatively higher reaction rate at pH 9 and 11.37,38 On the other hand, under extremely high pH, ·OH would become the dominant radical species, because of the short lifetimes, ·OH cannot get close to the PRO molecules thus lowering the degradation rate.39 The amount of SO4˙− may reach its peak at pH 7 since SO4˙− activated energy was reported to be minimal at neutral pH, resulting in the faster reaction rate at pH 7.40 In our previous study, however, the observed kobs for PRO degradation in UV activated persulfate (UV/PS) system increased monotonically with increasing pH from 3 to 11.21 The difference results may be attributed to the addition of phosphate buffer. It was reported that the rate constants between HPO42− and SO4˙− (1.2 × 10⁶ M−1 s−1) or ·OH (1.5 × 10⁵ M−1 s−1) are much higher than those for H2PO4− reacting with SO4˙− (7.2 × 10⁴ M−1 s−1) and ·OH (2 × 10⁴ M−1 s−1).41 And the percentage of HPO42− would improve with increasing solution pH, which led to the stronger scavenging effect caused by phosphate buffer on the degradation of PRO.| | |
SO4˙− + OH− → ·OH + SO42−
| (6) |
| | |
SO4˙− + H2O → ·OH + SO42− + H+
| (7) |
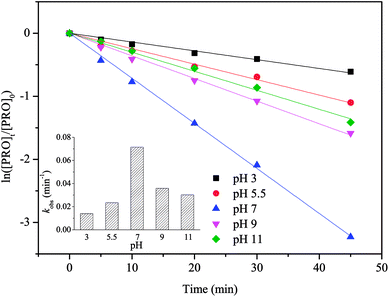 |
| | Fig. 4 Effect of pH on PRO degradation by heat/PS process. Conditions: [PRO]0 = 0.025 mM, [PS]0 = 1 mM, T = 60 °C. | |
3.5. Effect of water matrix
Inorganic anions (Cl−, HCO3−, SO42−) and natural organic matter (NOM) such as humic acid (HA) are prevalent in natural water, so we selected them to investigate their effects on the PRO degradation. The results are shown in Fig. 5.
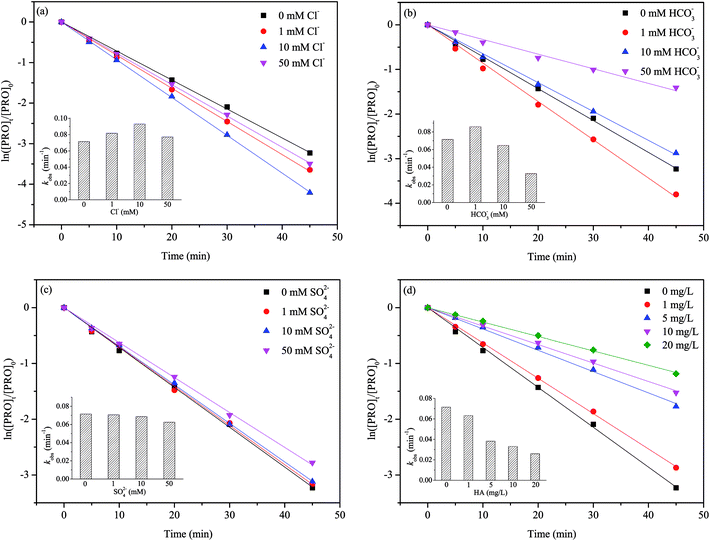 |
| | Fig. 5 Effect of (a) Cl−, (b) HCO3−, (c) SO42− and (d) humic acid on PRO degradation by heat/PS process. Conditions: [PRO]0 = 0.025 mM, [PS]0 = 1 mM, pH = 7, T = 60 °C. | |
The dual role of Cl− in PRO degradation was observed in Fig. 5(a). The conclusion was drawn that a lower level of Cl− (1–10 mM) increased the PRO degradation rate, while the degradation was hindered at higher level of Cl− (50 mM). Previous studies also observed that the effects of Cl− on the degradation of target contaminants was concentration-dependent.42 In SO4˙−-based AOPs, the Cl− could be oxidized by SO4˙− and ·OH to reactive chlorine species (RSC) such as reactive chlorine radicals (i.e., Cl˙, Cl2˙− and HOCl˙−) and free chlorine (Cl2, HOCl and OCl−) through a series of reactions (eqn (8)–(14)).43 In comparison with SO4˙−, RSC tend to react with electron-rich compounds through the addition of unsaturated C–C bonds, H-abstraction and one-electron oxidation.44 The structure of PRO contains naphthol ring and secondary amines moieties, which are potential reactive sites of RSC.45 Furthermore, the reaction between Cl− and SO4˙− may to some extent reduce the recombination of SO4˙−, thereby improving the degradation rate of PRO slightly. It seems that at lower Cl− concentration, the contribution of RSC could make up for the consumption of SO4˙− caused by Cl− scavenging effect. However, with further increasing Cl− concentration, due to the relatively lower oxidation potentials of RSC, the Cl− gradually showed the inhibition effect. This agrees with the results of previous studies on degradations of chloramphenicol and bisphenol S by SO4˙−-based processes.42,46
| | |
SO4˙− + Cl− → SO42− + Cl−
| (8) |
| | |
HOCl˙− + H+ ↔ Cl˙ + H2O
| (10) |
| | |
Cl2˙− + Cl2˙− → Cl2 + 2Cl−
| (12) |
| | |
Cl2 + H2O → HOCl + H+ + Cl−
| (13) |
The presence of HCO3− also have a double effect on PRO degradation. Fig. 5(b) illustrated that in the presence of 1 mM HCO3−, the degradation rate of PRO was increased. However, it gradually decreased when HCO3− further increased (i.e., 10–50 mM). Once HCO3− added into the solution, parts of HCO3− would transform to CO3−, and both HCO3− and CO3− are well-known SO4˙− scavengers (eqn (15)).47 At pH 7, HCO3− is the dominant carbonate species. The enhancement of PRO degradation under lower HCO3− concentration may attributed to the formation of carbonate radical (CO3˙−) (eqn (16)–(18)), a selective radical with moderate redox potential of 1.59 V that can also reacts readily with electron-rich compounds.48,49 This agrees with the findings obtained by studying other pollutants.50
| | |
SO4˙− + HCO3− → SO42− + HCO3˙
| (16) |
| | |
·OH + HCO3− → H2O + CO3˙−
| (17) |
The SO42− showed only a slight impact on PRO degradation because SO42− are the expected final product of PS oxidation and they do not react with SO4˙− (Fig. 5(c)). A slight inhibitive effect on PRO degradation was observed at a high SO42− level, probably due to concentrated SO42− significantly reduced the oxidation-reduction potential of SO4˙−/SO42−, thereby decreasing PS activation efficiency.51
Fig. 5(d) shows PRO degradation was inhibited noticeably with HA concentration increasing. The structure of NOM contains lots of electron-rich groups, that can readily react with SO4˙− and/or ·OH. It has been reported that NOM has a higher second-order reaction rate constants towards SO4˙− (2.35 × 10⁷ M−1 s−1) or ·OH (3 × 10⁸ M−1 s−1).41 It is reasonably that the presence of HA would compete for radicals with PRO in heat/PS system, thus leading the inhibitory effect on PRO degradation.
3.6. Degradation products and degradation pathways
Besides the oxidation degradation kinetics of PRO, the degradation products were also conducted by LC/MS/MS. Seven major products of PRO were observed. Based on previous researches and obtained mass spectra information, the tentative structure of degradation products are listed in Table S2.† Moreover, their chromatograms and mass spectra are also provided in Fig. S1 and S2.†
The degradation pathways were proposed in line with the identified products. As shown in Fig. 6, cleavage of ether bond, hydroxylation, and ring-opening of naphthol moiety simultaneously of successively occurred in this case. For the pathway I, the cleavage of ether bond to generated m/z 134 (hydroxylation amine) and naphthol, however, the naphthol was not observed in this study, probably due to its fast transformation in heat/PS system.52 In terms of pathway II, the hydroxylation reaction of naphthol ring to yield mono-hydroxylated products with m/z 276.27,52 We should notice that both SO4˙− and ·OH can contribute to PRO the hydroxylated products. Because of electron-rich, naphthol ring more vulnerable towards electrophilic attack of ·OH. Therefore, the addition of –OH primarily occurred to naphthol ring of PRO after ·OH attacked. Meanwhile, PRO would attack naphthol ring to form radical cations through electron transfer, then radical cations would transform to mono-hydroxylated species via hydrolysis reaction.53 However, due to the multiple available attack sites on the naphthol ring for SO4˙− and ·OH. MS/MS information cannot help us to differentiate the accurate sites for –OH addition. As shown in pathway III, several ring opening transform products were identified, namely m/z 292, m/z 308, m/z 310 and m/z 282. These products have also been frequently identified by other oxidation products of PRO, such as ozonation, Fe(vi), and ·OH-based oxidation process.13,54,55 Typically, after ring opening reaction to form m/z 292, a new hydroxylation would occur to yield m/z 308 and m/z 310. Of note, the oxidation of alcohol moiety of m/z 310 to aldehyde moiety can also form m/z 308. Then, m/z 282 can be derived from a decarboxylation in m/z 308.
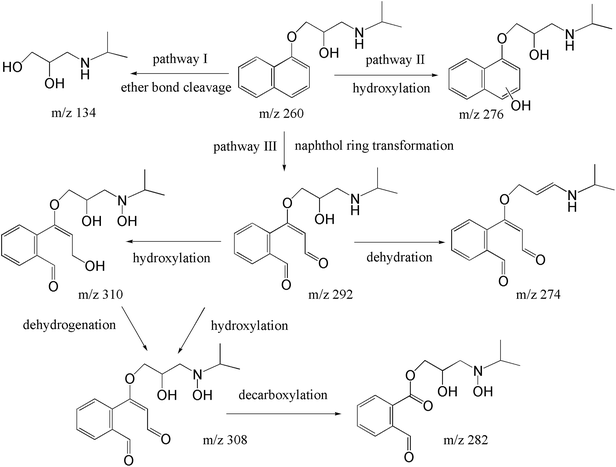 |
| | Fig. 6 Pathways for the transformation of PRO during heat/PS process. | |
3.7. DBPs formation by post-chlorination
Once β-blocker, such as PRO, escaping from wastewater treatment plant can discharging into drinking water sources, it can react with disinfection agent chlorine to produce disinfection byproducts (DBPs). In general, TCM is one of the typical DBPs during chlorination process of drinking water, and it exhibits relatively high stability in the presence of chlorine. Fig. 7 shows that the yield of TCM of PRO without pre-treatment was 3.39%, and TCM yield steadily increased from 3.39% to 7.07% as the PS dose increased from 0 to 1 mM after pre-oxidation by heat/PS system, but it was then slightly decreased to 6.67% and 6.37% with further increasing PS dose to 1.5 and 2 mM, respectively. This is in accordance with Chu et al., who also observed the pretreated by SO4˙−-based oxidation of chloramphenicol enhanced the formation of TCM.23 Lots of transformed products may produced rather than completely mineralize into CO2 or H2O during oxidation by heat/PS process as reflected by TOC removal rate, it seems that the PRO oxidation products appeared to be more readily react with chlorine to form TCM.56 It is noteworthy that the yield of TCM became lower when the PS exceeded to 1.5 mM, which is probably because the organic carbon levels of PRO water reduced by heat/PS treatment (i.e. 9.42% for 1.5 mM, 13.64% for 2 mM) to a greater extent. Thus, much attention should be paid to the downstream effect on DBP formation after pre-treatment of SO4˙−-radical induced oxidation.
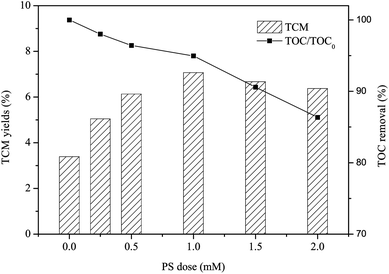 |
| | Fig. 7 TCM yield of PRO with heat/PS pre-treatment subsequent chlorination. Conditions: [PRO]0 = 0.025 mM, [PS]0 = 0.25, 0.5, 1, 1.5 and 2 mM, pH = 7, T = 60 °C, Cl2 dose = 0.5 mM. | |
3.8. PRO degradation in natural water matrices
PRO degradation by heat/PS can obviously be impacted by water matrices. To assess the impacts of water matrices, we conducted PRO degradation by heat/PS in real water matrices (Yangtze River and Jinze Reservoir). In the meantime, the major characteristics of natural water are listed in Table S1.† These samples were spiked with 0.025 mM PRO and 1 mM PS. Fig. 8 shows that the samples from Yangtze River and Jinze Reservoir with dissolved organic matter content, HCO3− and Cl− displayed lower removal efficiency than that in ultrapure water buffered at pH 7. The existence of organic matters and anions could inhibit the PRO oxidation with heat/PS process as stated above. Despite the inhibition effect of background matrices, nearly 77.4% and 67.6% were removed by heat/PS system at 45 min in two real water matrices, respectively. Accordingly, the natural organic matter and anions must be considered once applying heat/PS for the control of PRO in natural water.
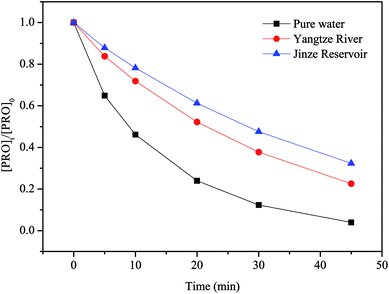 |
| | Fig. 8 The removal of PRO by heat/PS in real water matrix. Conditions: [PRO]0 = 0.025 mM, [PS]0 = 1 mM, T = 60 °C. | |
4. Conclusion
The degradation of PRO by heat/PS was systematically studied. Quenching tests and EPR analysis revealed that the major reactive species including SO4˙− and ·OH. Besides, SO4˙− was more predominant for PRO degradation at neutral pH. Typically, elevating the temperature or PS dose obviously improved the degradation efficiency of PRO. The fastest degradation rate was observed at neutral pH. Cl− and HCO3− at low concentration level could improve the degradation rate of PRO, SO42− almost did not significant impact PRO degradation, while HA exhibited showed inhibitory effect. Based on the degradation products, three degradation mechanisms were proposed, namely cleavage of ether bond, hydroxylation, and ring-opening of naphthol moiety were involved in the degradation of PRO. During post-chlorination, SO4˙− pre-oxidation at low PS doses may enhanced the formation of TCM, whereas PS at high doses can slightly reduce the formation of TCM. The higher removal efficiency of PRO in real water by heat/PS process, suggesting this technology is a promising method for treating PRO-contaminated water. However, heat/PS oxidation of contaminants can be largely impacted by various constituents universally existing in natural waters. Therefore, an optimal conditions may be distinctive to each system, depending on which contaminants are present and how factors influence their kinetics. Therefore, finding the optimal operational parameters for a specific contaminant and environmental system may be essential for successful application of heat/PS oxidation process. Further, excessive PS addition resulting in a high level of sulfate ion should also be noticed.
Conflicts of interest
There are no conflicts of interest to declare.
Acknowledgements
This work was financially supported by the National Natural Science Foundation of China (51708348). We also thankful to the reviewers and editors for their valuable advice to improve this manuscript.
References
- S. K. Khetan and T. J. Collins, Chem. Rev., 2007, 107, 2319–2364 CrossRef CAS PubMed.
- M. J. Benotti, R. A. Trenholm, B. J. Vanderford, J. C. Holady, B. D. Stanford and S. A. Snyder, Environ. Sci. Technol., 2009, 43, 597–603 CrossRef CAS PubMed.
- T. A. Ternes, Water Res., 1998, 32, 3245–3260 CrossRef CAS.
- J. Maszkowska, S. Stolte, J. Kumirska, P. Lukaszewicz, K. Mioduszewska, A. Puckowski, M. Caban, M. Wagil, P. Stepnowski and A. Białk-Bielińska, Sci. Total Environ., 2014, 493, 1112–1121 CrossRef CAS PubMed.
- E. Giltrow, P. D. Eccles, M. J. Winter, P. J. McCormack, M. Rand-Weaver, T. H. Hutchinson and J. P. Sumpter, Aquat. Toxicol., 2009, 95, 195–202 CrossRef CAS PubMed.
- D. B. Huggett, B. W. Brooks, B. Peterson, C. M. Foran and D. Schlenk, Arch. Environ. Contam. Toxicol., 2002, 43, 229–235 CrossRef CAS PubMed.
- T. V. Madureira, M. J. Rocha, C. Cruzeiro, M. H. Galante, R. A. F. Monteiro and E. Rocha, Aquat. Toxicol., 2011, 105, 292–299 CrossRef CAS PubMed.
- C. Miège, M. Favier, C. Brosse, J. P. Canler and M. Coquery, Talanta, 2006, 70, 739–744 CrossRef PubMed.
- M. Gros, M. Petrović, A. Ginebreda and D. Barceló, Environ. Int., 2010, 36, 15–26 CrossRef CAS PubMed.
- G. Z. Kyzas, A. Koltsakidou, S. G. Nanaki, D. N. Bikiaris and D. A. Lambropoulou, Sci. Total Environ., 2015, 537, 411–420 CrossRef CAS PubMed.
- M. Taheran, S. K. Brar, M. Verma, R. Y. Surampalli, T. C. Zhang and J. R. Valero, Sci. Total Environ., 2016, 547, 60–77 CrossRef CAS PubMed.
- G. A. Anquandah, V. K. Sharma, V. R. Panditi, P. R. Gardinali, H. Kim and M. A. Oturan, Chemosphere, 2013, 91, 105–109 CrossRef CAS PubMed.
- J. Benner and T. A. Ternes, Environ. Sci. Technol., 2009, 43, 5086–5093 CrossRef CAS.
- H. Yang, T. C. An, G. Y. Li, W. H. Song, W. J. Cooper, H. Y. Luo and X. D. Guo, J. Hazard. Mater., 2010, 179, 834–839 CrossRef CAS.
- E. Isarain-Chávez, P. L. Cabot, F. Centellas, R. M. Rodríguez, C. Arias, J. A. Garrido and E. Brillas, J. Hazard. Mater., 2011, 185, 1228–1235 CrossRef.
- L. S. Lian, B. Yao, S. D. Hou, J. Y. Fang, S. W. Yan and W. H. Song, Environ. Sci. Technol., 2017, 51, 2954–2962 CrossRef CAS PubMed.
- C. Q. Tan, N. Y. Gao, Y. Deng, W. L. Rong, S. D. Zhou and N. X. Lu, Sep. Purif. Technol., 2013, 109, 122–128 CrossRef CAS.
- Y. Q. Chen, P. Y. Deng, P. C. Xie, R. Shang, Z. P. Wang and S. L. Wang, Chemosphere, 2017, 168, 1628–1636 CrossRef CAS PubMed.
- Y. F. Ji, W. P. Xie, Y. Fan, Y. Y. Shi, D. Y. Kong and J. H. Lu, Chem. Eng. J., 2016, 286, 16–24 CrossRef CAS.
- A. Ghauch, A. M. Tuqan and N. Kibbi, Chem. Eng. J., 2015, 279, 861–873 CrossRef CAS.
- Y. Q. Gao, N. Y. Gao, D. Q. Yin, F. X. Tian and Q. F. Zheng, Chemosphere, 2018, 201, 50–58 CrossRef CAS PubMed.
- C. Postigo and S. D. Richardson, J. Hazard. Mater., 2014, 279, 461–475 CrossRef CAS PubMed.
- W. H. Chu, T. F. Chu, E. D. Du, D. Yang, Y. Q. Guo and N. Y. Gao, Ecotoxicol. Environ. Saf., 2016, 124, 147–154 CrossRef CAS PubMed.
- W. H. Chu, N. Y. Gao, M. R. Templeton and D. Q. Yin, Chemosphere, 2011, 83, 647–651 CrossRef CAS PubMed.
- R. L. Johnson, P. G. Tratnyek and R. O. Johnson, Environ. Sci. Technol., 2008, 42, 9350–9356 CrossRef CAS.
- A. Ghauch, A. M. Tuqan and N. Kibbi, Chem. Eng. J., 2012, 197, 483–492 CrossRef CAS.
- D. Miao, J. B. Peng, X. H. Zhou, L. Qian, M. J. Wang, L. Zhai and S. X. Gao, Chemosphere, 2018, 207, 174–182 CrossRef CAS PubMed.
- G. P. Anipsitakis and D. D. Dionysiou, Environ. Sci. Technol., 2004, 38, 3705–3712 CrossRef CAS.
- J. J. Cai, M. H. Zhou, W. L. Yang, Y. W. Pan, X. Y. Lu and K. G. Serrano, Chemosphere, 2018, 212, 784–793 CrossRef CAS.
- H. P. Gao, J. B. Chen, Y. L. Zhang and X. F. Zhou, Chem. Eng. J., 2016, 306, 522–530 CrossRef CAS.
- L. Lin, S. Lin, W. Zhang, U. Farooq, G. X. Shen and S. Q. Hu, Chem. Eng. J., 2018, 346, 515–524 CrossRef.
- Y. Q. Liu, X. X. He, Y. S. Fu and D. D. Dionysiou, Chem. Eng. J., 2016, 305, 229–239 CAS.
- F. Wang, H. W. Sun, X. H. Ren and K. Zhang, Chem. Eng. J., 2017, 326, 281–291 CrossRef CAS.
- I. M. Kolthoff and I. K. Miller, J. Am. Chem. Soc., 1951, 73, 3055–3059 CrossRef CAS.
- C. J. Liang and H. W. Su, Ind. Eng. Chem. Res., 2009, 48, 5558–5562 CrossRef CAS.
- E. Hayon, A. Treinin and J. Wilf, J. Am. Chem. Soc., 1972, 94, 47–57 CrossRef CAS.
- M. C. Dodd, M. O. Buffle and U. V. Gunten, Environ. Sci. Technol., 2006, 40, 1969–1977 CrossRef CAS.
- Y. F. Ji, Y. Fan, K. Liu, D. Y. Kong and J. H. Lu, Water Res., 2015, 87, 1–9 CrossRef CAS PubMed.
- M. H. Nie, Y. Yang, Z. J. Zhang, C. X. Yan, X. N. Wang, H. J. Li and W. B. Dong, Chem. Eng. J., 2014, 246, 373–382 CrossRef CAS.
- C. J. Liang, Z. S. Wang and C. J. Bruell, Chemosphere, 2007, 66, 106–113 CrossRef CAS PubMed.
- P. C. Xie, J. Ma, W. Liu, J. Zou, S. Y. Yue, X. C. Li, M. R. Wiesner and J. Y. Fang, Water Res., 2015, 69, 223–233 CrossRef CAS PubMed.
- C. Q. Tan, D. F. Fu, N. Y. Gao, Q. D. Qin, Y. Xu and H. M. Xiang, J. Photochem.
Photobiol., A, 2017, 332, 406–412 CrossRef CAS.
- G. P. Anipsitakis, D. D. Dionysiou and M. A. Gonzalez, Environ. Sci. Technol., 2006, 40, 1000–1007 CrossRef CAS PubMed.
- J. E. Grebel, J. J. Pignatello and W. A. Mitch, Environ. Sci. Technol., 2010, 44, 6822–6828 CrossRef CAS PubMed.
- Y. H. Pan, S. S. Cheng, X. Yang, J. Y. Ren, J. Y. Fang, C. Shang, W. H. Song, L. S. Lian and X. R. Zhang, Water Res., 2017, 116, 254–265 CrossRef CAS PubMed.
- Q. Wang, X. H. Lu, Y. Cao, J. Ma, J. Jiang, X. F. Bai and T. Hu, Chem. Eng. J., 2017, 328, 236–245 CrossRef CAS.
- C. J. Liang, Z. S. Wang and N. Mohanty, Sci. Total Environ., 2006, 370, 271–277 CrossRef CAS PubMed.
- Y. Q. Liu, X. X. He, X. D. Duan, Y. S. Fu and D. D. Dionysiou, Chem. Eng. J., 2015, 276, 477–481 CrossRef.
- Y. Yang, J. J. Pignatello, J. Ma and W. A. Mitch, Environ. Sci. Technol., 2014, 48, 2344–2351 CrossRef CAS PubMed.
- Y. J. Qian, G. Xue, J. B. Chen, J. M. Luo, X. F. Zhou, P. Gao and Q. Wang, J. Hazard. Mater., 2018, 354, 153–160 CrossRef CAS PubMed.
- X. L. Wu, X. G. Gu, S. G. Lu, Z. F. Qiu, Q. Sui, X. K. Zang, Z. W. Miao and M. H. Xu, Sep. Purif. Technol., 2015, 147, 186–193 CrossRef CAS.
- H. Yang, T. C. An, G. Y. Li, W. H. Song, W. J. Cooper, H. Y. Luo and X. D. Guo, J. Hazard. Mater., 2010, 179, 834–839 CrossRef CAS PubMed.
- B. Darsinou, Z. Frontistis, M. Antonopoulou, I. Konstantinou and D. Mantzavinos, Chem. Eng. J., 2015, 280, 623–633 CrossRef CAS.
- M. L. Wilde, W. M. M. Mahmoud, K. Kümmerer and A. F. Martins, Sci. Total Environ., 2013, 452–453, 137–147 CrossRef CAS PubMed.
- J. Santiago-Morales, A. Agüera, M. D. M. Gómez, A. R. Fernández-Alba, J. Giménez, S. Esplugas and R. Rosal, Appl. Catal., B, 2013, 129, 13–29 CrossRef CAS.
- W. Li, Y. C. Liu, J. M. Duan, J. V. Leeuwen and C. P. Saint, Chem. Eng. J., 2015, 274, 39–49 CrossRef CAS.
Footnote |
| † Electronic supplementary information (ESI) available. See DOI: 10.1039/c8ra08488b |
|
| This journal is © The Royal Society of Chemistry 2018 |
Click here to see how this site uses Cookies. View our privacy policy here.  Open Access Article
 *a,
Jia-nan Fanga,
Nai-yun Gaob,
Xue-nong Yi*a,
Wei Maoc and
Jia Zhanga


![[thin space (1/6-em)]](https://www.rsc.org/images/entities/char_2009.gif)

