 Open Access Article
Effects of potassium permanganate conditioning on dewatering and rheological behavior of pulping activated sludge: mechanism and feasibility†
Xin Zhang abd,
Hui Caiabd,
Jun Shenc and
Hui Zhang*a
aJiangsu Provincial Key Lab of Pulp and Paper Science and Technology, Nanjing Forestry University, Nanjing 210037, China. E-mail: zhnjfu@163.com
bState Key Laboratory of Pulp and Paper Engineering, South China University of Technology, Guangzhou 510640, China
cLee & Man Co. Ltd, Changshu 215500, China
dJiangsu Co-Innovation Center for Efficient Processing and Utilization of Forest Resources, Nanjing Forestry University, Nanjing 210037, China
First published on 10th December 2018
Abstract
The difficulties in sludge dewatering are associated with the high organic content, colloidal materials in sludge solids and the high hydrophilicity of extracellular polymeric substances (EPS). Based on the principle of advanced oxidation processes, waste pulping activated sludge was subjected to potassium permanganate (KMnO4) oxidation pretreatment and then the influence and mechanism on sludge dewatering were comprehensively investigated in the present study. At lower KMnO4 dosage, changes of the physicochemical and rheological characteristics were that: (1) as the sludge disintegration degree increased, the total extractable EPS increased and then the bound water were released; (2) the rheological behavior showed that the yield stress and viscosity decreased while flowability increased and the positive thixotropic behavior weakened; (3) the particle size and microscopic structure were changed insignificantly. These changes resulted in damaging the gel-like environment and making the surface of sludge floc stripped but did not completely induce the floc breakage as a result of KMnO4 with lower redox potential. Thus, sludge dewaterability was improved with the optimum dosage of 16 g kg−1 dry solid. On the perspective of environmental safety, KMnO4 conditioning on sludge dewatering is feasible.
1. Introduction
Since 2009, China has exceeded America in paper and paperboard production and consumption and became the largest producer in the world, accounting for 25% of the global total.1 But the annual per capita consumption of paper and paperboard (75 kg) in China is much lower than in many developed countries (310.9 kg in Belgium, 285.3 kg in Slovenia, 250.4 kg in Germany, 235.6 kg in Austria, 218.6 kg in America, and 208.7 kg in Japan).2 Therefore, there is still great development potential for the paper industry in China. However, this has resulted in the greater environmental problems which limited the development of industry in turn.The pulp and paper industry is considered to be one of the most polluting, and energy and water consuming industries in the world.3 A large amount of pulping activated sludge (PAS) is produced from the sewage treatment plants. The disposal of sewage sludge is one of the expensive sectors in a sewage treatment plant, accounting for up to 50% of the total operating costs of the plant.4 Because the water content of PAS is about 98%,5–7 dewatering is the key step for further treatment and disposal in order to reduce the sludge volume and drying costs.
Extracellular polymeric substances (EPS) are the main organic matter of sludge flocs8 and have significant effects on sludge dewaterability.9,10 Proteins (PN) and polysaccharides (PS) are the major components of EPS with approximately 70–80% of the total,11 influencing the bound water content.12 In addition, EPS also contain nucleic acids, humic substances, lipids, etc. Previous researches showed that as much as 98% of the water was bound in the EPS.13,14 The bound water interacts with sludge floc by the chemical bonds or capillary phenomena and requires much more energy to be removed.15 The removal of the bound water is key to reduce the sludge cake moisture rate.
The difficulties in sludge dewatering can be related to the high organic content and colloidal matters in it, the high compressibility of sludge cake, and the high hydrophilicity of EPS.16 In order to improve the sludge dewatering, it is a prerequisite to choose the proper sludge conditioning methods. Various methods of pretreatment are reported in the literature. There are usually three different ways: (1) to improve sludge settleability by coagulation or flocculation of sludge particles in the addition of polyelectrolytes, such as polyaluminium chloride,17 ferric chloride18 and cationic polyacrylamide;19 (2) to improve sludge cake filterability by reducing the sludge solids compressibility in the addition of some high porous inert minerals such as fly ash,20 gypsum,21 wood chips and wheat dregs,22 rice husk;23 (3) to release the bound water from EPS by disintegration of sludge using techniques such as advanced oxidation processes (AOPs), anaerobic digestion,15 ultrasonic,24 electro-dewatering7 and enzyme25 treatment. Moreover, more researches has been undertaken to apply these pretreatments and mechanical dewatering device6 in a number of combinations, aiming at enhancing the dewaterability at a high level.26,27
The sludge dewaterability is assessed by the dewatering efficiency and moisture content reduction rate of sludge cake. In the mill, chemical coagulants and flocculants are usually applied as the conditioners to improve sludge dewaterability, but can't increase the moisture content reduction rate of sludge cake.28,29 That is to say, whether coagulants and flocculants are added or not, the sludge cake moisture content is the same at enough dewatering time. Based on the analysis, the objective of sludge deep dewatering is to reduce the bound water content and then increase the sludge cake moisture reduction rate. It can be realized by disrupting sludge floc or changing the surface properties of floc, and then increase the free water content of sludge.30 Therefore, sludge disintegration becomes a research focus.31
Utilizing in situ chemical oxidation reaction, AOPs disintegrate the sludge floc, reduce the bound water content and then realize deep dewatering. The major reagents employed in the literature include ozone (O3),24 Fenton reagents,32,33 ferrite,34 persulfate,35 permanganate,36 etc. Fenton reagents are frequently used for sludge dewatering, but have to be used at low pH values (pH < 4) to avoid hydrolysis and precipitation of Fe3+, which will destroy the treatment equipment in a long time and is the biggest flaw for sludge dewatering.32,37 Persulfate is also used for sludge dewatering effectively with higher redox potential, but the oxidation processes need to be activated by initiators including metal salts and heat,35 and then increase the operating difficulties and costs. Other additions in the AOPs also have the demerit of the higher cost. Among them, potassium permanganate (KMnO4) is a strong oxidant and has been used effectiveness over a wide pH range for water disinfection, toxic matter oxidation, inhibiting the growth of algae,38,39 convenient operation, comparative stability and relatively low cost.40 The redox reactions of KMnO4 in acidic and alkaline condition are shown in eqn (1) and (2).36
| MnO4− + 8H+ + 5e = Mn2+ + 4H2O Eφ = 1.51 V | (1) |
| MnO4− + 2H2O + 3e = MnO2 + 4OH− Eφ = 0.59 V | (2) |
Most references are related to the municipal activated sludge for sludge dewatering; experimental studies that have actually used activated sludge from pulp and paper mills are rare. The characteristics are considerably different between PAS and municipal sludge, mainly because of the large amount of lignocellulosic material in the former.41 Take the example of municipal sludge, Wu et al.36 and Wu et al.31 have preliminary studied the sludge disintegration using KMnO4 as the oxidant, but not systematically and with a higher dosage of the oxidant. Wu et al.36 investigated the relationship between the sludge disintegration degree (DD) and KMnO4 dosage; the DD reached a maximum of 34% with the dosage of about 100 g kg−1 dry solid (DS) and the particle size was almost unchanged within 3 minutes. And then, Wu et al.31 studied the relationship between the KMnO4 dosage and sludge dewaterability, and speculated that the poor of the dewaterability was caused by the decrease of sludge particle size, which is inconsistent with the former researcher's conclusion. Therefore, the mechanism of KMnO4 conditioning and how KMnO4 conditioning influencing the sludge dewatering still remain unclear. Additionally, whether KMnO4 treatment is feasible for the sludge dewatering needs to be analyzed from the perspective of environmental safety. Rheological properties of sludge play key roles in processes such as pumping, dewatering, drying and mixing,42 which are important macroscopic physical properties that reflect the change of the sludge microscopic structure. It is well known that sewage sludge is a non-Newtonian fluid, that exhibits rheological behavior, such as shear-thinning, thixotropy, yield stress and viscoelasticity.43–46 Many reports showed that some pretreatment methods such as acid,47 alkali,48 ultrasonic,24 hydrothermal,24 composite salt49 can change the previous rheological characteristics that can be used to reveal the change of physicochemical properties and dewaterability. However, little is known about the effects of KMnO4 conditioning on sludge rheology and how this would affect sludge dewaterability. Investigation of rheological behavior will help to reveal the mechanism of KMnO4 conditioning on sludge dewatering.
The objectives of this study in the PAS were to investigate the role and mechanism of KMnO4 conditioning with a lower dosage that include sludge conditioning, physicochemical characteristics, rheological behavior and sludge dewaterability, and hopefully to find out the method to further improve the sludge dewatering. And then the feasibility of KMnO4 conditioning on sludge dewatering was analyzed on the perspective of environmental safety and we hope the results would provide the fundamental theory of sludge dewatering.
2. Materials and methods
2.1. Materials
The PAS was obtained from an integrated pulping and paper mill located in Jiangsu Province, China. The sludge samples (pH = 6.96) were kept in a plastic container filled with ice during transportation. The sludge was gently thickened to 10 g L−1 (DS of 1.25%) by settling. To minimize the microbial activity, samples were stored at 4 °C and used for less than 5 days.50 All the tests were performed in triplicate. KMnO4 was purchased from Nanjing Chemical Reagent Co. (Nanjing, China) and was of chemical pure grade, which was prepared by making the solution (3 g L−1) prior to use.2.2. Sludge conditioning and dewatering
Different dosages of KMnO4 were added into 100 mL sludge and the conditioned sludge was agitated for 3 min. The dewaterability was evaluated with the specific resistance to filtration (SRF), moisture content of sludge cake and the time to filter (TTF). The sludge SRF was measured based on the method of Wisniewski and Grasmick,51 and Qi Y. et al.52 The TTF was obtained using the method described by Lo et al.53 and was defined as the time required for the filtration volume to increase up to half of the sludge sample volume. The moisture content of the filtered sludge cake was calculated according to the method of Wu et al.31 In this study, sludge was put into Buchner funnel at 0.03 MPa for the sludge vacuum filtration. Deep dewatering of sludge cake obtained from filtration dewatering was carried out by tablet press at a pressure of 1.25 MPa for 1 min, and the sludge cake moisture content also was measured.2.3. EPS extraction and analysis
A heat extraction method was used to extract the loosely bound EPS (LB-EPS) and the tightly bound EPS (TB-EPS).54 After centrifugation, the extraction supernatants were filtered with a 0.45 μm membrane and collected as soluble EPS (S-EPS), LB-EPS and TB-EPS. And then the three EPS components were analyzed for PN and PS, respectively. The PN content was analyzed by a UV spectrophotometer (TU-1900, PERSEE, China) following the modified Lowry method using bovine albumin (Sangon Biotech, China) as standard.55 The PS content was measured by the anthrone–sulfuric acid method with glucose as standard.8 The total EPS was the sum of PN and PS.362.4. Rheological behavior measurement
Rheological tests were performed on a rotational rheometer (Thermo Scientific™ HAAKE™ MARS™, HAAKE, Germany) equipped with HAAKE Rheowin software. Measurements were conducted at 20 °C. The sensor geometry used in this study was a 2° cone and a flat stationary plate of 60 mm diameter. The similar rheometer and cone–plate geometry were used by many researchers.43,46,56–59 The rheological properties of sludge under the steady shear test were analyzed as follows: firstly, the sludge sample was pre-sheared for 10 min at a shear rate of 5 s−1 and then allowed to rest for 10 min; secondly, the measurements were performed by linearly increasing the shear rate from 5 s−1 to 500 s−1 over 5 min with 300 points, holding at 500 s−1 for 30 s (up-curve); finally, the shear rate was linearly decreased from 500 s−1 to 5 s−1 over 5 min with 300 points (down-curve). For making a comparison, the three most commonly used rheological models, namely Power law (eqn (3)), Herschel–Bulkley (eqn (4)) and Bingham law (eqn (5)) were used to describe the rheological behavior of sludge.
τ = k![[small gamma, Greek, dot above]](https://www.rsc.org/images/entities/i_char_e0a2.gif) n n
| (3) |
τ = k![[small gamma, Greek, dot above]](https://www.rsc.org/images/entities/i_char_e0a2.gif) n + τy n + τy
| (4) |
τ = η![[small gamma, Greek, dot above]](https://www.rsc.org/images/entities/i_char_e0a2.gif) + τy + τy
| (5) |
![[small gamma, Greek, dot above]](https://www.rsc.org/images/entities/i_char_e0a2.gif) is the shear rate (s−1), k is the consistency index (Pa sn), η is the apparent viscosity (Pa sn). The n is the flow behavior index and a decrease or increase of n from 1 indicates that the non-Newtonian flow characteristics are strengthened,60 which is equal to 1 for Newtonian fluids, higher than 1 for dilatant fluids and lower than 1 for pseudo-plastic fluids.61
is the shear rate (s−1), k is the consistency index (Pa sn), η is the apparent viscosity (Pa sn). The n is the flow behavior index and a decrease or increase of n from 1 indicates that the non-Newtonian flow characteristics are strengthened,60 which is equal to 1 for Newtonian fluids, higher than 1 for dilatant fluids and lower than 1 for pseudo-plastic fluids.61
2.5. Other physicochemical properties analysis
Sludge moisture content and TSS were measured following standard methods.62 The particle size distributions of the raw and conditioned sludge samples were measured by a laser classifier (Topsizer, OMEC Co., China). Microstructural characteristic was investigated by scanning electron microscopy (SEM) (Quanta 200, FEI, America).Differential scanning calorimetry (DSC) (DSC214 Polyma, NETZSCH, Germany) was performed to measure the bound water in the sludge cake.48,63 The amount of free water in the sludge sample was quantified from the peaks of the crystallization/melting data from the DSC graphs. The sludge sample was vacuum filtered and then a weighted amount of sludge cake was added to the DSC. The temperature of the sludge cake was first cooled from 20 °C to −20 °C at a rate of 10 K min−1 and then increased to 20 °C at the same rate. The amount of free water in the sludge cake was calculated by dividing the heat absorbed by the water's latent heat of melting ice (334 mJ mg−1).48 Therefore, the bound water content (mg mg−1 DS) was defined as the difference between the total water content (measured by drying the cake at 105 °C) and the free water content measured by DSC.64,65
2.6. Statistical analysis
In this study, correlation analysis and analysis of variance were performed using the software SPSS 22. Pearson's correlation (R) is the measurement of the linear correlation between two variables. The correlations were considered statistically significant at a 95% confidence interval (p < 0.05).3. Results and discussion
3.1. The dewaterability of the PAS
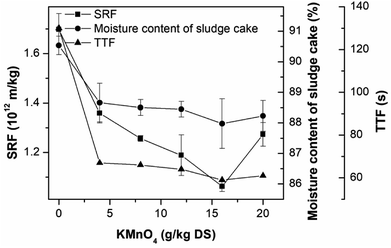
The effect of KMnO4 conditioning on the sludge dewaterability was studied by measuring the SRF, TTF and the moisture content of sludge cake, as shown in Fig. 1. The SRF, TTF and the moisture content of sludge cake of the raw sludge were 1.70 × 10¹² m kg−1, 130 s and 90.53%, respectively, showing poor dewaterability. An increase in the KMnO4 dosage from 0 to 16 g kg−1 DS significantly improved the sludge dewaterability, corresponding the reduction rates of 37.46%, 54.62% and 2.82% in the SRF, TTF and the moisture content, respectively. The sludge dewaterability became poor as the KMnO4 dosage was continued to add into the sludge sample. So the optimum KMnO4 dosage was 16 g kg−1 DS. This research was similar to the study of ultrasound pretreatment in the sludge dewatering. The lower intensities of ultrasound treatments improved sludge dewatering but the higher intensities were the opposite.66–68 Pearson's analysis showed that strong positively correlation were found between SRF and TTF (R = 0.922, p < 0.01), SRF and moisture content (R = 0.957, p < 0.01), and moisture content and TTF (R = 0.988, p < 0.01). The three parameters can express the sludge dewaterability and filterability.3.2. The change of EPS contents in the PAS
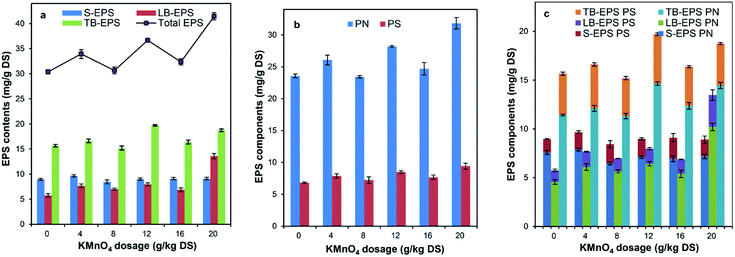
The total EPS content of the raw sludge was 30.38 mg g−1 DS. As shown in Fig. 2a, after the sludge conditioned with KMnO4, the total extractable EPS increased significantly with the percentage of 1% to 36.44%; the content of S-EPS, LB-EPS and TB-EPS also increased with the increase of KMnO4 dosage, while the content of LB-EPS increased more quickly than that of other EPS components. For example, when the KMnO4 dosage was 20 g kg−1 DS, the content of S-EPS, LB-EPS and TB-EPS increased by 1.75%, 136.12% and 19.67%, respectively. These results showed that the sludge DD increased and then lots of EPS were released from the sludge floc with KMnO4 oxidation, which were consistent with the research of Wu Y. et al.31 and Wu C. et al.36The PN and PS of the raw sludge were 23.57 and 6.81 mg g−1 DS, respectively. Fig. 2b shows the effect of KMnO4 dosage on the variation of PN and PS within total EPS. With the increase of KMnO4 dosage, the contents of PN and PS increased with different changes. When the KMnO4 dosage was 20 g kg−1 DS, the PN increased by 35.05% and the PS increased by 38.21%, compared with the raw sludge. The possible reason was that KMnO4 is likely to react with PN and PS in a different rate of degradation because of the different biochemical structure.69 The previous researches showed that the content of PN in the municipal sludge was more increased than that of PS,47,55 which were not consistent with our study. The reason was that the pulping sludge have much more PS such as cellulose and hemicellulose than other sludge.41
Fig. 2c expresses the contents of PN and PS in different fractions of EPS as sludge conditioned with KMnO4. With the increase of KMnO4 dosage, the contents of PS and PN in the LB-EPS increased, the content of PN in the TB-EPS increased, the content of PN in the S-EPS decreased and the content of PS in the S-EPS remained almost unchanged while the content of PS in the TB-EPS decreased firstly and then increased. This was not consistent with the conclusion of Shi Y. et al.69 The reason was that the redox potential of KMnO4 (Eφ = 0.59 V for pH ≥ 7) is lower than that of persulfate (Eφ = 2.60 V) and the oxidation capacity of sludge floc was weaker. This resulted in less EPS released. In addition, a reaction balance of KMnO4 lied in between the oxidative degradation of released EPS and the oxidative rupture of floc surface.
3.3. The rheological behavior in the PAS
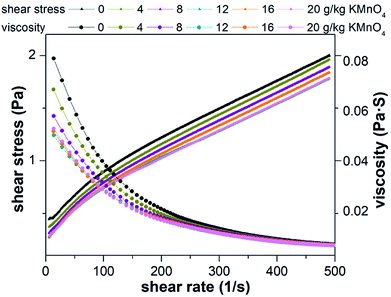
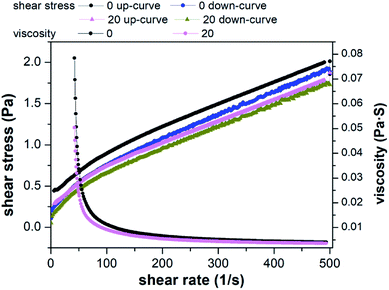
The three rheological models were used to fit the shear stress and shear rate. The statistical coefficients are shown in Table 1. Compared to Power law model and Bingham plastic model, Herschel–Bulkley model was found to be more efficient to describe the rheological behavior of the raw and conditioned sludge with the highest coefficient. In the Herschel–Bulkley model, τy, n and k are comprehensively considered. τy is the specified value of the stress exerted on sludge when it begins to flow.70 Lower k value indicates sludge firmness is weak and trend of k value is equal to the apparent viscosity. Based on the results of Herschel–Bulkley model, τy values decreased, k values decreased and n values increased by KMnO4 conditioning. In other words, sludge flowability increased and viscosity decreased, which agreed with the rheological results of Liu et al.71 and Wang et al.19 This phenomenon was the interaction between the sludge particles and was related to the weak steric hindrance in the sludge structure after pretreatment. This is consistent with the release of EPS, which can be an indication of the degree of sludge floc rupture. When the dosage of KMnO4 was 20 g kg−1 DS, it had a greater influence on sludge rheological behavior.
| KMnO4 dosage (g kg−1 DS) | Herschel–Bulkley parameters | Power law | Bingham law | Steady state viscositya (mPa s) | Hysteresis area (Pa s−1) | |||
|---|---|---|---|---|---|---|---|---|
| τy (Pa) | k | n | R2 | R2 | R2 | |||
| a Steady state viscosity of the raw and conditioned sludge samples at a rate of 5 s−1. | ||||||||
| 0 | 0.34707 | 0.02137 | 0.70004 | 0.99956 | 0.98919 | 0.98763 | 78.701 | 63.4 |
| 4 | 0.29512 | 0.01936 | 0.71679 | 0.99951 | 0.99114 | 0.98906 | 66.903 | 40.51 |
| 8 | 0.24081 | 0.02182 | 0.69587 | 0.99942 | 0.99368 | 0.98729 | 53.764 | 41.68 |
| 12 | 0.22672 | 0.01948 | 0.7034 | 0.99862 | 0.99281 | 0.98741 | 53.067 | 40.47 |
| 16 | 0.21893 | 0.02054 | 0.70254 | 0.99928 | 0.99415 | 0.98783 | 47.852 | 39.89 |
| 20 | 0.23985 | 0.01706 | 0.72431 | 0.9987 | 0.99191 | 0.98914 | 47.211 | 33.69 |
3.4. The bound water content and deep dewatering application of the PAS
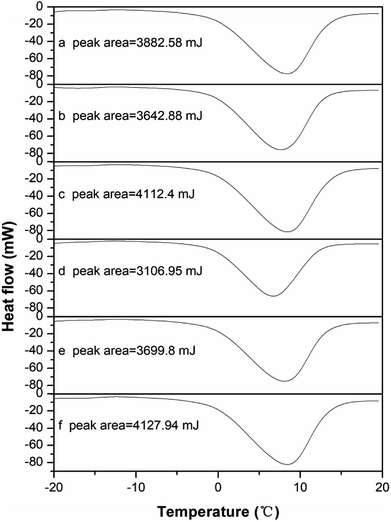
The DSC thermograms of the raw and conditioned sludge are shown in Fig. 5. The area below the baseline was related to the free water content of the sludge sample. The bound water content during pretreatment can be obtained according to the free and total water content. The endothermic curve ranged from −2 to 15 °C, which was similar to that researched by Zhang H. et al.33 and was wider than that researched by Ruiz-Hernando M.,48 possibly due to the difference of heating rates. The thermograms (Fig. 5a–f) were similar with each other but also had the slight differences, which was the result from the difference of sludge composition.63Fig. 6 shows the change of bound water content of the raw and conditioned sludge. As the KMnO4 dosage increased from 0 to 12 g kg−1 DS, the bound water content decreased from 1.58 g g−1 DS to 0.76 g g−1 DS significantly with the reduction of 51.68%; when the KMnO4 dosage increased further to 20 g kg−1 DS, the bound water increased slightly to 0.97 g g−1 DS. The content of bound water was minimized nearly the KMnO4 dosage of 12 g kg−1 DS. The results indicated that the bound water was released and converted into free water as a result of EPS degraded after KMnO4 conditioning. The value of bound water in this research was different from other researches,33,47,48 which may be related to the non-uniformity of the sludge sample during DSC operating. Previous studies showed that the bound water was one of the major limiting factors influencing sludge dewatering efficiency and a decrease of the bound water was a key step to enhance the dewaterability.74 As KMnO4 was added into the sludge, the values of SRF and bound water decreased but had different reduction rates. This indicated that the bound water content can be related to not only SRF but also the combination with sludge particles. So it can express the sludge dewaterability on some extent.
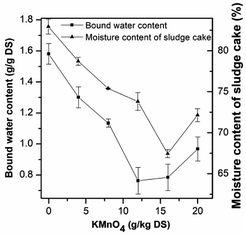 | ||
| Fig. 6 Effect of KMnO4 dosage on the sludge bound water content and moisture content of sludge cake after deep dewatering. | ||
As mentioned above, the moisture content of sludge cake was relatively high after dewatering at low pressure (0.03 MPa) in the experiment of SRF. Therefore, high pressure (1.25 MPa) was used to deep dewatering. As shown in Fig. 6, the moisture content of raw sludge decreased from 98.75% to 82.96%, while that of the conditioned sludge with 16 g kg−1 DS decreased to 67.46% with the lowest value. The dewatered sludge cake with the lower moisture content could be beneficial for transportation and saving drying costs.
3.5. The microstructural characteristic in the PAS
The wet raw and conditioned sludge cake could be obtained by the SRF measurement. The former was relatively soft but the latter was compact. As shown in Fig. 7, there was no obvious change of particle size in the raw and conditioned sludge, which revealed that treatment did not cause complete floc rupture but stripped the floc surface by redox reaction. The change of particle size was similar to that in the sludge disintegration of O3 treatment. When the dosage was 0.1 g g−1 TS−1, the median diameter decreased from 36.3 μm for the raw sludge to 33.2 μm.24 However, the particle size decreased significantly by ultrasound treatment, which broke aggregates, flocs and cells.75 Due to the creation of cation chemical bonds, some treatments such as thermal,24 acid47 and potassium ferrite34 led to particles agglomeration and the particle size increased.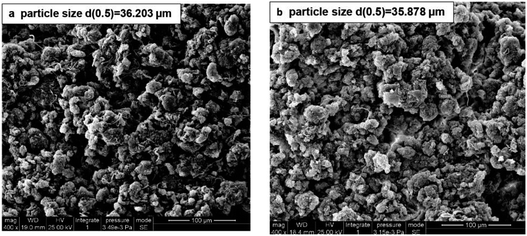 | ||
| Fig. 7 SEM images of the raw sludge (a) and conditioned sludge cake with KMnO4 dosage of 16 g kg−1 DS (b). | ||
3.6. The mechanism and feasibility of KMnO4 conditioning on the PAS dewatering
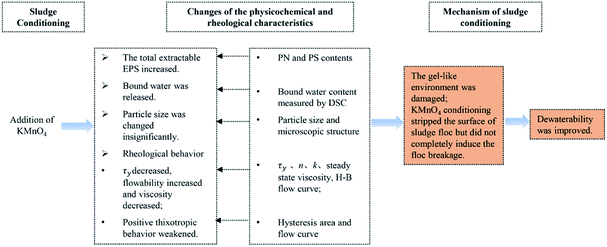
In order to accurately analyze the relationship between the sludge dewaterability and other parameters and then elaborate the mechanism of KMnO4 conditioning on the sludge dewatering, Pearson's correlations were calculated (Table S†). The results showed that SRF was significantly positive correlated with the bound water content (R = 0.930, p < 0.05), the steady state viscosity (R = 0.911, p < 0.05), hysteresis area (R = 0.839, p < 0.05) and τy (R = 0.959, p < 0.01); the significant positive correlations were also found between the bound water content and τy (R = 0.954, p < 0.01), the bound water content and the steady state viscosity (R = 0.971, p < 0.05), the steady state viscosity and τy (R = 0.971, p < 0.01), and the steady state viscosity and hysteresis area (R = 0.865, p < 0.05). Additionally, the KMnO4 dosage was significantly negative correlated with τy (R = 0.837, p < 0.05) and steady state viscosity (R = 0.928, p < 0.01). The content of the total EPS was significantly positive correlated with the content of LB-EPS (R = 0.933, p < 0.01), the content of PN (R = 0.999, p < 0.01), the content of PS (R = 0.987, p < 0.01), the content of TB-EPS (R = 0.850, p < 0.05) and n (R = 0.814, p < 0.05), but was significantly negative correlated with k (R = 0.966, p < 0.01). Moderate correlations were found between the other parameters. There are strong correlations between KMnO4 conditioning, the changes of the physiochemical and rheological characteristics, and sludge dewaterability, which can reflect the mechanism of sludge dewatering. Among them, the rheological behavior can indirectly reflect the sludge dewatering mechanism and act an indicator between conditioning and dewatering. The changes of EPS in different fractions can't directly reflect the change of sludge dewaterability clearly and the comprehensive analyses are needed. Additionally, in this study, the sludge dewaterability was poor with the KMnO4 dosage increasing continuously. We can speculate the reason that it is the comprehensive effect between the increase of EPS released and the decrease of free water content, and then resulted in the decrease of τy and viscosity, which deny the speculation of Wu et al.31Based on the experimental results, we can propose that the mechanism of KMnO4 conditioning on sludge dewatering includes three elements, that is, sludge conditioning, changes of the physicochemical and rheological characteristics and dewaterability, as shown in Fig. 8. These changes made the gel-like environment damaged but did not completely induce the floc breakage as a result of the lower redox potential under the neutral pH value. Therefore, sludge dewaterability was improved. The enzyme25 and ozone24 has the weak dewaterability because of the low redox potential. Chen et al. (2015)25 studied that the SRF decreased by about 25% after sludge conditioned with the optimum dosage of alpha amylase. Other oxidants with higher redox potential and flocculants are more effective on dewatering performance.18,34,35 Guo et al. (2019)27 found that the SRF decreased by 36.4% when wheat straw powder was added alone, which was caused by the formation of skeleton channels in the sludge; the SRF decreased by 65.6% and deep dewatered sludge moisture content reached to 58.2% in the combination of wheat straw powder and persulfate, which was the result of strong oxidation and skeleton builder. And Shi et al. (2015)21 studied the sludge dewatering effect conditioned with the individual or combination addition and found that the SRF decreased by 91.6% with the combination addition. In this study, the SRF decreased by 37.46% after the sludge conditioned with KMnO4, which was similar to that conditioned with weaker oxidants and skeleton builders. Therefore, the combination conditioning methods might be better for further improve the dewatering in the practice and will be the next research.
The value of pH in the pulping sludge is close to neutral (pH = 6.96) and after KMnO4 oxidation, the Mn state in the filtrate mainly transferred to Mn2+ and MnO4−. According to the national standard (GB 18918-2002),76 the maximum limit of the gross Mn is 2 mg L−1. After KMnO4 pretreatment, the Mn content in the filtrate is very low (only 4 mg L−1 for KMnO4 dosage with 100 g kg−1 DS).36 Considering the smaller percentage of sludge in the wastewater (1–2%),77 KMnO4 pretreatment will not cause the Mn content exceeding the national standard and conform to the local environment policy. Most of the Mn are deposited in the sludge cake in the form of MnO2, which is relatively stable, nontoxic and may insignificantly influence the further sludge treatment and disposal. Therefore, it is feasible for sludge conditioning with KMnO4 oxidation.
4. Conclusions
This study investigated the effect and mechanism of KMnO4 conditioning on sludge dewaterability by changes of the physicochemical and rheological characteristics. After the sludge conditioned with a lower dosage of KMnO4, the main changes were as follows.(1) The sludge dewaterability was significantly improved and the optimum dosage was 16 g kg−1 DS, corresponding the reduction rate of SRF, moisture content and TTF by 37.46%, 2.82% and 54.62%.
(2) The total extractable EPS increased significantly, while the content of LB-EPS increased more quickly than that of other EPS components.
(3) The sludge flowability increased, viscosity decreased and the sludge thixotropic behavior became weakened, which may be the reason of rupturing the sludge colloidal environment among particles.
(4) The bound water was released and converted into free water as a result of EPS degraded and deep dewatered sludge moisture content reached to 67.46% under 1.25 MPa pressure.
(5) There was no obvious change of particle size in the raw and conditioned sludge.
Then the mechanism of KMnO4 conditioning on sludge dewatering was systematically elaborated. The pretreatment made the gel-like environment damaged but did not completely induce the floc breakage as a result of the lower redox potential under the neutral pH value. Therefore, sludge dewaterability was improved. On the perspective of environmental safety, it is feasible for KMnO4 conditioning on sludge dewatering.
Conflicts of interest
There are no conflicts to declare.Acknowledgements
This research was supported by grants from the Open Foundation of State Key Lab of Pulp and Paper Engineering at South China University of Technology (201780), National Major Science and Technology Program for Water Pollution Control and Treatment (2017ZX07402004) and the Priority Academic Program Development of Jiangsu Higher Education Institution (PAPD).References
- B. Q. Lin and Q. Y. Zheng, J. Cleaner Prod., 2017, 140, 1105–1117 CrossRef.
- C. Guo and S. Kuang, China Paper Newsletters, 2018, 64–68 Search PubMed.
- D. Pokhrel and T. Viraraghavan, World Pulp & Paper, 2005, 333, 37–58 Search PubMed.
- L. Appels, J. Baeyens, J. Degrève and R. Dewil, Prog. Energy Combust. Sci., 2008, 34, 755–781 CrossRef CAS.
- A. Elliott and T. Mahmood, Water Res., 2007, 41, 4273–4286 CrossRef CAS PubMed.
- A. MahmoudEmail, J. Olivier, J. Vaxelaire and A. F. A. Hoadley, Advances in Mechanical Dewatering of Wastewater Sludge Treatment, Springer, Netherlands, 2013 Search PubMed.
- A. Mahmoud, J. Olivier, J. Vaxelaire and A. F. A. Hoadley, Water Res., 2010, 44, 2381–2407 CrossRef CAS.
- F. Frølund, R. Palmgren, K. Keiding and P. H. Nielsen, Water Res., 1996, 30, 1749–1758 CrossRef.
- J. Zhou, G. Zheng, X. Zhang and L. Zhou, PLoS One, 2014, 9, e102688 CrossRef PubMed.
- X. Y. Li and S. F. Yang, Water Res., 2007, 41, 1022–1030 CrossRef CAS PubMed.
- L. Shao, P. He, G. Yu and P. He, J. Environ. Sci., 2009, 21, 83–88 CrossRef CAS.
- L. Zheng, S. Y. Sun, Y. B. Xu, B. J. Liu, W. T. Yao, M. S. Cai and W. J. Tong, Adv. Mater. Res., 2011, 347–353, 2008–2014 Search PubMed.
- H. Liu and H. Fang, J. Biotechnol., 2002, 95, 249–256 CrossRef CAS.
- B. Jin, B. Wilén and P. Lant, Chem. Eng. J., 2004, 98, 115–126 CrossRef CAS.
- K. Song, X. Zhou, Y. Liu, G. Xie, D. Wang, T. Zhang, C. Liu, P. Liu, B. Zhou and Q. Wang, Chem. Eng. J., 2016, 295, 436–442 CrossRef CAS.
- D. Mowla, H. N. Tran and D. G. Allen, Biomass Bioenergy, 2013, 58, 365–378 CrossRef CAS.
- B. Peeters, R. Dewil, L. Vernimmen, B. Van den Bogaert and I. Y. Smets, Water Res., 2013, 47, 3600–3609 CrossRef CAS PubMed.
- M. Niu, W. Zhang, D. Wang, Y. Chen and R. Chen, Bioresour. Technol., 2013, 144, 337–343 CrossRef CAS PubMed.
- H. Wang, H. Wang, H. Hu and R. J. Zeng, RSC Adv., 2017, 7, 30274–30282 RSC.
- C. Chen, P. Zhang, G. Zeng, J. Deng and Y. Zhou, Chem. Eng. J., 2010, 158, 616–622 CrossRef CAS.
- Y. Shi, J. Yang, W. Yu, S. Zhang, S. Liang, J. Song, Q. Xu, N. Ye, S. He and C. Yang, Chem. Eng. J., 2015, 270, 572–581 CrossRef CAS.
- Y. Lin, S. Jing and D. Lee, Bioresour. Technol., 2001, 76, 161–163 CrossRef CAS PubMed.
- Y. Wu, P. Zhang, H. Zhang, G. Zeng, J. Liu, J. Ye, W. Fang and X. Gou, Bioresour. Technol., 2016, 205, 258–263 CrossRef CAS PubMed.
- C. Bougrier, C. Albasi, J. P. Delgenès and H. Carrère, Chem. Eng. Process., 2006, 45, 711–718 CrossRef CAS.
- Z. Chen, W. Zhang, D. Wang, T. Ma and R. Bai, Water Res., 2015, 83, 367–376 CrossRef CAS PubMed.
- C. Zhu, F. Li, P. Zhang, J. Ye, P. Lu and H. Wang, Powder Technol., 2018, 336, 191–198 CrossRef CAS.
- S. Guo, H. Liang, L. Bai, F. Qu, A. Ding, B. Ji, X. Wang and G. Li, Chemosphere, 2018, 215, 333–341 CrossRef.
- J. Novak, M. Agerbæk, B. Sørensen and J. Hansen, J. Environ. Eng., 1998, 125, 816–824 CrossRef.
- J. Kopp and N. Dichtl, Water Sci. Technol., 2001, 43, 135–143 CrossRef CAS.
- J. Fu and W. Cai, J. Chem. Eng. Jpn., 2007, 40, 1113–1120 CrossRef CAS.
- Y. Wu, P. Zhang, G. Zeng, J. Liu, J. Ye, H. Zhang, W. Fang, Y. Li and Y. Fang, J. Taiwan Inst. Chem. Eng., 2017, 74, 121–128 CrossRef CAS.
- E. Neyens and J. Baeyens, J. Hazard. Mater., 2003, 98, 33–50 CrossRef CAS.
- H. Zhang, J. Yang, W. Yu, S. Luo, L. Peng, X. Shen, Y. Shi, S. Zhang, J. Song, N. Ye, Y. Li, C. Yang and S. Liang, Water Res., 2014, 59, 239–247 CrossRef CAS PubMed.
- C. Wu, L. Y. Jin, P. Y. Zhang, G. M. Zhang and R. Boopathy, Int. Biodeterior. Biodegrad., 2015, 102, 137–142 CrossRef CAS.
- G. Zhen, X. Lu, Y. Zhao, X. Chai and D. Niu, Bioresour. Technol., 2012, 116, 259–265 CrossRef CAS PubMed.
- C. Wu, G. Zhang, P. Zhang and C. Chang, Chem. Eng. J., 2014, 240, 420–425 CrossRef CAS.
- M. I. Badawy and M. E. Ali, J. Hazard. Mater., 2006, 136, 961–966 CrossRef CAS PubMed.
- N. Li, M. Fan, J. Van Leeuwen, B. Saha, H. Yang and C. P. Huang, J. Environ. Sci., 2007, 19, 783–786 CrossRef CAS.
- J. Du, S. Bo, Z. Jing and G. Xiaohong, Environ. Sci. Technol., 2012, 46, 8860–8867 CrossRef CAS PubMed.
- J. Liang, X. Ning, X. Lai, H. Zou, J. Sun, X. Lu, Y. Zhang and T. An, J. Cleaner Prod., 2017, 151, 172–178 CrossRef CAS.
- T. Meyer and E. A. Edwards, Water Res., 2014, 321–349 CrossRef CAS PubMed.
- M. F. Xia, Z. W. Wang, Z. C. Wu, X. H. Wang and Z. Zhou, J. Environ. Sci., 2009, 21, 1639–1645 CrossRef.
- N. Ratkovich, W. Horn, F. P. Helmus, S. Rosenberger, W. Naessens, I. Nopens and T. R. Bentzen, Water Res., 2013, 47, 463–482 CrossRef CAS PubMed.
- F. Markis, Sludge rheology: semi – empirical correlations to predict the apparent viscosity and yield stress of sludge mixtures, RMIT University, 2015 Search PubMed.
- J. Zhang, Y. Xue, N. Eshtiaghi, X. Dai, W. Tao and Z. Li, Water Res., 2017, 116, 34–43 CrossRef CAS PubMed.
- F. Yang, A. Bick, S. Shandalov, A. Brenner and G. Oron, J. Membr. Sci., 2009, 334, 83–90 CrossRef CAS.
- H. Wang, Y. Ma, H. Wang, H. Hu, H. Yang and R. J. Zeng, Water Res., 2017, 122, 398–406 CrossRef CAS PubMed.
- M. Ruiz-Hernando, F. Simón, J. Labanda and J. Llorens, Chem. Eng. J., 2014, 255, 14–22 CrossRef CAS.
- K. Xiao, Y. Chen, X. Jiang, Q. Yang, W. Y. Seow, W. Zhu and Y. Zhou, Water Res., 2017, 109, 13–23 CrossRef CAS PubMed.
- J. Conrardy, J. Vaxelaire and J. Olivier, Water Res., 2016, 100, 194–200 CrossRef CAS PubMed.
- C. Wisniewski and A. Grasmick, Colloids Surf., A, 1998, 138, 403–411 CrossRef CAS.
- Y. Qi, K. B. Thapa and A. F. A. Hoadley, Chem. Eng. J., 2011, 171, 373–384 CrossRef CAS.
- I. Lo, K. Lai and G. H. Chen, Environ. Sci. Technol., 2001, 35, 4691–4696 CrossRef CAS PubMed.
- G. Zhen, X. Lu, Y. Li, Y. Zhao, B. Wang, Y. Song, X. Chai, D. Niu and X. Cao, Bioresour. Technol., 2012, 119, 7–14 CrossRef CAS PubMed.
- B. Frølund, T. Griebe and P. H. Nielsen, Appl. Microbiol. Biotechnol., 1995, 43, 755–761 CrossRef.
- L. Hammadi, A. Ponton and M. Belhadri, Energy Procedia, 2011, 6, 302–309 CrossRef CAS.
- B. Chen, S. Lee and D. J. Lee, Water Res., 2005, 39, 4429–4435 CrossRef CAS PubMed.
- R. Vankaam, D. Annearchard, M. Gaubert and C. Albasi, J. Membr. Sci., 2008, 317, 26–33 CrossRef CAS.
- F. Pignon, G. Belina, T. Narayanan, X. Paubel, A. Magnin and G. Gesan-Guiziou, J. Chem. Phys., 2004, 121, 8138–8146 CrossRef CAS PubMed.
- G. H. Feng, L. Y. Liu and W. Tan, Ind. Eng. Chem. Res., 2014, 27, 11185–11192 CrossRef.
- X. Feng, B. Tang, L. Bin, H. Song, S. Huang, F. Fu, J. Ding, C. Chen and C. Yu, Biochem. Eng. J., 2016, 114, 147–154 CrossRef CAS.
- APHA, Standard Methods for the Examination of Water and Wastewater, American Public Health Association, Washington D.C., US, 21st edn, 2005 Search PubMed.
- D. Lee and S. F. Lee, J. Chem. Technol. Biotechnol., 1995, 62, 359–365 CrossRef CAS.
- N. Katsiris and A. Kouzeli-Katsiri, Water Res., 1987, 21, 1319–1327 CrossRef CAS.
- C. C. Wu, C. Huang and D. J. Lee, Water Res., 1998, 32, 900–904 CrossRef CAS.
- F. Wang, M. Ji and S. Lu, Environ. Prog., 2006, 25, 257–260 CrossRef CAS.
- F. Hogan, S. Mormede, P. Clark and M. Crane, Water Sci. Technol., 2004, 50, 25–32 CrossRef CAS PubMed.
- J. Bien and L. Wolny, Water Sci. Technol., 1997, 36, 101–106 CrossRef CAS.
- Y. Shi, J. Yang, W. Mao, Y. Li, X. Xu, H. Zhang, W. Yu, Y. Li and C. Yang, Desalin. Water Treat., 2015, 53, 2655–2663 CrossRef CAS.
- S. Baroutian, N. Eshtiaghi and D. J. Gapes, Bioresour. Technol., 2013, 140, 227–233 CrossRef CAS PubMed.
- J. Liu, D. Yu, J. Zhang, M. Yang, Y. Wang, Y. Wei and J. Tong, Water Res., 2016, 98, 98–108 CrossRef CAS PubMed.
- J. Liu, Y. Wei, K. Li, J. Tong, Y. Wang and R. Jia, Water Res., 2016, 90, 225–234 CrossRef CAS PubMed.
- N. Eshtiaghi, F. Markis, S. D. Yap, J. C. Baudez and P. Slatter, Water Res., 2013, 47, 5493–5510 CrossRef CAS PubMed.
- J. Robinson and W. R. Knocke, Water Environ. Res., 1992, 64, 60–68 CrossRef CAS.
- A. Tiehm, K. Nickel, M. Zellhorn and U. Neis, Water Res., 2001, 35, 2003–2009 CrossRef CAS PubMed.
- GB 18918-2002, Discharge standard of pollutants for municipal wastewater treatment plant, Beijing, China, Ministry of Ecology and Environment of China, 2002 Search PubMed.
- G. Zhen, X. Lu, H. Kato, Y. Zhao and Y. Li, Renewable Sustainable Energy Rev., 2017, 69, 559–577 CrossRef CAS.
Footnote |
| † Electronic supplementary information (ESI) available: Table S. See DOI: 10.1039/c8ra07822j |
| This journal is © The Royal Society of Chemistry 2018 |

