 Open Access Article
Hierarchically ordered macro–mesoporous anatase TiO2 prepared by pearl oyster shell and triblock copolymer dual templates for high photocatalytic activity
Jianquan Zhaoa,
Chanjuan Liao *b,
Xia Chena and
Wulin Song
 *ac
*ac
aAnalytical and Testing Center, Huazhong University of Science and Technology, Wuhan 430074, People's Republic of China
bCollege of Resources and Environment, Hunan Agricultural University, Changsha 410128, People's Republic of China
cState Key Laboratory of Materials Processing, Die & Mould Technology, Huazhong University of Science and Technology, Wuhan 430074, People's Republic of China
First published on 14th November 2018
Abstract
Hierarchically ordered macro–mesoporous anatase TiO2 is prepared by combining the supramolecular-templating self-assembly of amphiphilic triblock copolymer P123 with a natural pearl oyster shell in a hard-templating process by a facile sol–gel reaction. The obtained materials are characterized by Raman spectroscopy, X-ray diffraction, N2 adsorption–desorption analysis, scanning electron microscopy, and transmission electron microscopy. The results demonstrate that all TiO2 materials obtained after calcination at various temperatures are in the anatase phase, and interestingly the resultant ordered structure of both macropores and mesopores are well-preserved after calcination at 350 °C or 450 °C, with the walls of macropores composed of ordered mesopores. However, upon calcination at 550 °C or 650 °C, while the ordered macroporous structures remain well-preserved, the mesoporous structures collapse. The photocatalytic activities of the resulting TiO2 materials are also evaluated by photodegradation of rhodamine B under UV light irradiation. The prepared TiO2 calcined at 450 °C shows the highest photocatalytic activity.
Introduction
Porous materials including microporous (pore size below 2 nm), mesoporous (2–50 nm), and macroporous (beyond 50 nm) materials have received much attention due to their potential applications in the fields of catalysis, ion exchange, adsorption, and separation.1–4 Since the discovery of MCM-41 and SBA-15 in the 1990s,5,6 the use of surfactants and amphiphilic block copolymers as templates to construct mesoporous structures has been extended to the preparation of non-silica mesoporous metal oxides. Over the past few decades, ordered mesoporous TiO2, ZrO2, Al2O3, Nb2O5, Ta2O5, WO3, SnO2 and MnO2 have been synthesized because of their special optical, electronic, and magnetic properties.7–9TiO2 is an attractive semiconducting metal oxide material that exhibits widespread potential applications in catalysis, photocatalysis, sensors, and dye-sensitized solar cells, and so on.10–13 Among various potential applications, the photocatalytic activity of TiO2 possesses most distinctive features and is mainly determined by its crystalline phase, crystallite size, specific surface areas, and porous structures. Among the crystalline phases of TiO2, the anatase phase has been proven to have the highest photocatalytic activity compared with amorphous, rutile, and brookite TiO2.14,15 The high photocatalytic activity of TiO2 is related to its small crystallite size because of quantum size effects.16 Mesoporous TiO2 materials typically possess large specific surface areas and exhibit excellent photocatalytic activities due to the fact that the active sites are usually located in their mesopores. Mesostructures with high specific surface areas can provide more active adsorption sites and photocatalytic reaction centers.16–19 These mesoporous TiO2 materials can be prepared by using various templates involving an alkyl phosphate, block polymer, ionic surfactants, and nonsurfactants.20–23 However, the thermal stability of the resulting materials is the bottleneck in their synthesis. Heat treatment at elevated temperatures can cause the collapse of mesoporous structures. The sizes of the mesopores are often only several nanometers, limiting the efficient diffusion of organic molecules through the pores. This limitation can be overcome by fabricating a hierarchical porous system.
Considerable efforts have recently been exerted to fabricate the hierarchical macro–mesoporous TiO2 materials with improved textural properties and potential applications.24–27 Textural mesopores possess high specific surface area and their active sites are usually located in them. Interconnected macropores can optimize the transportation of matter and reduce transport limitations.28 Several research groups have reported the preparation of hierarchical macro–mesoporous TiO2 materials. Wang et al. and Yuan et al. demonstrated a simple procedure for the synthesis of macro–mesoporous TiO2 materials by the single surfactant templating technique under hydrothermal conditions.28,29 Yu et al. described a simpler and environmentally benign method for the preparation of macro–mesoporous TiO2 materials in pure water without using templates and additives.30 However, almost all of the mesoporous structures yielded by these resulting TiO2 materials are disordered because the hydrolysis and condensation rates of titanium precursors (generally chlorides or alkoxides) are difficult to control. Recently, hierarchically ordered macro–mesoporous TiO2 materials were successfully synthesized by dual templating of polystyrene (PS) arrays and triblock copolymer.31–35 However, the typical procedure to fabricate a PS colloidal crystal template involves a complicated emulsion polymerization process and a complex vertical deposition procedure, both of which are very complicated and expensive. Compared with artificial templates, biological templates are low-lost, abundant, renewable, inexpensive, and environmentally benign. These templates also yield unique multilevel structures and morphologies, making it possible to synthesize hierarchical porous materials.36,37
In the present work, we report, for the first time, a facile approach for the preparation of hierarchically ordered macro–mesoporous anatase TiO2 materials using triblock copolymer P123 and natural pearl oyster shell as dual templates. P123 is employed to produce highly ordered mesopores as a mesopore-directing agent. Inexpensive and environment-friendly pearl oyster shell is used as an ideal biotemplate for the fabrication of macroporous structures. The crystalline anatase phase and perfect and intact macro–mesoporous structures are simultaneously obtained after calcination at 450 °C. The photocatalytic activities of the resulting TiO2 materials calcined at various temperatures are also discussed.
Experimental section
Materials
Triblock copolymer Pluronic P123 (molecular weight, Mw = 5800 g mol−1, EO20PO70EO20) was purchased from Aldrich. Acetylacetone (CH2(COCH3)2), tetrabutyl titanate (Ti(OC4H9)4), hydrochloric acid, ethanol and Rhodamine B (RhB) were purchased from Sinopharm Chemical Reagent Co., Ltd. (Shanghai, China). Ultrapure water (18.2 MΩ) was obtained from a Milli-Q water system. All chemicals were of analytical grade and were used as received without further purification.The natural pearl oyster shells used in this study were obtained from Guangzhou province of China. The shell comprises calcium carbonate and organic matrices, which is generally composed of two mineralized layers, the calcitic prismatic layer on the outside and the aragonitic nacreous layer on the inside (Fig. 1). On top of the prismatic layer, an organic material called the periostracum covers the external surface of the shell (Fig. 1a).
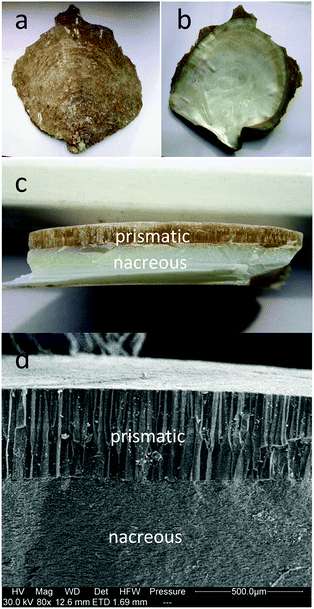 | ||
| Fig. 1 The photographs of the pearl oyster shell: (a) the top surface, (b) the bottom surface, (c) the cross-section; (d) the cross-sectional SEM image of the pearl oyster shell. | ||
Fabrication of the pearl oyster shell biotemplate
The natural pearl oyster shells were initially sliced into some pieces, and then the periostracum of shell was worn away by abrasion from sandpaper. The obtained shells were washed with an ultrasonic cleaner in ultrapure water to remove adhered impurities. Subsequently, the cleaned shells were soaked in 6 M HCl solution in order to remove the calcium carbonate, then washed with ultrapure water, followed by ethanol, and finally dried at room temperature in air. The resultant pearl oyster shell biotemplate was fabricated.Preparation of hierarchically ordered macro–mesoporous anatase TiO2 materials
In a typical procedure,33 P123 was dissolved in an ethanolic HCl solution, which contained a small quantity of H2O, under vigorous stirring for 1 h. Then, acetylacetone was added into this transparent solution, followed by stirring for an additional 20 min. Tetrabutyl titanate (Ti(OC4H9)4) was added in the solution and the mixture was further stirred at room temperature in a sealed bottle for 24 h at a slow speed. The final molar ratio was Ti(OC4H9)4![[thin space (1/6-em)]](https://www.rsc.org/images/entities/char_2009.gif) :
:![[thin space (1/6-em)]](https://www.rsc.org/images/entities/char_2009.gif) P123
P123![[thin space (1/6-em)]](https://www.rsc.org/images/entities/char_2009.gif) :
:![[thin space (1/6-em)]](https://www.rsc.org/images/entities/char_2009.gif) HCl
HCl![[thin space (1/6-em)]](https://www.rsc.org/images/entities/char_2009.gif) :
:![[thin space (1/6-em)]](https://www.rsc.org/images/entities/char_2009.gif) EtOH
EtOH![[thin space (1/6-em)]](https://www.rsc.org/images/entities/char_2009.gif) :
:![[thin space (1/6-em)]](https://www.rsc.org/images/entities/char_2009.gif) H2O
H2O![[thin space (1/6-em)]](https://www.rsc.org/images/entities/char_2009.gif) :
:![[thin space (1/6-em)]](https://www.rsc.org/images/entities/char_2009.gif) CH2(COCH3)2 = 1
CH2(COCH3)2 = 1![[thin space (1/6-em)]](https://www.rsc.org/images/entities/char_2009.gif) :
:![[thin space (1/6-em)]](https://www.rsc.org/images/entities/char_2009.gif) 0.01
0.01![[thin space (1/6-em)]](https://www.rsc.org/images/entities/char_2009.gif) :
:![[thin space (1/6-em)]](https://www.rsc.org/images/entities/char_2009.gif) 0.79
0.79![[thin space (1/6-em)]](https://www.rsc.org/images/entities/char_2009.gif) :
:![[thin space (1/6-em)]](https://www.rsc.org/images/entities/char_2009.gif) 12.86
12.86![[thin space (1/6-em)]](https://www.rsc.org/images/entities/char_2009.gif) :
:![[thin space (1/6-em)]](https://www.rsc.org/images/entities/char_2009.gif) 4.89
4.89![[thin space (1/6-em)]](https://www.rsc.org/images/entities/char_2009.gif) :
:![[thin space (1/6-em)]](https://www.rsc.org/images/entities/char_2009.gif) 0.10. After that, the obtained pearl oyster shell biotemplates were immersed into the resulting sol solution and were held for 30 min to let the TiO2 precursor coat onto the macroporous walls in the shells. The coated samples were dried at room temperature for 7 days. In the drying process, the optimal relative humidity (RH) was 70–75%. After drying, the samples were submitted to thermal treatment at 90 °C for 24 h to consolidate the inorganic network, and were then calcined in air at 350, 450, 550, and 650 °C for 3 h at a heating rate of 1 °C min−1 to remove the dual templating. The obtained samples were denoted as T350, T450, T550 and T650, respectively.
0.10. After that, the obtained pearl oyster shell biotemplates were immersed into the resulting sol solution and were held for 30 min to let the TiO2 precursor coat onto the macroporous walls in the shells. The coated samples were dried at room temperature for 7 days. In the drying process, the optimal relative humidity (RH) was 70–75%. After drying, the samples were submitted to thermal treatment at 90 °C for 24 h to consolidate the inorganic network, and were then calcined in air at 350, 450, 550, and 650 °C for 3 h at a heating rate of 1 °C min−1 to remove the dual templating. The obtained samples were denoted as T350, T450, T550 and T650, respectively.
Characterization
Raman spectroscopy was employed to determine the crystal phases of TiO2 samples. Raman spectra were obtained using a Raman microspectrometer (LabRam HR800, Jobin Yvon, France) with the 632.8 nm line of a He–Ne laser as excitation source. The collection time of TiO2 spectrum was 5 s over a spectral range from 100 to 1000 cm−1. X-ray diffraction (XRD) patterns were recorded on an X-ray diffractometer (X'Pert PRO MRD, PANalytical, Netherlands) with CuK0 radiation (λ = 1.5406 Å) operated at 40 kV and 50 mA. The data were collected in a step of 0.05° s−1 with the scattering angles (2θ) ranging from 10° to 90°. N2 adsorption–desorption isotherms were determined on a Micromeritics Tristar 3000 system (USA) at 77 K. The samples were degassed in a vacuum at 180 °C prior to the measurements. The surface areas were obtained by the Brunauer–Emmett–Teller (BET) method, and the pore size distributions were estimated from the nitrogen desorption branch of the isotherms by the Barrett–Joyner–Halenda (BJH) model. Morphological investigations were carried out by using a scanning electron microscope (Nova NanoSEM 450, FEI, Netherlands) and a transmission electron microscope (Tecnai G2 F30, FEI, Netherlands).Photocatalytic activity test
The photocatalytic activity experiments on the obtained TiO2 samples were performed by photodegradation of RhB under UV-light irradiation at ambient temperature and pressure. The UV source was a 250 W Hg lamp with a maximum emission at approximately 365 nm. The lamp was placed above the RhB solution with a distance of about 30 cm and was kept cool by a recirculating water jacket (Pyrex). In a typical protocol, the TiO2 sample (0.01 g) was dispersed in RhB dye solution (80 ml, C0 = 1 ×=10−5 M, pH 6.0) in ultrasonication. The suspension was then magnetically stirred in dark for 30 min to establish an adsorption–desorption equilibrium between the catalyst surface and the dye, and then the reaction mixture was exposed to the UV light with continuous magnetic stirring. The suspension (5 ml) was centrifuged to remove the catalysts every 20 min and the residual RhB solution was analyzed by a UV-Vis scanning spectrophotometer (UV-2550, Shimadzu, Japan) at λmax = 554 nm. For comparison, the photocatalytic activity of commercial photocatalyst Degussa P25 was also characterized under the identical experimental conditions. Three samples of each kind of TiO2 were selected to repeat the experiments, and the average values were shown here.Results and discussion
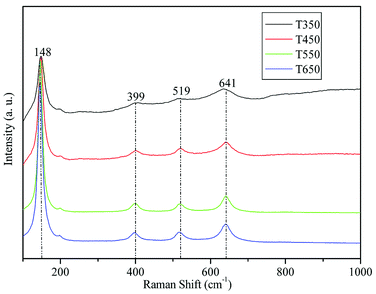
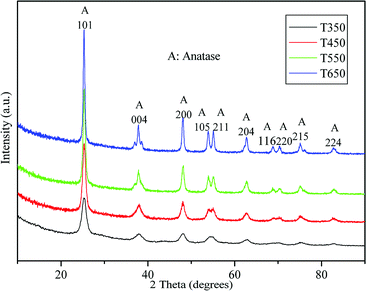
Fig. 2 shows the Raman spectra of the TiO2 samples calcined at 350, 450, 550, and 650 °C. As shown in the figure, the four bands located at 148, 399, 519, and 641 cm−1 can be assigned to the characteristic pattern of anatase without the presence of any trace of the rutile or brookite phase.33,38 This finding demonstrates that the TiO2 samples calcined at 350, 450, 550, and 650 °C are in pure anatase phase.The crystal phase and crystalline size of the TiO2 samples were characterized by XRD. Fig. 3 shows XRD patterns of the TiO2 samples calcined at various temperatures. For all sintered samples, the ten diffraction peaks, indexed as (101), (004), (200), (105), (211), (204), (116), (200), (215), and (224) reflections of anatase phase (JCPDS, no. 21-1272), indicating the formation of anatase TiO2 nanocrystallites after calcination at 350, 450, 550, and 650 °C. The crystalline size calculated by the Scherrer formula using the (101) peak of anatase TiO2, is listed in Table 1. At 350 °C, a broad peak corresponding to the (101) plane diffraction of anatase TiO2 is observed. The broadening of the diffraction peak is due to the small crystallite size (7.8 nm) and weak crystallization of the sample. As the calcination temperature increases from 450 °C to 650 °C, the peak intensities of anatase increase, indicating an enhancement in crystallization. Meanwhile, the width of the (101) plane diffraction peak becomes narrower, showing an increase in anatase crystalline size from 10.3 to 20.8 nm (see Table 1). Further observation shows that phase transformation from anatase to rutile does not take place in TiO2 samples during calcination at high temperatures, the pure anatase phase without any other crystalline by-products is present at 650 °C. These findings indicate that the obtained TiO2 samples have high thermal stability, which can be attributed to mesoporous agglomeration and the thermal treatment.31,39 On the one hand, the loose structure of TiO2 species during mesoporous agglomeration confines mass transfer for phase transition, resulting in an elevation of the anatase–rutile transition temperature; on the other hand, thermal treatment at 90 °C for 24 h before calcination can consolidate the inorganic network, ensuring the formation of anatase structures. The results obtained are also in good agreement with the results of the Raman spectra.
| Calcination temperature (°C) | Phase | SBET (m2 g−1) | Pore volume (cm3 g−1) | Average pore size (nm) | Crystalline size (nm) |
|---|---|---|---|---|---|
| 350 | Anatase | 175.42 | 0.26 | 4.41 | 7.8 |
| 450 | Anatase | 125.91 | 0.21 | 4.79 | 10.3 |
| 550 | Anatase | 60.79 | 0.15 | 7.25 | 14.9 |
| 650 | Anatase | 33.50 | 0.12 | 9.70 | 20.8 |
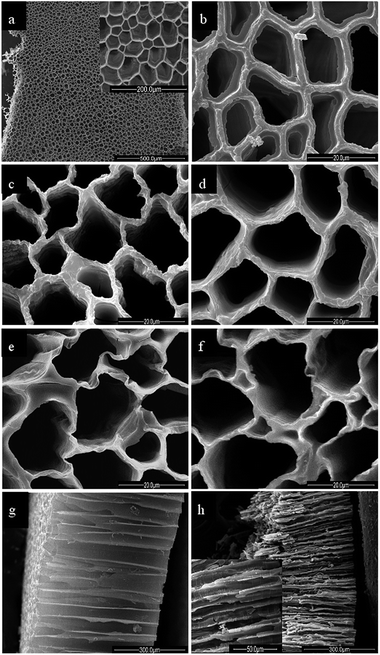
The morphologies of the pearl oyster shell biotemplate and the TiO2 samples were characterized by scanning electron microscopy (SEM) (Fig. 4). Fig. 4a shows the top surface structure of the pearl oyster shell biotemplate. The shell biotemplate exhibits relatively homogeneous macroporous network structures and the macropore size calculated from the SEM image with greater magnification (Fig. 4a, inset) is in the range of 40 μm to 60 μm. Fig. 4b shows that the macroporous walls of the shell biotemplate are coated with the TiO2 precursor gel after thermal treatment at 90 °C for 24 h. Fig. 4c–f show the top surface structures of the obtained TiO2 samples after calcination at 350, 450, 550, and 650 °C for 3 h, respectively. The macroporous network structures of all of the TiO2 samples are clearly well-preserved, indicating that the TiO2 samples have high thermal stability. The macropore size measured from the SEM image ranges from 10 μm to 30 μm, and the decrease in pore size can be ascribed to the removal of the organic biotemplate, causing the shrinkage of the macroporous structures during the calcination procedure. Fig. 4g and h show the cross-sectional structures of the pearl oyster shell biotemplate and the TiO2 sample calcined at 450 °C, respectively. The macroporous structures of the TiO2 sample are also well retained after calcination at 450 °C (Fig. 4h, inset). Both the biotemplate and TiO2 sample show long-range order macrostructures with a length of approximately 500 μm. The long-range order macroporous channels are arranged parallel to each other and perpendicular to the top surface of the materials. These open-ended macroporous channels may serve as ideal light-transport routs for introducing photoenergy and molecules into the interior of titania.28,30
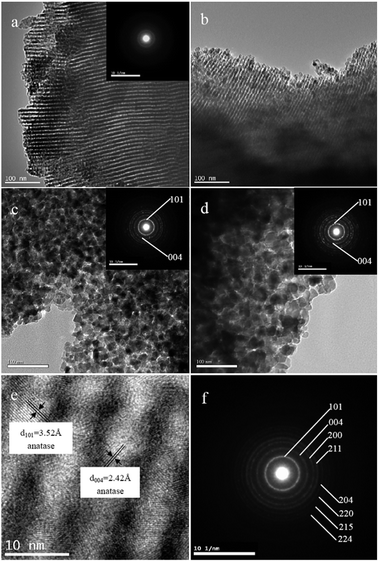
Transmission electron microscopy (TEM) was used to further characterize the microstructures and crystallization of TiO2 samples calcined at different temperatures. As shown in Fig. 5a and b, TEM images of TiO2 samples calcined at 350 and 450 °C clearly show uniform and well-ordered mesopores. However, upon calcination at 550 and 650 °C, the ordered mesoporous structures of the TiO2 samples collapse (Fig. 5c and d). The corresponding selected-area electron diffraction (SAED) pattern of T350 shows several weak diffraction rings (inset Fig. 5a), indicating weak crystallization of the sample. In contrast, distinct diffraction rings are observed and the first few rings are indexed as (101) and (004) in SAED patterns recorded on T550 and T650 (inset Fig. 5c and d), indicating an enhancement in crystallization. Fig. 5e shows a high-resolution TEM image of the TiO2 sample calcined at 450 °C, which confirms the formation of highly ordered mesostructures. The corresponding mesopore size and wall thickness of the sample are estimated to be approximately 4.79 nm and 4.10 nm, respectively. The thick mesoporous walls can help to keep mesoporous structures from collapsing during calcination. The clear lattice fringes of 3.52 and 2.42 Å match well with the crystallographic spacing of the (101) and (004) planes of anatase phase, respectively. This finding demonstrates that the mesoporous walls are composed of TiO2 anatase nanoparticles, as suggested by the Raman and XRD analysis. Further observation shows that some of large TiO2 anatase nanoparticles even thrust into the channels and block the mesopores, indicating the formation of ink-bottle pores. From the SAED pattern recorded on T450 (Fig. 5f), a sequence of diffraction rings can be clearly observed, which is consistent with the polycrystalline anatase structure (JCPDS, no. 21–1272). This finding further confirms that the mesoporous walls are indeed made up of crystalline TiO2 anatase nanoparticles. Thus, well-ordered mesostructures and anatase crystalline frameworks for TiO2 samples can only be obtained when calcined at 450 °C; as the temperature increases from 350 °C to 550 °C or 650 °C, the crystallinity improves while the mesostructures collapse. This finding is in good agreement with a report by Agarwala and Ho.40
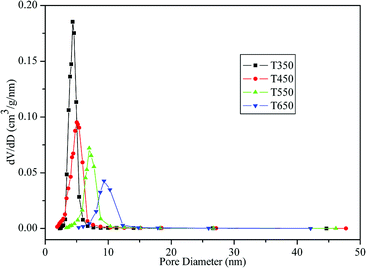
The physicochemical sorption properties and pore parameters of the TiO2 samples were detected by N2 adsorption–desorption measurements. N2 adsorption–desorption isotherms of TiO2 samples calcined at various temperatures are presented in Fig. 6. All of the isotherms are of classical type IV, which can be recognized as the characteristic curve of mesoporous materials according to the IUPAC classification.41 H2-type hysteresis loops with a sloping adsorption branch and a relatively sharp steep desorption branch are observed, suggesting the presence of ink-bottle pores related to the blockage of the mesochannels by the large TiO2 nanocrystals, which is in agreement with the HRTEM observation (Fig. 5e). Fig. 7 shows the corresponding BJH pore-size distribution curves of the TiO2 samples. Samples calcined at 350 °C and 450 °C exhibit narrow pore-size distribution ranges with sharp peaks at 4.41 nm and 4.79 nm, respectively. After calcination at 550 °C and 650 °C, the samples show increases in average pore size to 7.25 nm and 9.70 nm, respectively, with broadened pore size distribution ranges. The effects of calcination temperature on the BET surface area and pore parameters are summarized in Table 1. The sample calcined at 350 °C exhibits a large BET surface area of 175.42 m2 g−1 and a high pore volume of 0.26 cm3 g−1. Upon calcination at 450 °C, the surface area and pore volume decrease to 125.91 m2 g−1 and 0.21 cm3 g−1, respectively. However, as the calcination temperature further increases, the surface area and pore volume drastically decrease. At 550 °C and 650 °C, the surface areas decrease to 60.79 m2 g−1 and 33.50 m2 g−1, respectively, which can be attributed to the collapse of mesostructures and growth of TiO2 nanocrystals.30 This explanation is supported by the TEM images in Fig. 5.
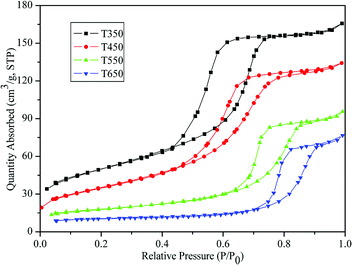 | ||
| Fig. 6 N2 adsorption–desorption isotherms of the TiO2 samples calcined at 350, 450, 550, and 650 °C. | ||
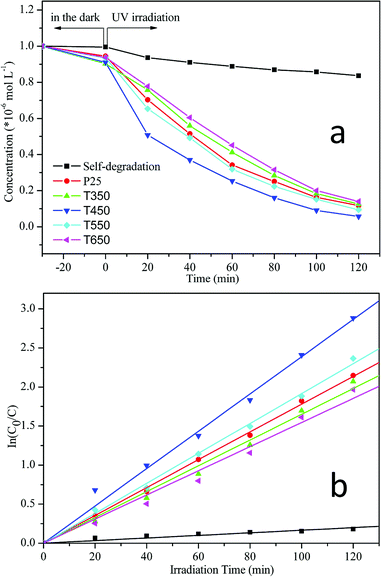
The photocatalytic activities of the TiO2 samples calcined at various temperatures were monitored through the photodegradation of an aqueous RhB solution under UV irradiation and compared with that of the commercial photocatalyst P25 (Fig. 8a). For comparison, a blank experiment (self-photosensitized process) was also evaluated under UV illumination in the absence of any catalyst. As shown in Fig. 8a, the degradation of RhB increases over time. After equilibrium in the dark for 30 min, residual concentrations of an RhB dye solution were compared over different TiO2 photocatalysts. The order of RhB residual concentrations is as follows: CP25 > CT650 > CT550 > CT450 > CT350; most dye molecules (0.996 × 10⁻⁵ M) remain in the solution with the blank experiment. This finding indicates that TiO2 photocatalysts with higher specific surface areas and porous structures can adsorb larger amounts of dye molecules on their surfaces. Under irradiation for 120 min, a slight decrease in RhB concentration (16.4%) occurs in the absence of any catalysts. In contrast, large concentration decreases take place after the addition of TiO2 photocatalysts, including the TiO2 samples and Degussa P25. The photodegradation of RhB can be assumed to follow a pseudo-first-order reaction, and its kinetics may be expressed as follows: ln(C0/C) = kt,33,42–44 where C0 and C are the initial and reaction concentrations of RhB, respectively, and k is the apparent reaction rate constant (min−1). The corresponding plots of ln(C0/C) versus the irradiation time are shown in Fig. 8b and the photodegradation rate constants obtained from the slopes of the simulated straight lines are listed in Table 2. The good linearity between ln(C0/C) and t with correlation coefficient R > 0.99 confirms the pseudo-first-order reaction. The apparent reaction rate constants (k) of the TiO2 samples calcined at 450 °C and 550 °C reach 2.39 × 10⁻² min−1 and 1.92 × 10⁻² min−1, respectively. The k values are larger than that of P25 (k = 1.78 × 10⁻² min−1). However, after calcination at temperatures of 350 °C and 650 °C, the k values decrease to 1.65 × 10⁻² min−1 and 1.55 × 10⁻² min−1, respectively. These results reveal that all of the TiO2 samples and P25 show relatively high photocatalytic activities. TiO2 samples calcined at 450 °C and 550 °C show better photocatalytic activities than P25. Furthermore, the TiO2 sample calcined at 450 °C exhibits the highest photocatalytic activity, which can be attributed to hierarchical macro–mesoporous structures, a high specific surface area, and the anatase phase. On the one hand, macroporous structures can enhance the effective light-activated surface area significantly and allow rapid diffusion of reactants and products, which can improve the photoabsorption efficiency and transport of matter; on the other hand, ordered mesostructures with large surface areas can offer more active adsorption sites and photocatalytic reaction centers.30,33 In addition, the anatase phase of TiO2 has been proven to have the highest photocatalytic activity compared with amorphous, rutile, and brookite TiO2.14,15 The relatively high photocatalytic activity of the TiO2 sample calcined at 550 °C can be due to the enhancement in anatase crystallization, large specific surface area (60.79 m2 g−1), and well-preserved macrostructures. P25 also shows relatively high photocatalytic activity, which can be attributed to the composite structures of anatase and rutile phases,27,30 and specific surface area (47.23 m2 g−1, determined by N2 adsorption–desorption measurements). However, at 350 °C and 650 °C, the photocatalytic activities of TiO2 are comparatively lower than that of P25. The decrease of the photocatalytic activity is due to the weak crystallization of the sample occured at 350 °C and the collapse of the mesostructures at 650 °C, which results in a drastic decrease in specific surface area (33.50 m2 g−1).
| Sample | Calcination temperature (°C) | The apparent reaction rate constants (min−1) | Correlation coefficient R |
|---|---|---|---|
| Self-degradation | — | 1.66 × 10⁻³ | 0.969 |
| P25 | — | 1.78 × 10⁻² | 0.999 |
| T350 | 350 | 1.65 × 10⁻² | 0.997 |
| T450 | 450 | 2.39 × 10⁻² | 0.996 |
| T550 | 550 | 1.92 × 10⁻² | 0.999 |
| T650 | 650 | 1.55 × 10⁻² | 0.994 |
To substantiate the positive effects of macrostructures on photocatalytic activity, the TiO2 sample calcined at 450 °C (T450) was ground into powder, and its physicochemical sorption properties and pore parameters, SEM morphology, and photocatalytic activity were detected. Fig. 9a shows the N2 adsorption–desorption isotherm and the corresponding pore-size distribution curve of T450 after grinding. The isotherm (Fig. 9a, inset) is of classic type IV, and the corresponding pore size (Fig. 9a) is about 4.80 nm. In addition, the corresponding pore volume and the BET surface area are 0.21 cm3 g−1 and 121.13 m2 g−1, respectively. These results demonstrate that the mesoporous structures of T450 can be well-preserved even after grinding. However, SEM image shows that the long-range order macrostructures of T450 are destroyed by grinding (Fig. 9b), and then the apparent reaction rate constants (k) of T450 is reduced by 16.3% because of the disappearing of macrostructures. In the hierarchical macro–mesoporous TiO2 materials, macrostructures not only optimize the transportation of matter and reduce transport limitations, but also act as a light-transfer path for introducing incident photon flux onto the inner surface of mesoporous TiO2, and enhance the photocatalytic activity.28,30,45 For diffusion-limited processes, bimodal pore structures have been studied theoretically and proved to greatly enhance catalytic efficiency.30,46 Meanwhile, the UV light will be more effectively utilized through a multi reflection effect of the macrostructures. The UV light waves reflect in the long-range order macrostructures, inducing a multiple reflection effect and penetrating deep inside the photocatalyst, which significantly increases the effective light-activated surface area and harvests light more efficiently.28,47,48
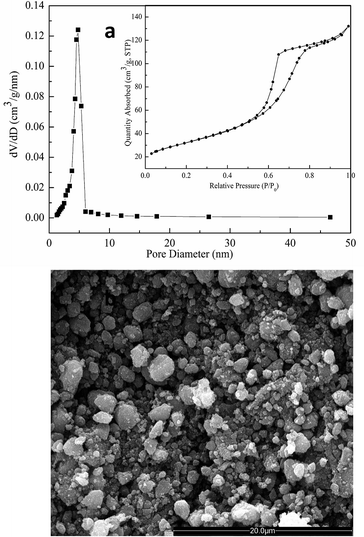 | ||
| Fig. 9 (a) N2 adsorption–desorption isotherm (inset) and the corresponding pore-size distribution curve; (b) SEM image of the calcined TiO2 sample at 450 °C after grinding. | ||
A proposed mechanism for the formation of the hierarchically ordered macro–mesoporous TiO2 can be briefly depicted in Fig. 10. Firstly, the pearl oyster shell template was obtained by removing the calcium carbonate from natural pearl oyster shell in HCl solution, which was served as an ideal biotemplate to fabricate macroporous structures. Then, the macroporous walls of the pearl oyster shell template were coated with TiO2 precursor sol by dip-coating method. During the drying process, the cooperative self-assembly of the TiO2 precursor and P123 occurred with the evaporation of volatile species and the introduction of water molecules from air moisture. After thermal treatment and calcination, the dual templates of pearl oyster shell and P123 were simultaneously removed from the composite materials, and the hierarchically ordered macro–mesoporous structures of TiO2 were finally obtained. Meanwhile, the detailed formation mechanism of mesoporous structures was investigated in our previous work.33
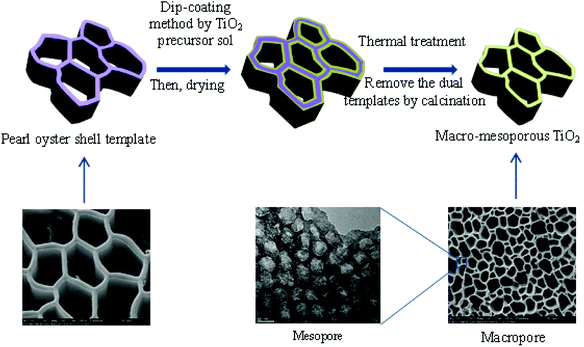 | ||
| Fig. 10 Schematic representation for the formation mechanism of hierarchically ordered macro–mesoporous anatase TiO2. | ||
Conclusions
Hierarchically ordered macro–mesoporous anatase TiO2 was successfully prepared using triblock copolymer P123 and natural pearl oyster shell as dual templates. P123 was employed as a mesopore-directing agent to produce highly ordered mesopores and the inexpensive and environment-friendly pearl oyster shell was used as an ideal biotemplate for the fabrication of macroporous structures. In the sol–gel process, the rapid hydrolysis and condensation rates of titanium alkoxides are controlled by the introduction of hydrochloric acid, nonaqueous media (ethanol), and an acetylacetone chelator. Hierarchically perfect and intact macro–mesoporous structures and the highly crystalline anatase phase were simultaneously obtained through a mild thermal treatment followed by calcination at 450 °C. Compared with the TiO2 samples calcined at different temperatures and P25, the TiO2 sample calcined at 450 °C exhibited the highest photocatalytic activity because of the presence of hierarchical macro–mesoporous structures, high specific surface areas, and the anatase phase.Conflicts of interest
There are no conflicts to declare.Acknowledgements
This research was supported by the Experimental Technology Research Project of Huazhong University of Science and Technology (Grant No. 0134505006), the Research Foundation of Education Bureau of Hunan Province (Grant No. 17C0761) and the Natural Science Foundation of Hunan Province (Grant No. 2018JJ3244). The authors also thank the technical support from the Analytical and Testing Center in the Huazhong University of Science and Technology.Notes and references
- A. Corma, Chem. Rev., 1997, 97, 2373–2419 CrossRef CAS PubMed.
- M. E. Davis, Nature, 2002, 417, 813–821 CrossRef CAS PubMed.
- A. Stein, Adv. Mater., 2003, 15, 763–775 CrossRef CAS.
- X. S. Zhao, J. Mater. Chem., 2006, 16, 623–625 RSC.
- C. T. Kresge, M. E. Leonowicz, W. J. Roth, J. C. Vartuli and J. S. Beck, Nature, 1992, 359, 710–712 CrossRef CAS.
- D. Y. Zhao, J. L. Feng, Q. S. Huo, N. Melosh, G. H. Fredrickson, B. F. Chmelka and G. D. Stucky, Science, 1998, 279, 548–552 CrossRef CAS PubMed.
- P. D. Yang, D. Y. Zhao, D. I. Margolese, B. F. Chmelka and G. D. Stucky, Nature, 1998, 396, 152–155 CrossRef CAS.
- G. J. D. A. A. Soler-IIIia, C. Sanchez, B. Lebeau and J. Patarin, Chem. Rev., 2002, 102, 4093–4138 CrossRef.
- P. K. Nayak and N. Munichandraiah, Microporous Mesoporous Mater., 2011, 143, 206–214 CrossRef CAS.
- X. Chen and S. S. Mao, Chem. Rev., 2007, 107, 2891–2959 CrossRef CAS PubMed.
- T. L. Thompson and J. T. Yates, Chem. Rev., 2006, 106, 4428–4453 CrossRef CAS PubMed.
- A. Hagfeldt, G. Boschloo, L. C. Sun, L. Kloo and H. Pettersson, Chem. Rev., 2010, 110, 6595–6663 CrossRef CAS PubMed.
- T. Zhao, W. Luo, Y. H. Deng, Y. F. Luo, P. C. Xu, Y. Liu, L. J. Wang, Y. Ren and W. Jiang, Nano Energy, 2016, 26, 16–25 CrossRef CAS.
- K. M. Schindler and M. Kunst, J. Phys. Chem., 1990, 94, 8222–8226 CrossRef CAS.
- Y. H. Hsien, C. F. Chang, Y. H. Chen and S. Cheng, Appl. Catal., B, 2001, 31, 241–249 CrossRef CAS.
- T. Y. Peng, D. Zhao, K. Dai, W. Shi and K. Hirao, J. Phys. Chem. B, 2005, 109, 4947–4952 CrossRef CAS PubMed.
- D. S. Kim, S. J. Han and S. Y. Kwak, J. Colloid Interface Sci., 2007, 316, 85–91 CrossRef CAS PubMed.
- E. Beyers, P. Cool and E. F. Vansant, J. Phys. Chem. B, 2005, 109, 10081–10086 CrossRef CAS PubMed.
- L. H. Kao, T. C. Hsu and K. K. Cheng, J. Colloid Interface Sci., 2010, 341, 359–365 CrossRef CAS PubMed.
- D. M. Antonelli and J. Y. Ying, Angew. Chem., Int. Ed. Engl., 1995, 34, 2014–2017 CrossRef CAS.
- G. J. A. A. Soler-Illia, A. Louis and C. Sanchez, Chem. Mater., 2002, 14, 750–759 CrossRef.
- P. D. Yang, D. Y. Zhao, D. I. Margolese, B. F. Chmelka and G. D. Stucky, Chem. Mater., 1999, 11, 2813–2826 CrossRef CAS.
- J. Y. Zheng, J. B. Pang, K. Y. Qiu and Y. Wei, Microporous Mesoporous Mater., 2001, 49, 189–195 CrossRef CAS.
- Z. Y. Yuan and B. L. Su, J. Mater. Chem., 2006, 16, 663–677 RSC.
- P. Innocenzi, L. Malfatti and G. J. A. A. Soler-Illia, Chem. Mater., 2011, 23, 2501–2509 CrossRef CAS.
- T. Zhao, Y. Ren, J. P. Yang, L. J. Wang, W. Jiang, A. A. Elzatahry, A. Alghamdi, Y. H. Deng and D. Y. Zhao, J. Mater. Chem. A, 2016, 4, 16446–16453 RSC.
- X. N. Ren, L. Wu, J. Jin, J. Liu, Z. Y. Hu, Y. Li, T. Hasan, X. Y. Yang, G. V. Tendeloo and B. L. Su, RSC Adv., 2016, 6, 26856–26862 RSC.
- X. C. Wang, J. C. Yu, C. M. Ho, Y. D. Hou and X. Z. Fu, Langmuir, 2005, 21, 2552–2559 CrossRef CAS PubMed.
- Z. Y. Yuan, T. Z. Ren and B. L. Su, Adv. Mater., 2003, 15, 1462–1465 CrossRef CAS.
- J. G. Yu, Y. R. Su and B. Cheng, Adv. Funct. Mater., 2007, 17, 1984–1990 CrossRef CAS.
- Y. N. Fu, Z. G. Jin, W. J. Xue and Z. P. Ge, J. Am. Ceram. Soc., 2008, 91, 2676–2682 CrossRef CAS.
- T. Kimura, N. Miyamoto, X. J. Meng, T. Ohji and K. Kato, Chem.–Asian J., 2009, 4, 1486–1493 CrossRef CAS PubMed.
- J. Q. Zhao, P. Wan, J. Xiang, T. Tong, L. Dong, Z. N. Gao, X. Y. Shen and H. Tong, Microporous Mesoporous Mater., 2011, 138, 200–206 CrossRef CAS.
- J. Du, X. Y. Lai, N. L. Yang, J. Zhai, D. Kisailus, F. B. Su, D. Wang and L. Jiang, ACS Nano, 2011, 5, 590–596 CrossRef CAS PubMed.
- W. F. Liu, A. J. Wang, J. J. Tang, S. L. Chen, G. M. Yuan, K. Zhao, C. X. Li and X. C. Liu, Microporous Mesoporous Mater., 2015, 204, 143–148 CrossRef CAS.
- T. H. Cai, Y. H. Wang, Y. Dong, X. Li, Z. Liu and Z. F. Yan, Mater. Lett., 2013, 111, 173–176 CrossRef CAS.
- B. Li, J. Q. Zhao, J. Liu, X. Y. Shen, S. B. Mo and H. Tong, RSC Adv., 2015, 5, 15572–15578 RSC.
- S. Y. Choi, M. Mamak, N. Coombs, N. Chopra and G. A. Ozin, Adv. Funct. Mater., 2004, 14, 335–344 CrossRef CAS.
- D. S. Kim, S. J. Han and S. Y. Kwak, J. Colloid Interface Sci., 2007, 316, 85–91 CrossRef CAS PubMed.
- S. Agarwala and G. W. Ho, Mater. Lett., 2009, 63, 1624–1627 CrossRef CAS.
- K. S. W. Sing, D. H. Everett, R. A. W. Haul, L. Moscou, R. A. Pierotti, J. Rouquérol and T. Siemieniewska, Pure Appl. Chem., 1985, 57, 603–619 CAS.
- T. Y. Ma, X. J. Zhang and Z. Y. Yuan, Microporous Mesoporous Mater., 2009, 123, 234–242 CrossRef CAS.
- W. W. Zhong, Y. F. Lou, S. F. Jin, W. J. Wang and L. W. Guo, Sci. Rep., 2016, 6, 23235 CrossRef CAS PubMed.
- W. W. Zhong, W. G. Tu, Y. Xu, B. S. Zhan, S. F. Jin and R. Xu, J. Environ. Chem. Eng., 2017, 5, 4206–4211 CrossRef CAS.
- B. Z. Fang, A. Bonakdarpour, K. Reilly, Y. L. Xing, F. Taghipour and D. P. Wilkinson, ACS Appl. Mater. Interfaces, 2014, 6, 15488–15498 CrossRef CAS PubMed.
- T. Doǧu, Ind. Eng. Chem. Res., 1998, 37, 2158–2171 CrossRef.
- T. Y. Zhao, Z. Y. Liu, K. Nakata, S. Nishimoto, T. Murakami, Y. Zhao, L. Jiang and A. Fujishima, J. Mater. Chem., 2010, 20, 5095–5099 RSC.
- B. Z. Fang, Y. L. Xing, A. Bonakdarpour, S. C. Zhang and D. P. Wilkinson, ACS Sustainable Chem. Eng., 2015, 3, 2381–2388 CrossRef CAS.
| This journal is © The Royal Society of Chemistry 2018 |

