DOI:
10.1039/C8RA08324J
(Paper)
RSC Adv., 2018,
8, 38883-38890
Structure and luminescence properties of La6Ba4(SiO4)6F2:Dy3+ phosphor with apatite structure
Received
8th October 2018
, Accepted 24th October 2018
First published on 19th November 2018
Abstract
In this study, we investigated the structure, luminescence properties and morphology of La6Ba4(SiO4)6F2:Dy3+ in detail using X-ray diffraction (XRD), photoluminescence spectroscopy, scanning electron microscopy (SEM) and decay kinetics measurements. The results indicate that La6Ba4(SiO4)6F2:Dy3+ was well crystallized, and its structure is of apatite-type and belongs to the hexagonal system. The prepared samples exhibit two intense characteristic bands in the blue (484 nm) and yellow (579 nm) spectral ranges corresponding to the Dy3+ transitions 4F9/2 → 6H15/2 and 4F9/2 → 6H13/2, respectively. These dominant photoluminescence bands are accompanied by a weak red band (670 nm) due to the 4F9/2 → 6H11/2 transition. The emission color of La6Ba4(SiO4)6F2:Dy3+ phosphors are found to fall in the white light region. The Dy3+ optimal dopant concentration in the La6Ba4(SiO4)6F2 host was found to be 0.12 (mol). In addition, the phosphors have high thermal stability. Hence, La6Ba4(SiO4)6F2:Dy3+ may have an application in white light-emitting diodes.
1. Introduction
In the present time, white light-emitting diodes (w-LEDs) are being widely applied in the field of lighting because of their excellent characteristics, such as good reliability, low power consumption, long lifetime, environmental friendliness and high luminous efficiency.1–3 By combining a yellow emitting phosphor such as YAG:Ce3+ and a blue LED, or by combining several different phosphors, w-LEDs can generally be fabricated.4–7 However, they may have disadvantages associated with complicated phosphors such as efficiency loss. Respectively, the exploration of developing single-phase phosphors is a relevant task. Energy transfer of a single-phase host is an effective way to obtain white light, for example, Sr3Y2(Si3O9)2:Ce3+, Tb3+/Mn2+/Eu2+ phosphors8 and Sr3Gd2(Si3O9)2:Ce3+, Tb3+/Mn2+ phosphors.9 In our study, we tried to use single Dy3+ doped phosphor to obtain white light in a more convenient manner than co-doped ones.
There is an abundance of f-block energy levels in Dy3+ with 4f9 configuration. Strong emission is possible over the visible range,10 consisting of three predominant emission bands in the blue region of 470–500 nm, yellow region of 550–600 nm and red region of 600–700 nm generated by the 4F9/2 → 6H15/2, 4F9/2 → 6H13/2 and 4F9/2 → 6H11/2 transitions, respectively.11–13 Concentration of the Dy3+ ion as well as pump wavelength can have a pronounced impact on the intensity ratio of the yellow-blue emission (Y/B). This is due to the fact that the hypersensitive 4F9/2 → 6H13/2 transition has a strong intensity dependent on the host, whereas the 4F9/2 → 6H15/2 transition is less sensitive.14 Thanks to this feasibility, the emission near white light is possible by adjusting the Y/B value.15 Single-phased white-light-emitting phosphors doped by Dy3+ ions have been widely investigated, for instance, Ca9La(PO4)5(SiO4)F2:Dy3+,16 K2Gd(PO4)(WO4):Dy3+,17 Na3Sc2(PO4)3:Dy3+,18 Sr3Y(PO4)3:Dy3+ (ref. 19) and Ca3Si2O7:Dy3+.20
Compounds with apatite structure are considered as practical host materials because they have exceptional thermal and chemical stability.21,22 Apatite-type compounds crystallize in the space group of P63/m (Z = 2) and have a general chemical composition of A10[XO4]6Z2,23 where A stands for divalent cations such as Ca2+, Mg2+, Ba2+ and Sr2+; XO4 represents a tetrahedron group in which X can be P, Si, Ge, V; Z can be anions such as OH−, Cl−, O2−, F−.24–26 By isomorphic substitution, the A site can be occupied by rare earth ions like Y3+, La3+, Gd3+ or alkali metal ions like Li+, Na+, K+.27–29 Accordingly, we can skillfully design novel Dy3+-doped phosphors with more accomplished light output for solid state lighting applications.
Being a likely host for the generation of tunable solid-state lasers and ultra-short pulses, the apatite-type La6Ba4(SiO4)6F2 (abbreviated here as LBSF) compound was considered carefully.30 There are two cationic sites in this compound, i.e., C3 point symmetry in 9-fold coordinated 4f sites and Cs point symmetry in 7-fold coordinated 6h sites.31 Besides, numerous species of rare earth ions can be accepted in both sites.32 In our previous studies, we have obtained emission-tunable (from blue to green) phosphor La6Ba4(SiO4)6F2:Ce3+, Tb3+ (ref. 33) and reddish-orange phosphor La6Ba4(SiO4)6F2:Sm3+,31 which further indicates that LBSF is an excellent host material for single-phased white light-emitting phosphors. However, LBSF:Dy3+ phosphors have not yet been reported. Hence, in this contribution, the systematic study of the synthesis, structure and luminescence properties of LBSF:Dy3+ phosphors are reported. We show that, having feasible application, La6Ba4(SiO4)6F2:Dy3+ phosphors may act as a white-light-emitting phosphor for w-LEDs (white light-emitting diodes).
2. Experimental details
2.1. Synthesis
La6−xBa4(SiO4)6F2:xDy3+ (x = 0.03, 0.09, 0.12, 0.15, 0.18 and 0.30) compounds were synthesized using a high-temperature solid-state reaction method. La2O3 (Aldrich, 99.995%), BaCO3 (Aldrich, 99.9%), SiO2 (Aldrich, 99.9%), NH4HF2 (Aldrich, 99.9%) and Dy2O3 (Aldrich, 99.995%) were used as starting materials. The reagents were mixed and then ground, based on the calculated stoichiometric ratio. NH4HF2 was used with 50% stoichiometric excess to compensate for fluorine loss at high temperatures. The mixtures were well ground in an agate mortar, inserted into the alumina crucibles and pre-heated at 750 °C for 1 h in the air atmosphere. Afterwards, the precursors were ground and annealed at 1350 °C for 4 h in the air atmosphere. As-synthesized samples were cooled to room temperature (RT) and ground to powders for structural and optical characterizations.
2.2. Characterization
The structural properties of synthesized samples were carried out by X-ray powder diffraction using an XD-3, PGENERAL, China, with Cu Kα radiation (λ = 0.15406 nm), in the 2θ range from 10° to 70°, operating at 40 kV and 40 mA. Using a GeminiSEM 500 instrument for morphological characterization, the La6Ba4(SiO4)6F2:xDy3+ (x = 0.12 mol) sample was examined by SEM. The photoluminescence (PL) and excitation (PLE) spectra of the samples were recorded with an F-4600 fluorescence spectrophotometer (HITACHI, Japan) equipped with a photomultiplier tube operating at 500 V and a 150 W Xe lamp as the excitation source. Decay kinetics measurements were performed at RT using a Spectrofluorometer (Horiba, Jobin Yvon TBXPS) with a tunable pulse laser radiation as an excitation source.
3. Results and discussion
3.1. Structure
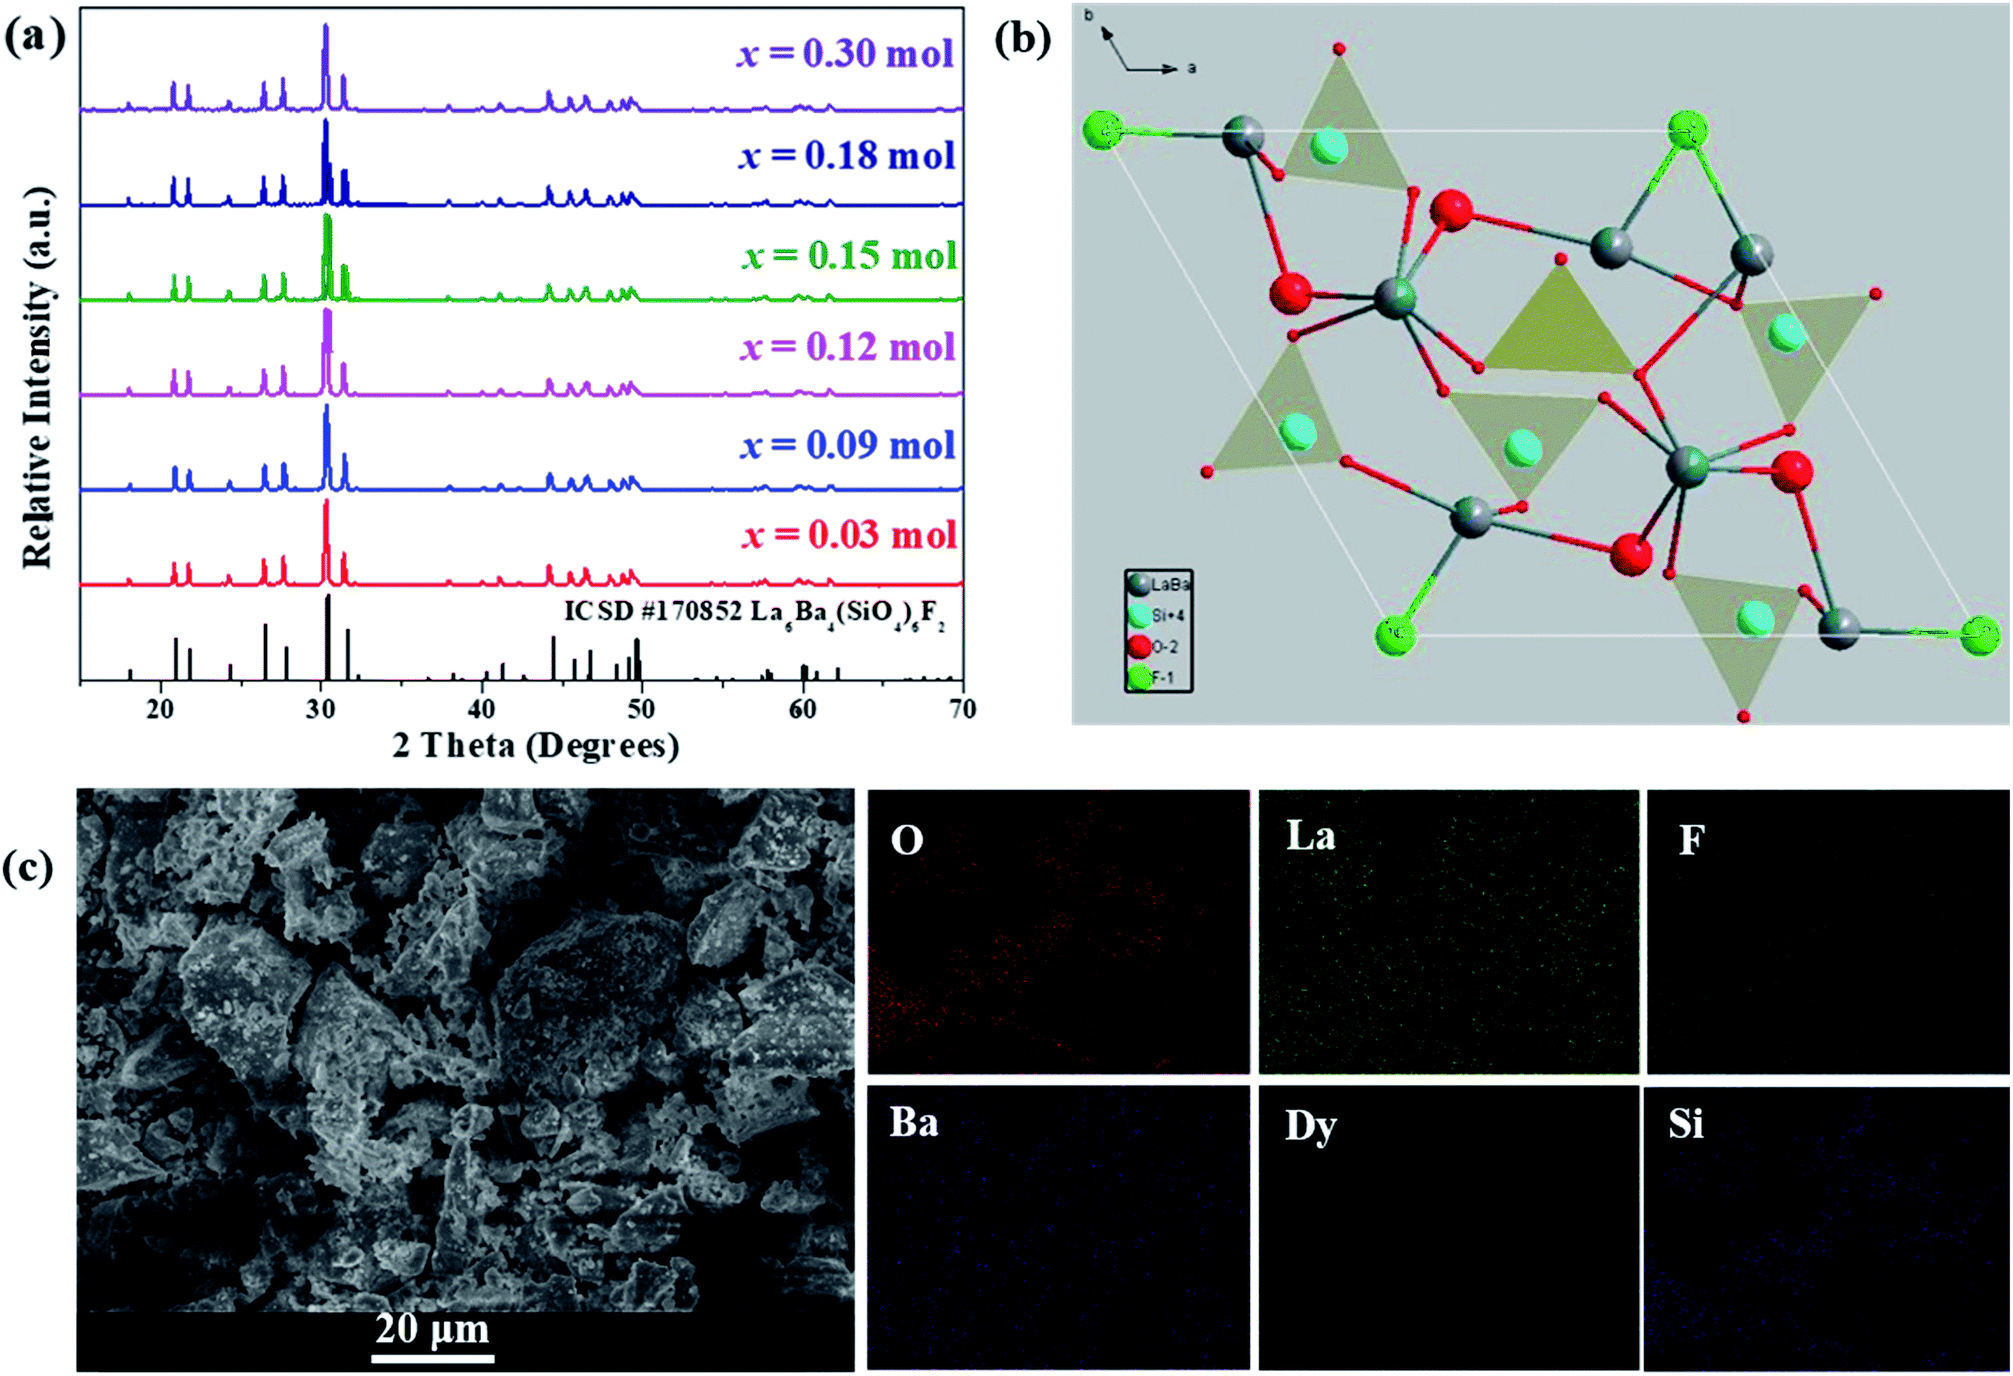
The crystal structure and phase purity of the as-prepared phosphors were analyzed by XRD. In Fig. 1(a), XRD patterns of La6−xBa4(SiO4)6F2:xDy3+ (x = 0.03, 0.09, 0.12, 0.15, 0.18 and 0.30) phosphors are shown. The relative intensity and position of all diffraction peaks can be exactly matched with those of the La6Ba4(SiO4)6F2 (ICSD no. 170852) standard,34 revealing the formation of hexagonal La6Ba4(SiO4)6F2-type compounds and showing that the small doped Dy3+ contents has not affected the pure phase composition. No other crystalline phases were detected. The view of La6Ba4(SiO4)6F2 crystal structure along [001] axis is illustrated in Fig. 1(b). As shown, there are two nonequivalent cation sites, the seven-coordinated 6h (Cs) site [La3+/Ba2+(II)] and the nine-coordinated 4f (C3) site [La3+/Ba2+(I)], which are connected by isolated [SiO4]4− tetrahedrons. The [SiO4]4− tetrahedrons, La/Ba(I) polyhedrons and La/Ba(II) polyhedrons form the framework structure of the La6Ba4(SiO4)6F2 host.
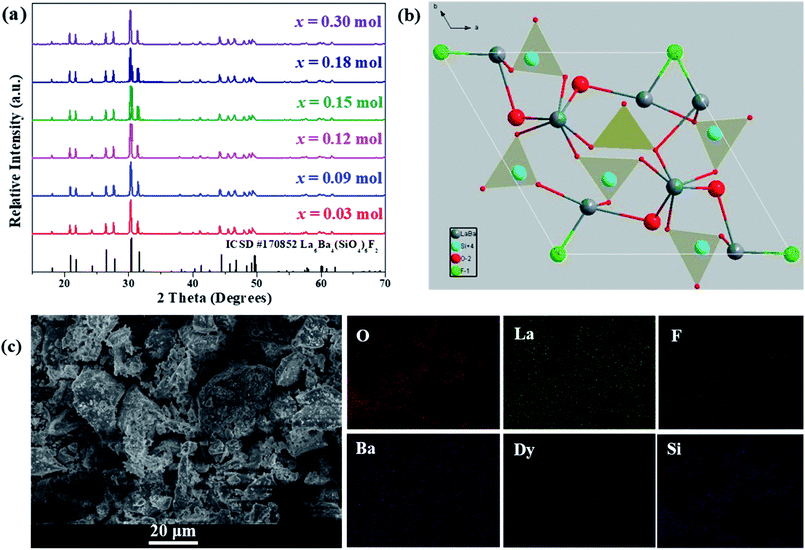 |
| | Fig. 1 (a) XRD patterns of LBSF:xDy3+ (x = 0.30, 0.18, 0.15, 0.12, 0.09 and 0.03) samples, (b) crystal structure of the host LBSF compound viewed along the c axis, (c) the SEM micrograph of LBSF:0.12Dy3+ phosphor and the elemental mapping of LBSF:Dy3+ phosphors. | |
The SEM micrograph of the LBSF:0.12Dy3+ phosphor is shown in Fig. 1(c). The typical microstructure of the sample shows the inherent characteristic results from the solid-state reaction method. The particles are irregular in shape, and the synthesized and ground phosphor has a wide particle size distribution range from 1 to 10 μm. In Fig. 1(c), the elemental mapping of LBSF: 0.12Dy3+ phosphor is shown. In the final product, the constituent elements La, Ba, Si, O, F and Dy are uniformly distributed over the whole observed area. Based on these results, the phosphor mostly can meet the fabrication requirements for w-LEDs. Furthermore, it is noticed that the particles are closely packed, which helps to prevent light scattering. Therefore, more efficient light output can be obtained.35 In addition, by using EDS for LBSF phosphor, we accomplished elemental analysis and have identified the elements, i.e., Ba, La, Si, O, F in the proportions as seen in the EDS spectrum, respectively. The elemental composition of the sample is shown in Table 1.
Table 1 The elemental composition of the host La6Ba4(SiO4)6F2 sample determined by EDS analysis
| Element |
Weight% |
Atomic% |
| O |
19.86 |
58.72 |
| F |
2.24 |
5.60 |
| Si |
6.71 |
11.33 |
| Ba |
28.17 |
9.70 |
| La |
43.01 |
14.65 |
| Totals |
100.00 |
3.2. Luminescence properties of LBSF:Dy3+
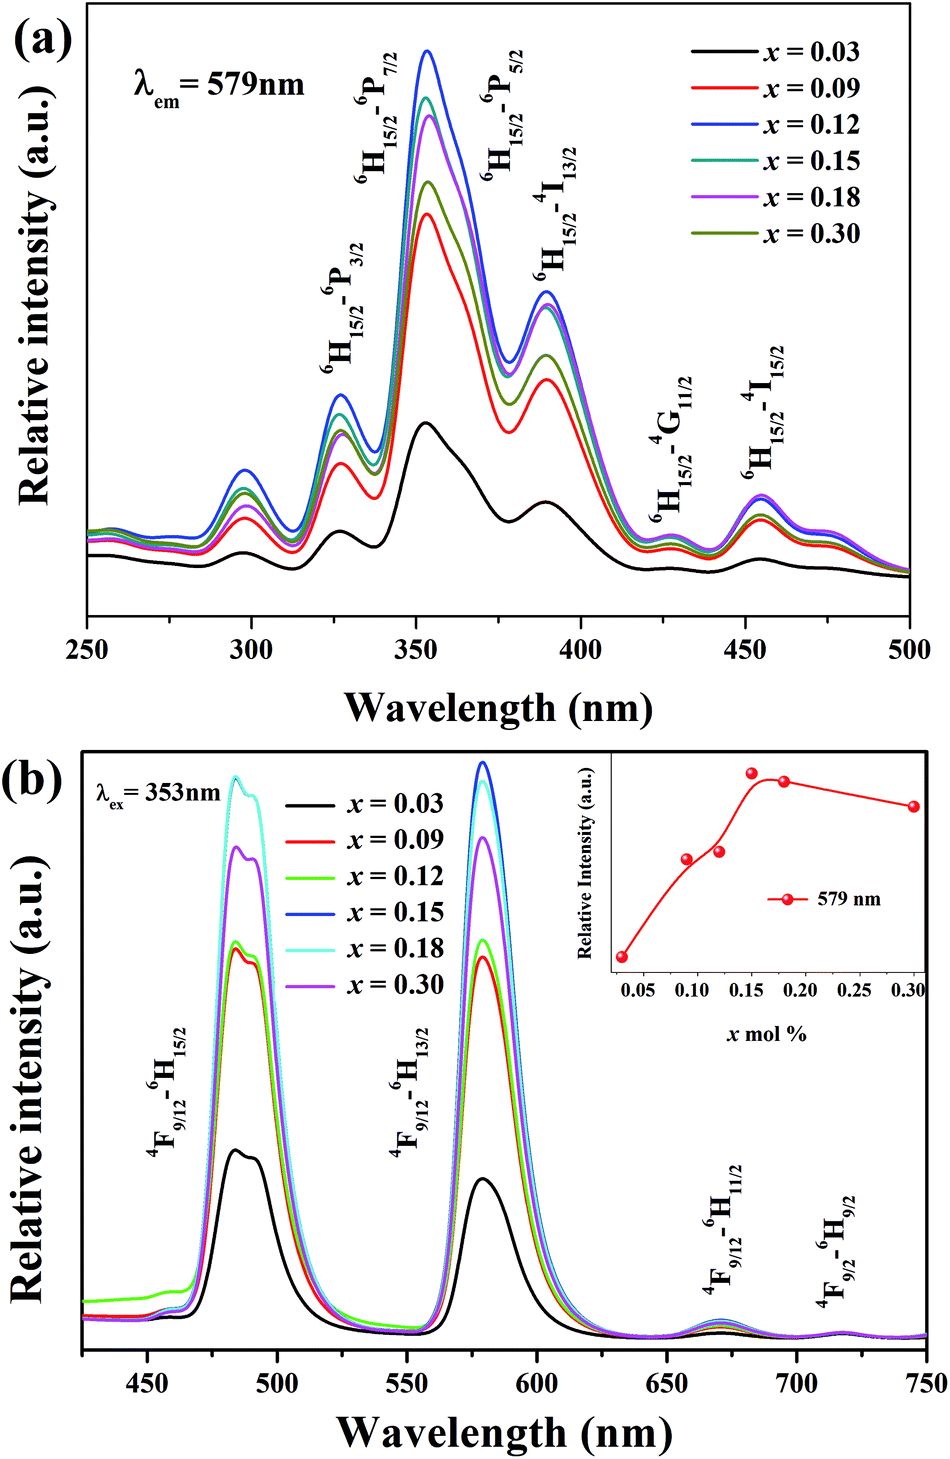
At different Dy3+ concentrations, we tested the luminescence properties of LBSF samples at RT. In Fig. 2(a) and (b), the emission (λem = 579 nm) and excitation spectra (λex = 353 nm) are displayed, respectively. The excitation spectrum shown in Fig. 2(b) exhibited four intense bands centered at the wavelengths of 300, 327, 353 and 389 nm, corresponding to the transitions 6H15/2 → 6P3/2, 6H15/2 → 6P7/2, 6H15/2 → 6P5/2 and 6H15/2 → 4I13/2 (389 nm), one moderate band at 454 nm and one weak band at 427 nm, due to 6H15/2 → 4I15/2 and 6H15/2 → 4G11/2 transitions, respectively. The PLE peaks for Dy3+ doped La6Ba4(SiO4)6F2 phosphor offer a great opportunity for WLED devices with excitation using blue InGaN/GaN LED chips.36 In Fig. 2(b), at 353 nm excitation, when the Dy3+ concentration increases from 0.03 to 0.30 mol, the emission intensity initially increases and then decreases due to the concentration quenching (CQ) phenomena. In LBSF doped with Dy3+ ions, the optimal doping concentration was 0.12 mol.37 Because of partial crystal field degeneracy around the Dy3+ ions, the blue emission bands are split into two components. Due to the Stark effect enhancement and increase in Dy3+ concentration, the crystal-field splitting increases. The main emission band at 579 nm corresponds to the 4F9/2 → 6H13/2 transition known as the electric dipole transition or hypersensitive transition, and the one at 484 nm originates due to the 4F9/2 → 6H15/2 transition known as the magnetic dipole transition, which usually shows lower intensity than the electric dipole transition.38–40 The variation of the Y/B, yellow-to-blue luminescence, intensity ratio is applicable to white light emission with Dy3+ ions tuning the yellow and blue components. In Table 2, the Y/B values for LBSF with different dysprosium concentrations are listed. As seen, the Y/B ratios are practically insensitive to the concentration of Dy3+ ions. Evidently, larger Y/B values are observed for higher concentration of dysprosium. Based on this trend, we validate that the Y/B ratio increases at low concentrations of Dy3+ ions in the La6Ba4(SiO4)6F2 system. The maximum value of Y/B is 1.03 for LBSF:0.15Dy3+, showing a good agreement with the concentration dependence of PL, as shown in Fig. 2(b). It can be assumed that the small changes in the Y/B ratios are caused by structural changes near the Dy3+ ions.41–44 The results show that the Dy3+ ions occupy lower symmetry sites in the LBSF structure, as indicated by the XRD results.
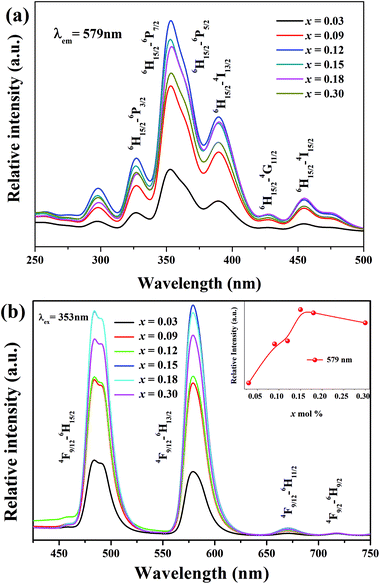 |
| | Fig. 2 (a) The PL excitation (PLE) spectra (λem = 579 nm) of LBSF:xDy3+, (b) the PL emission spectra (λex = 353 nm) of LBSF:xDy3+, and the inset in (b) shows the variable 579 nm peak intensity with increasing dopant concentration. | |
Table 2 The (Y/B) intensity ratios of luminescence spectra evaluated and the calculated chromaticity coordinates for the white light emitted from LBSF:xDy3+ phosphor (x = 0.03, 0.09, 0.12, 0.15, 0.18, 0.3)
| Sample no. |
C |
484 |
579 |
Y/B ratio |
(x, y) |
| 1 |
0.03 |
901.3 |
764.8 |
0.85 |
(0.3032, 0.3371) |
| 2 |
0.09 |
1860 |
1821 |
0.98 |
(0.3298, 0.3646) |
| 3 |
0.12 |
1895 |
1902 |
1.00 |
(0.3206, 0.3496) |
| 4 |
0.15 |
2675 |
2749 |
1.03 |
(0.3422, 0.3780) |
| 5 |
0.18 |
2681 |
2659 |
0.99 |
(0.3391, 0.3765) |
| 6 |
0.30 |
2345 |
2390 |
1.02 |
(0.3403, 0.3768) |
3.3. Decay characteristics
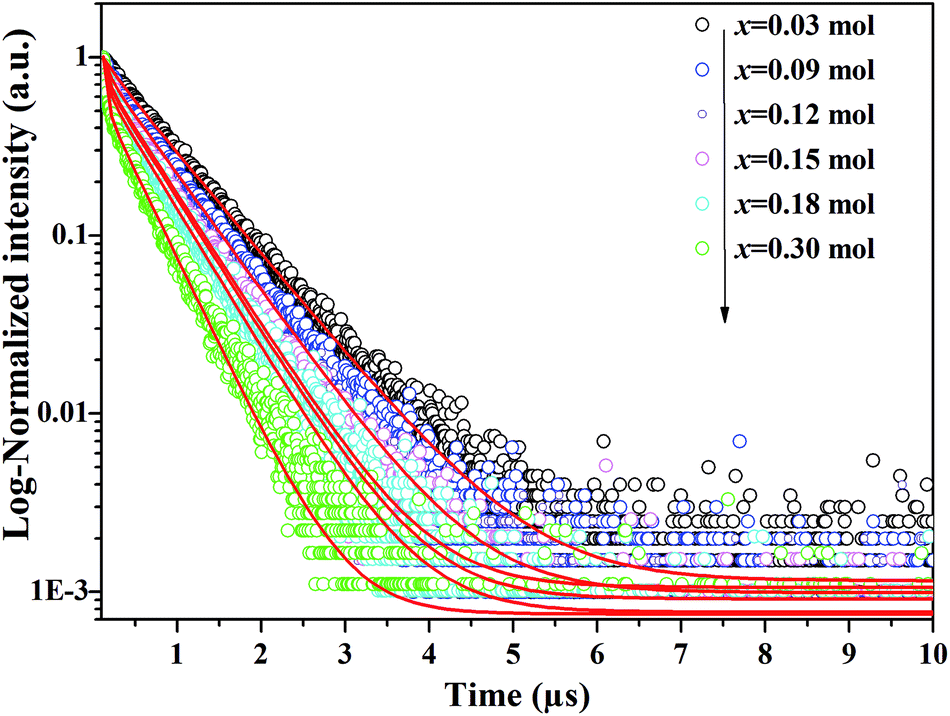
In Fig. 3, the fluorescence decay curves of the Dy3+ emission are shown for the LBSF:Dy3+ phosphors, as excited at 350 nm and monitored at 573 nm. The decay curves can be properly fitted by a second order exponential equation:45| |
 | (1) |
in which I stands for the phosphorescent intensity. I1, I2 are intensity constants, τ represents the time, and τ1, τ2 are the fast and slow lifetimes for exponential components. The determined lifetime values and fitting parameters are given in Table 3. The 4F9/2 luminescence lifetime depends on the concentration of Dy3+ ions. With the enhancement of Dy3+ dopant concentration, the typical values of lifetime shorten from about 0.76 to 0.4 ms, as expected. We find that the effective lifetimes decrease with increasing Dy3+ concentration, and energy transfer to Dy3+ ions through cross-relaxation processes and energy transfer between luminescence quenching centers and impurities are the probable reasons.44,46
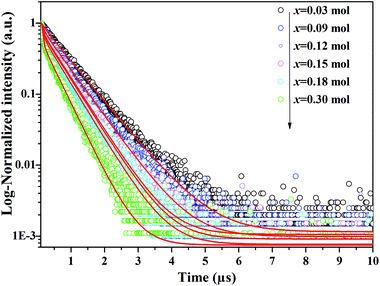 |
| | Fig. 3 Decay curves of Dy3+ emission for LBSF:xDy3+ phosphors under excitation 353 nm, monitored at 579 nm. | |
Table 3 Determined luminescence lifetimes and fitting parameters for the LBSF:xDy3+ samples
| Sample no. |
C (mol) |
τ1 (ms) |
A1 (%) |
τ2 (ms) |
A2 (%) |
τaverage (ms) |
R2 |
| 1 |
0.03 |
0.7644 |
94.38% |
0.1976 |
5.62% |
0.76 |
0.9983 |
| 2 |
0.09 |
0.0740 |
10.95% |
0.6620 |
89.05% |
0.65 |
0.9982 |
| 3 |
0.12 |
0.5864 |
80.44% |
0.0498 |
19.56% |
0.58 |
0.9980 |
| 4 |
0.15 |
0.5767 |
75.88% |
0.0585 |
24.12% |
0.56 |
0.9977 |
| 5 |
0.18 |
0.0443 |
31.98% |
0.5559 |
68.02% |
0.54 |
0.9976 |
| 6 |
0.30 |
0.4400 |
42.03% |
0.0343 |
57.97% |
0.40 |
0.9967 |
3.4. Energy transfer process
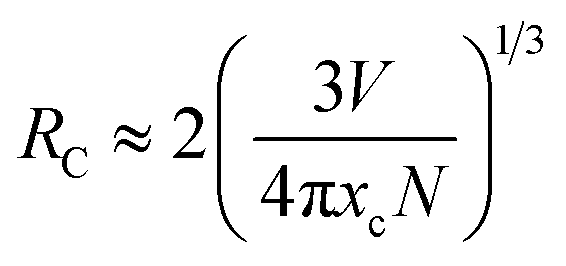
Generally, with increasing Dy3+ concentration, the relative distance between the Dy3+ luminescent centers decreases. This promotes nonradiative energy transfer between adjacent Dy3+ ions, leading to concentration quenching at high dopant concentrations. In the energy transfer process, there could be quenching sites where the excitation energy dissipates, resulting in luminescence quenching. To check the concentration quenching mechanism, it is necessary to determine the critical distance (RC) between the Dy3+ ions. RC can be evaluated on the basis of the Blasse equation:47,48| |
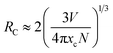 | (2) |
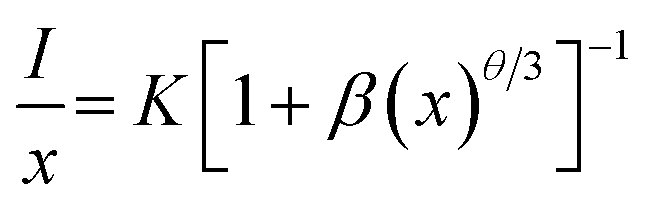
in which V is the volume belonging to the unit cell, xc is the critical concentration of Dy3+, N represents the formula units per unit cell. Taking appropriate values of V, xc, and N (10, 608.77 Å3, 0.12, respectively) for LBSF:0.12Dy3+ phosphor, RC is estimated to be about 9.89 Å. Consequently, it is deduced that the exchange interaction contribution to concentration quenching effect is inefficient in the LBSF system since exchange interaction occurs when RC is smaller than 5 Å.49 Therefore, in the case of Dy3+, the concentration quenching mechanism was dominated by the multipolar–multipolar interaction. This model of energy transfer between similar activators, as well as the relation between Dy3+ concentration and the luminescence intensity is pointed out on the basis of Dexter theory. As given by the equation below, there is a relation between activator concentration (x) and luminescence intensity (I):50,51| |
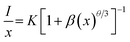 | (3) |
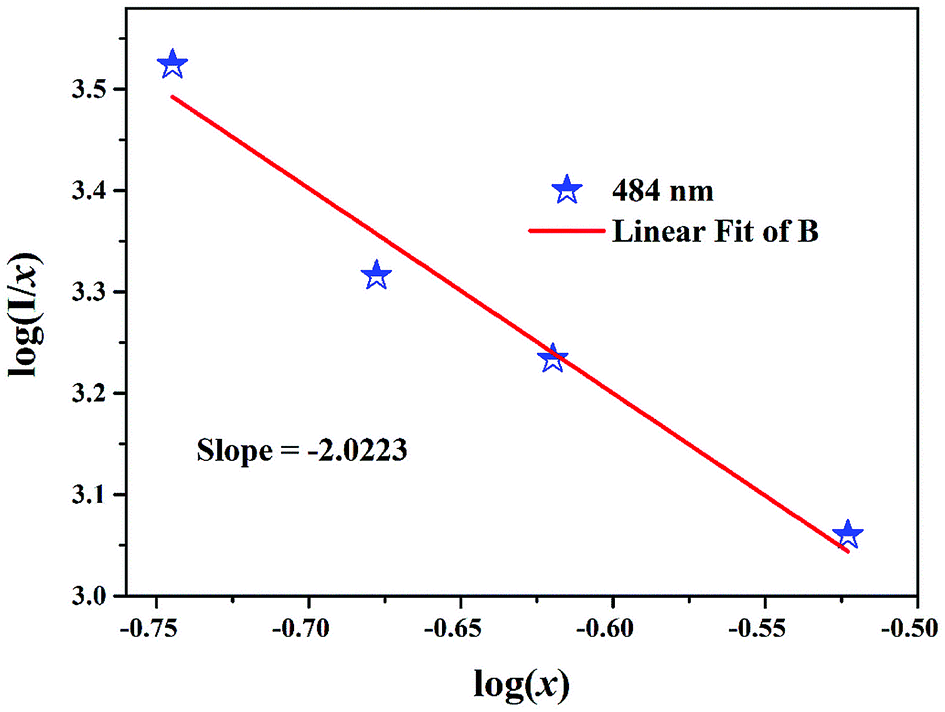
where x is the activator concentration, θ is a multipolar interaction constant equal to 3, 6, 8 or 10 corresponding to the nearest-neighbor ions, which means dipole–dipole (d–d), dipole–quadrupole (d–q), and quadrupole–quadrupole (q–q) interactions, respectively,52 and K and β are constants for each interaction at the same excitation. Exceeding the quenching concentration, we chose the LBSF:0.15, 0.18, 0.27, 0.3Dy3+ samples for consistent emission intensity measurements at 484 nm. As seen in Fig. 4, by the log(I/x) − log(x) plot, the value of θ is determined to be 6.07 for the peak at 484 nm. Thus, for concentration quenching in the system under consideration, the dipole–dipole (d–d) interaction is dominant.
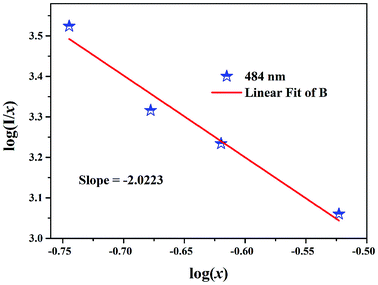 |
| | Fig. 4 Relationship between the log(I/x) and log(x) of Dy3+ content in LBSF:xDy3+ phosphors beyond the quenching concentration (x = 0.15, 0.18, 0.27, 0.3). | |
3.5. CIE chromaticity coordinate
As one of the important factors, the CIE, Commission International de I'Eclairage53 1931, is widely used to ascertain the chromaticity coordinates and evaluate the phosphor performance. The chromaticity coordinates of LBSF:Dy3+ phosphors with different dopant concentrations under UV excitation at 353 nm are listed in Table 2. The LBSF:Dy3+ samples on the CIE chromaticity diagram are shown in Fig. 5. As evident, all LBSF:Dy3+ samples are in the white region. Moreover, the point of LBSF:0.12Dy3+ phosphor, (x = 0.3206, y = 0.3496), is very close to standard white light (x = 0.334, y = 0.337).54 Hence, the present results imply that the LBSF:0.12Dy3+ phosphor could have a likely application for white light-emitting diodes.
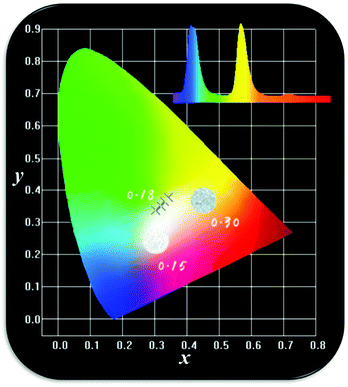 |
| | Fig. 5 The CIE chromaticity coordinates (x, y) LBSF:xDy3+ samples, and the corresponding images of samples luminescence under UV light irradiation. | |
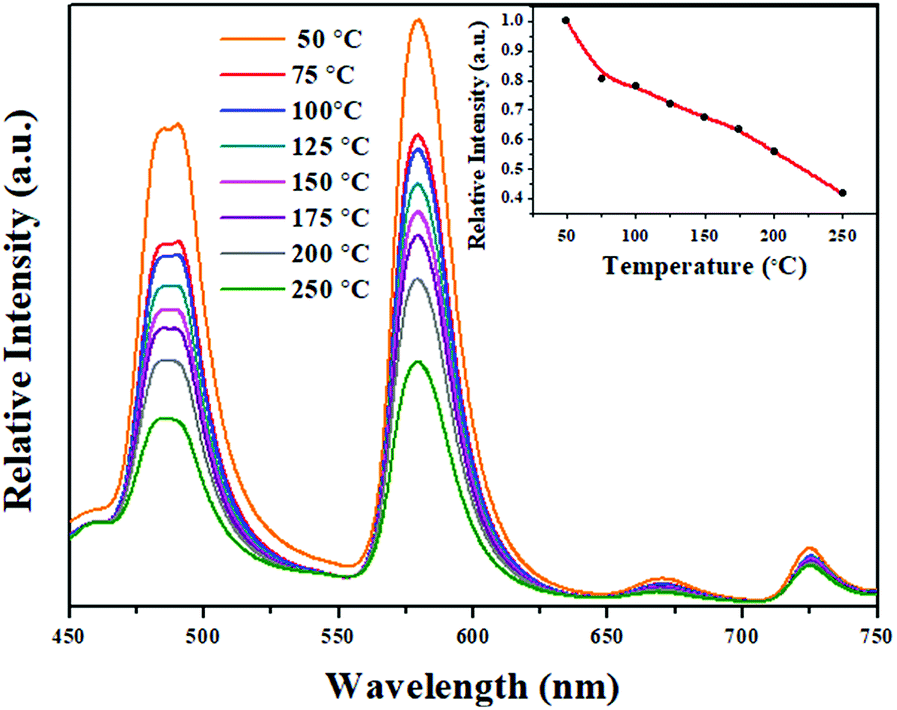
3.6. Temperature-dependent luminescence properties
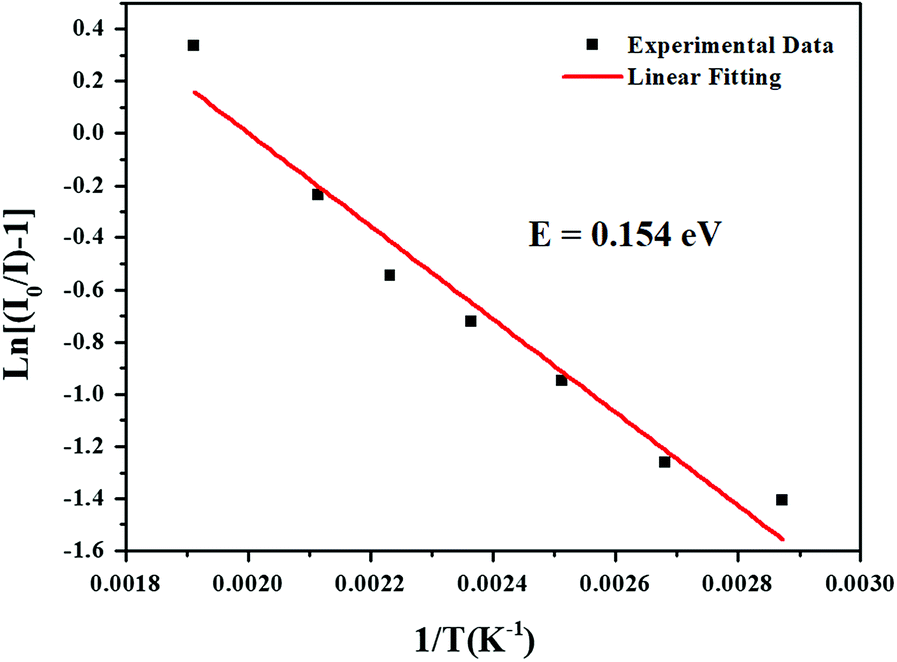
For long-term operation, w-LED chip temperatures could increase up to 150 °C, so, the thermal stability of the phosphors is one of the most vital issues for their applications in high-powered LEDs.55 In Fig. 6, the temperature-dependent emission spectra of the LBSF:0.12Dy3+ phosphor excited at 353 nm is shown for the temperature range from RT to 250 °C. The PL relative intensity decreases gradually with increasing temperature and it remains above 60% at 150 °C, reflecting that the prepared phosphor has high thermal stability. A plot of the luminescence intensity vs. temperature is shown in the inset of Fig. 6. Currently, during the LED operation, due to the heat generated by the LED itself, the temperature is up to 150 °C for a long time and the phosphors should maintain their emission efficiency. It is observed that in LBSF:0.12Dy3+ phosphor the Dy3+ luminescence intensity related to the 4F9/2 to 6H15/2 and 4F9/2 to 6H13/2 transitions reaches 62.03% and 67.28%, respectively, when the temperature is elevated up to 150 °C, as compared to the room temperature parameters. Because of non-radiative relaxation through the excited state and its crossover to the ground state, the thermal quenching effect, where the probability of non-radiative transition strictly relies on the temperature causes PL quenching of Dy3+ emission at high temperatures. The relationship between the temperature and photoluminescence intensity could be described with a modified Arrhenius equation:56–58| |
 | (4) |
where I(T) is the intensity at temperature T, I0 is the initial intensity, c is a constant, E is the activation energy between the bottom of the excited state 4F9/2 and its crossover point to the ground state 6H13/2 and k is the Boltzmann constant. For the present LBSF:0.12Dy3+ phosphor, Fig. 7 gives evidence of the emission thermal quenching model fitting line plotted as ln(I0/I) − 1 against 1/kT. As revealed by the fitting with eqn (4), the activation energy value E is equal to 0.154 eV for the 4F9/2 to 6H13/2 transition of Dy3+ ions. Therefore, the obtained LBSF:0.12Dy3+ phosphor shows good thermal stability, which offers an excellent possibility for application in w-LEDs. The chromaticity coordinates of LBSF:0.12Dy3+ phosphors at different temperatures ranging from RT to 250 °C under 353 nm excitation are shown in Table 4. As shown in Table 4, the chromaticity coordinates of LBSF:0.12Dy3+ phosphors at different temperature ranging from RT to 250 °C under 353 nm excitation are stable, and are all located in white region.
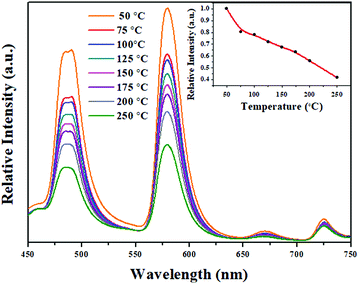 |
| | Fig. 6 Emission spectra of LBSF:0.12Dy3+ under 353 nm excitation at different temperatures, and the inset shows the PL intensity as a function of temperature. | |
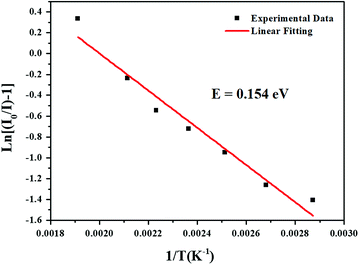 |
| | Fig. 7 The fitting line of the emission thermal quenching model plotted as ln(I0/I) − 1 against 1/kT for the present LBSF:0.12Dy3+ phosphor. | |
Table 4 The chromaticity coordinates of LBSF:0.12Dy3+ phosphor at different temperatures ranging from RT to 250 °C under 353 nm excitation
| Sample no. |
Temperature (°C) |
(x, y) |
| 1 |
RT |
(0.3285, 0.3538) |
| 2 |
75 |
(0.3296, 0.3473) |
| 3 |
100 |
(0.3290, 0.3461) |
| 4 |
125 |
(0.3277, 0.3437) |
| 5 |
150 |
(0.3261, 0.3412) |
| 6 |
175 |
(0.3241, 0.3397) |
| 7 |
200 |
(0.3182, 0.3320) |
| 8 |
250 |
(0.3043, 0.3161) |
4. Conclusion
In conclusion, by using the traditional solid-state reaction method, the new feasible single-phased white light-emitting La6−xBa4(SiO4)6F2:Dy3+ phosphors were synthesized favorably. Subsequently, we reported on the systematic study of the crystal structure, morphology and luminescence performance of prepared samples. The XRD patterns confirmed their phase purity, and that the compounds belong to the apatite family. SEM measurement demonstrated a closely packed particle morphology. Under UV excitation, two intense characteristic bands i.e. blue bands at 484 nm, yellow bands at 579 nm, corresponding to transitions of Dy3+, 4F9/2 → 6H15/2 and 4F9/2 → 6H13/2, respectively, dominate the photoluminescence spectra accompanied by a weak red band at 670 nm, contributing to 4F9/2 → 6H11/2. The concentration quenching mechanism of the Dy3+ ions is controlled by a dipole–dipole interaction, and the optimal dopant concentration of Dy3+ in the La6−xBa4(SiO4)6F2 host was determined to be 0.12 (mol). The critical transfer distance between the Dy3+ ions is calculated to be 9.89 Å. In the CIE diagram, the emission color of La6Ba4(SiO4)6F2:Dy3+ phosphors falls in the white light zone. Furthermore, thermal quenching measurements indicate excellent thermal stability. Combining all the results, we can indicate that La6Ba4(SiO4)6F2:Dy3+ may serve as white light-emitting phosphors for white-light-emitting diodes (w-LEDs).
Conflicts of interest
There are no conflicts to declare.
Acknowledgements
The study was supported by the National Natural Science Foundations of China 277 (Grant No. 51672257) and the Fundamental Research Funds for the Central Universities (Grant No. 2652017094 and 2652017091). Jialei Zhang also express thanks to the supporting from the College Student Research Innovation Program of China University of Geosciences, Beijing.
References
- X. X. Ma, L. B. Liao, Q. F. Guo, H. K. Liu, T. S. Zhou and L. F. Mei, RSC Adv., 2018, 8, 27332–27341 RSC.
- Q. F. Guo, Q. D. Wang, L. W. Jiang, L. B. Liao LB, H. K. Liu and M. F. Mei, Phys. Chem. Chem. Phys., 2016, 118, 15545–15554 RSC.
- M. F. Zhang, Y. J. Liang, S. Y. Xu, Y. L. Zhu, X. Y. Wu and S. Q. Liu, RSC Adv., 2016, 18, 68–76 CAS.
- X. C. Wang and Y. H. Wang, J. Phys. Chem. C, 2015, 119(28), 16208–16214 CrossRef CAS.
- V. V. Atuchin, N. F. Beisel, E. N. Galashov, E. M. Mandrik, M. S. Molokeev, A. P. Yelisseyev, A. A. Yusuf and Z. G. Xia, ACS Appl. Mater. Interfaces, 2015, 7, 26235–26243 CrossRef CAS PubMed.
- H. P. Ji, L. Wang, M. S. Molokeev, N. Hirosaki, R. J. Xie, Z. H. Huang, Z. G. Xia, O. M. T. Kate, L. H. Liu and V. V. Atuchin, J. Mater. Chem. C, 2016, 4, 6855–6863 RSC.
- E. N. Galashov, V. V. Atuchin, T. A. Gavrilova, I. V. Korolkov, Y. M. Mandrik, A. P. Yelisseyev and Z. G. Xia, J. Mater. Sci., 2017, 52(22), 13033–13039 CrossRef CAS.
- M. F. Zhang, Y. J. Liang, R. Tang, D. Y. Yu, M. H. Tong, Q. Wang, Y. L. Zhu, X. Y. Wu and G. G. Li, RSC Adv., 2014, 4, 40626–40637 RSC.
- Y. L. Zhu, Y. J. Liang, M. F. Zhang, M. H. Tong, G. G. Li and S. Wang, RSC Adv., 2015, 5, 98350–98360 RSC.
- H. Choi, C. H. Pyun and S.-J. Kim, J. Lumin., 1999, 82, 25–32 CrossRef CAS.
- H. K. Liu, L. B. Liao, Q. F. Guo, D. Yang and L. F. Mei, J. Lumin., 2017, 181, 407–410 CrossRef CAS.
- Q. Su, H. Liang, C. Li, H. He, Y. Lu, J. Li and Y. Tao, J. Lumin., 2007, 122–123, 927–930 CrossRef CAS.
- B. Han, H. Liang, H. Lin, W. Chen, Q. Su, G. Yang and G. Zhang, J. Opt. Soc. Am. B, 2008, 25, 2057–2063 CrossRef CAS.
- S. H. Liu, J. Y. He, Z. Y. Wu, J. H. Jeong, B. Deng and R. Yu, J. Lumin., 2018, 200, 164–168 CrossRef CAS.
- G. Tiwari, N. Brahme, R. Sharma, D. P. Bisen, S. K. Sao and S. Tigga, Opt. Mater., 2016, 58, 234–242 CrossRef CAS.
- H. K. Liu, L. B. Liao, M. S. Molokeev, Q. F. Guo, Y. Y. Zhang and L. F. Mei, RSC Adv., 2016, 6, 24577–24583 RSC.
- V. Kumar, M. Manhas, A. K. Bedyal and H. C. Swart, Mater. Res. Bull., 2017, 91, 140–147 CrossRef CAS.
- R. Vijayakumar, H. Guo and X. Y. Huang, Dyes Pigm., 2018, 156, 8–16 CrossRef CAS.
- J. Y. Wang, J. B. Wang and P. Duan, Mater. Lett., 2013, 107, 96–98 CrossRef CAS.
- X. H. Zhang, Z. M. Lu, F. B. Meng, F. Lu, L. Hu, X. W. Xu and C. C. Tang, Mater. Lett., 2012, 66, 16–18 CrossRef CAS.
- Q. Guo, B. Ma, L. Liao, M. S. Molokeev, L. Mei and H. Liu, Ceram. Int., 2016, 42, 11687–11691 CrossRef CAS.
- K. Li, D. L. Geng, M. M. Shang, Y. Zhang, H. Z. Lian and J. Lin, J. Phys. Chem. C, 2014, 118, 11026–11034 CrossRef CAS.
- L. E. Muresan, I. Perhaita, D. Prodan and G. Borodib, J. Alloys Compd., 2018, 755, 135–146 CrossRef CAS.
- P. Ptáček, T. Opravil, F. Šoukal, J. Tkacz, J. Másilko and E. Bartoníčková, Ceram. Int., 2016, 42, 6154–6167 CrossRef.
- H. Njema, K. Boughzala, A. Chaabe` ne and K. Bouzouita, C. R. Chim., 2014, 17, 1237–1241 CrossRef CAS.
- F. Zhang and B. T. Liu, J. Alloys Compd., 2012, 542, 276–279 CrossRef CAS.
- J. Felsche, J. Solid State Chem., 1972, 5, 266–275 CrossRef CAS.
- X. Lu, H. T. Liu, X. Y. Yang, Y. G. Tian, X. L. Gao, L. Y. Han and Q. Xu, Ceram. Int., 2017, 43, 11686–11691 CrossRef CAS.
- S. Lahrich, M. A. Elmhammedi, B. Manoun, Y. Tamraoui, F. Mirinioui, M. Azrour and P. Lazor, Spectrochim. Acta, Part A, 2015, 145, 493–499 CrossRef CAS PubMed.
- X. H. Gong, Y. F. Lin, Y. J. Chen, Z. X. Huang, Y. D. Huang and Z. D. Luo, Chem. Mater., 2005, 17, 1135–1138 CrossRef CAS.
- H. Ye, M. Y. He, T. S. Zhou, Q. F. Guo, J. L. Zhang, L. B. Liao, L. F. Mei, H. K. Liu and M. Runowskid, J. Alloys Compd., 2018, 757, 79–86 CrossRef CAS.
- J. M. Hughes and M. Cameron, Am. Mineral., 1991, 76, 1165–1173 CAS.
- Q. F. Guo, L. B. Liao and Z. G. Xia, J. Lumin., 2014, 145, 65–70 CrossRef CAS.
- X. Gong, Y. Lin, Y. Chen, Z. Huang, Y. Huang and Z. Luo, J. Mater. Chem., 2005, 17, 1135–1138 CrossRef CAS.
- V. P. Tishkovets, J. Quant. Spectrosc. Radiat. Transfer, 2008, 109, 2665–2672 CrossRef CAS.
- L. L. Devi, C. Basavapoornima, V. Venkatramu, P. Babu and C. K. Jayasankar, Ceram. Int., 2017, 43, 16622–16627 CrossRef CAS.
- A. K. Parchur and R. S. Ningthoujam, Dalton Trans., 2011, 40, 7590–7594 RSC.
- S. N. Ogugua, H. C. Swart and O. M. Ntwaeaborwa, Phys. B, 2016, 480, 131–136 CrossRef CAS.
- J. B. Gruber, B. Zandi, U. V. Valiev and Sh. A. Rakhimov, J. Appl. Phys., 2003, 94(2), 1030–1034 CrossRef CAS.
- K. N. Shinde, S. J. Dhobe and A. Kumar, J. Lumin., 2011, 131, 931–937 CrossRef CAS.
- J. Pisarska, R. Lisiecki, W. Ryba-Romanowski, T. Goryczka and W. A. Pisarski, Chem. Phys. Lett., 2010, 489, 198–201 CrossRef CAS.
- S. Ruengsri, S. Insiripong, N. Sangwaranatee, H. J. Kim, N. Wantana, A. Angnanon and J. Kaewkhao, Integr. Ferroelectr., 2017, 177, 39–47 CrossRef CAS.
- U. Fawad, M. Oh, H. Park, S. Kim and H. J. Kim, J. Alloys Compd., 2014, 610, 281–287 CrossRef CAS.
- P. Haritha, I. R. Martín, K. Linganna, V. Monteseguro, P. Babu, S. F. León-Luis, C. K. Jayasankar, U. R. Rodríguez-Mendoza, V. Lavín and V. Venkatramu, J. Appl. Phys., 2014, 116, 174308 CrossRef.
- C. H. Huang and T. M. Chen, J. Phys. Chem. C, 2011, 115, 2349–2355 CrossRef CAS.
- P. Haritha, I. R. Martín, C. S. Dwaraka Viswanath, N. Vijaya, K. Venkata Krishnaiah, C. K. Jayasankar, D. Haranath, V. Lavín and V. Venkatramu, Opt. Mater., 2017, 70, 16–24 CrossRef CAS.
- G. Blasse, Philips Res. Rep., 1969, 24, 131–144 CAS.
- J. H. Chen, W. R. Zhao, J. Q. Wang, N. H. Wang, Y. J. Meng, J. He and X. Zhang, Ceram. Int., 2015, 41, 11945–11952 CrossRef CAS.
- R. Vijayakumar, H. Guo and X. Y. Huang, Dyes Pigm., 2018, 156, 8–16 CrossRef CAS.
- C. H. Huang, T. W. Kuo and T. M. Chen, ACS Appl. Mater. Interfaces, 2010, 2(5), 1395–1399 CrossRef CAS PubMed.
- L. G. Van Uitert, J. Electrochem. Soc., 1967, 114, 1048–1053 CrossRef CAS.
- D. L. Dexter and J. H. Schulman, J. Chem. Phys., 1954, 22, 1063–1070 CrossRef CAS.
- J. S. Kumar, K. Pavani, A. M. Babu, N. K. Giri, S. B. Rai and L. R. Moorthy, J. Lumin., 2010, 130, 1916–1923 CrossRef CAS.
- S. Fan, C. Yu, D. He, X. Wang and L. Hu, Opt. Mater. Express, 2012, 6, 765–770 CrossRef.
- T. Takeda, N. Hirosaki, S. Funahshi and R. Xie, Chem. Mater., 2015, 27, 5892–5898 CrossRef CAS.
- W. Xiao, X. Zhang, Z. Hao, G. Pan, Y. Luo and L. Zhang, Inorg. Chem., 2015, 54, 3189–3195 CrossRef CAS PubMed.
- S. Xin and G. Zhu, RSC Adv., 2016, 6, 41755–41760 RSC.
- L. Chen, R. Liu, W. Zhuang, Y. Liu, Y. Hu and X. Zhou, CrystEngComm, 2015, 17, 3687–3694 RSC.
|
| This journal is © The Royal Society of Chemistry 2018 |
Click here to see how this site uses Cookies. View our privacy policy here. 
 Open Access Article
 This Open Access Article is licensed under a Creative Commons Attribution-Non Commercial 3.0 Unported Licence
 *ab,
Libing Liao
*ab,
Libing Liao