
 Open Access Article
 This Open Access Article is licensed under a Creative Commons Attribution-Non Commercial 3.0 Unported Licence
Mn substituted MnxZn1−xCo2O4 oxides synthesized by co-precipitation; effect of doping on the structural, electronic and magnetic properties†
Tarekegn Heliso Dollaa,
David G. Billing b,
Charles Sheppardc,
Aletta Prinslooc,
Emanuela Carleschid,
Bryan P. Doyled,
Karin Pruessnere and
Patrick Ndungu*a
b,
Charles Sheppardc,
Aletta Prinslooc,
Emanuela Carleschid,
Bryan P. Doyled,
Karin Pruessnere and
Patrick Ndungu*a
aEnergy, Sensors and Multifunctional Nanomaterials Research Group, Department of Applied Chemistry, University of Johannesburg, Doornfontein Campus, South Africa. E-mail: pndungu@uj.ac.za
bDST-NRF Centre of Excellence in Strong Materials and Molecular Sciences Institute, School of Chemistry, University of the Witwatersrand, Johannesburg, South Africa
cChromium Research Group, Department of Physics, University of Johannesburg, Auckland Park, South Africa
dDepartment of Physics, University of Johannesburg, Auckland Park, South Africa
eSchool of Chemistry and Physics, University of KwaZulu-Natal, Durban, South Africa
First published on 29th November 2018
Abstract
Mn substituted MnxZn1−xCo2O4 (x = 0, 0.3, 0.5, 0.7, 1) oxides were synthesized by a facile co-precipitation method followed by calcination at 600 °C. The presence of manganese ions causes appreciable changes in the structural and magnetic properties of the Mn-substituted ZnCo2O4. The morphologies, structures, and electronic properties of Mn–Zn–Co oxide microspheres were characterized using scanning electron microscopy, transmission electron microscopy, X-ray diffraction, Fourier transform infrared spectroscopy, and X-ray photoelectron spectroscopy. The X-ray diffraction and Fourier transform infrared spectroscopy results confirmed the formation of spinel MnxZn1−xCo2O4. It was shown that the Mn–Zn–Co oxide microspheres increase in size and become regular in shape with increasing Mn concentration with the crystal size lying in the range from 19.1 nm to 51.3 nm. Magnetization measurements were carried out using a vibrating sample magnetometer at room temperature and 10 K. The saturation magnetization is observed to increase with increasing Mn concentration from x = 0 to x = 1.
1. Introduction
Nano-structured spinel-type transition metal oxides have been investigated intensively for various potential applications including chemical sensors,1,2 energy storage devices,3 pigments,4 catalysts5 and spintronics.6–8 Among the various transition metal oxides, spinel-type ZnCo2O4 has attracted much attention as an important p-type semiconductor; which has been used as an anode material in lithium ion batteries,9 in gas sensors,2,10 organic photovoltaics, electrocatalysis,11 photocatalysis,12,13 and as a p-type gate in junction field-effect transistors.14The magnetic properties of Zn–Co–O systems have been widely investigated, with a number of studies focusing on the thin films and powders, which have exhibited properties ranging from paramagnetic to strong ferromagnetic behaviour.15–18 Several studies have shown that room temperature ferromagnetism is observed in Zn based transition metal oxide systems such as Zn–Co–O and Zn–Co–Mn–O19 because of an exchange interaction mechanism such as double-exchange, super-exchange and through dopant electron-delocalized conduction band electron interactions.20,21 The ferromagnetism of spinel-type ZnCo2O4 is a continuous debate and its microscopic origins remain poorly understood. Its ferromagnetism is believed to arise due to hole mediated Co–Co interaction while the behaviour turns out to be antiferromagnetic as a result of Co–O–Co super exchange interaction,22 which also exhibits magnetoresistance effect and have application as promising materials for spintronics.23,24 Kim et al.22,25 have investigated the electrical and magnetic properties of spinel-type p-type semiconducting ZnCo2O4 thin films, with results suggesting that departure from stoichiometry in this compound affects its electrical and magnetic properties.
The ZnCo2O4 structure has remarkable features in that it forms a regular spinel structure where Zn2+ ions occupy tetrahedral (Th) sites and the Co3+ and Co2+ ions in octahedral (Oh) and some in tetrahedral sites.26,27 The variation in the magnetic properties of a ZnCo2O4 can arise when there is a substitution of nonmagnetic ions by magnetic ions. Many studies were conducted on Zn-based spinel oxides to demonstrate the effect of substitution of nonmagnetic ions on their magnetic and structural properties.28–30 The studies have shown a significant change in the magnetic properties during substitution due to a predominant super-exchange interaction between the cations in the A-site and B-site via oxygen ions.
In the present study, we report the synthesis of MnxZn1−xCo2O4 (x = 0, 0.3, 0.5, 0.7, and 1) employing a facile coprecipitation method. The structural, electronic and magnetic properties of the nano-crystalline MnxZn1−xCo2O4 in relation to the concentration of Mn were investigated.
2. Experimental
2.1 Chemicals
Analytical reagents of Ni(Ac)2·4H2O, Mn(Ac)2·4H2O and Co(Ac)2·4H2O were obtained from Sigma-Aldrich. NH4HCO3 and absolute ethanol (≥99.8%) were purchased from Merck Millipore.2.2 Materials synthesis
Mn substituted MnxZn1−xCo2O4 was synthesized with a facile co-precipitation method followed by annealing. In a typical synthesis of Mn0.5Zn0.5Co2O4 (x = 0.5), 0.245 g of Mn(Ac)2·4H2O, 0.22 g of Zn(Ac)2·4H2O and 0.996 g of Co(Ac)2·4H2O were dissolved in a mixture of 7 mL of ethanol and 70 mL of distilled water with vigorous stirring to form solution A. Then, 4.74 g of NH4HCO3 was dissolved in 70 mL of distilled water to form solution B, which was then added to solution A drop wise, while stirring. The resulting mixed solution was heated to 45 °C and maintained at this temperature for 9 h with vigorous stirring. A pale pink precipitate was obtained, which was collected through filtration, washed thoroughly with distilled water and ethanol and then dried at 60 °C overnight. The obtained carbonate precursor was heat treated in air at 600 °C for 5 h at a temperate ramp of 2 °C min−1 to yield a black powder.2.3 Characterization
The phase components and structure of the as-prepared materials were characterized using Bruker D2 Phaser X-ray Diffractometer (XRD; Co Kα radiation, λ = 1.78060 Å). The XRD data for Rietveld refinement was measured using a D9 X-ray Diffractometer (XRD; Mo Kα1 radiation, λ = 0.709321 Å) and was analyzed on TOPAS software (version 5). Fourier transform infrared (FTIR) spectra were recorded in the range of 4000−400 cm−1 using a Shimadzu 8400 FTIR spectrometer employing potassium bromide (KBr) pellets technique at room temperature. Morphology of the materials was obtained on FEI Nova Nano SEM 450 Scanning Electron Microscope (SEM) and JEOL 2100 Transmission Electron Microscopy (TEM). The composition of the samples was analyzed by EDX attached to the SEM instrument. Raman spectra were acquired at room temperature on a Thermo Scientific DXR2 Smart Raman equipped with a 532 nm laser source. The specific surface area was determined using Brunauer–Emmett–Teller (BET) technique and was determined from N2 adsorption/desorption isotherms obtained on an ASAP 2020 (Micrometrics instrument, USA) surface area analyzer. Thermogravimetric Analysis (TGA) was carried out under airflow with a temperature ramp of 10 °C min−1 using Thermogravimetry/Differential Thermal Analyzer (Hitachi-STA7200RV, California, USA). Magnetic measurements were performed using a Cryogenic measurement platform equipped with a vibrating sample magnetometer (VSM) insert. VSM measurements were done in zero field cooled (ZFC) and field cooled (FC) modus of measurement in a temperature range of 2 to 300 K. Hysteresis loops were performed in a field range of +2.5 T to −2.5 T at two different temperatures of 10 K and 300 K. X-ray photoemission (XPS) spectra were performed at room temperature using a SPECS PHOIBOS 150 hemispherical electron energy analyser. The photon source used was a SPECS XR 50 M monochromatised X-ray source equipped with an Al Kα anode (hν = 1486.71 eV). The overall energy resolution was set to 0.7 eV for survey spectra and 0.55 eV for all other high-resolution core level spectra shown in this work. High resolution XPS spectra for ZnCo2O4 are not reported here. The reason for this is that the sample was too insulating for charge compensation to take place effectively, even with the aid of a flood gun. The line shape of the XPS spectra for this sample was therefore distorted, making the information extracted from them meaningless. We therefore report high resolution core level spectra only for the other four compounds in the MnxZn1−xCo2O4 series (x = 0, 0.3, 0.5 and 0.7).3. Results and discussion
3.1 Formation of the spinel-type oxides
With the starting chemical precursors, the formation reactions of the MnxZn1−xCo2(CO3)2 precursor can be described in the following two steps:| 2NH4HCO3 → H2CO3 + 2NH+4 + CO2−3 | (1) |
| xMn2+ + (1 − x)Zn2+ + 2Co2+ + 2CO2−3 → MnxZn1−xCo2(CO3)2 | (2) |
The ammonium hydrogen carbonate used in the present synthesis mainly serves as a source for the generation of carbonate, as explained in eqn (1), while the divalent metal cations are obtained from the acetate precursors.
Thermal analysis allows for determining the precursor decomposition temperature during the heat treatment, which eventually will produce the oxide. Thermogravimetric (TG) and differential scanning calorimetric (DSC) analyses were performed to characterize the thermal properties and further determine the sintering temperature of the carbonate precursor. Fig. 1 shows the DSC and TG curves of the as prepared carbonate precursors for the composition x = 0.5. It can be seen that the carbonate precursor decomposes in two steps. The first step occurs between 120 °C and 190 °C, which is indicated by a small exothermic peak on the DSC curve. It is due to the evaporation of water adsorbed on the surface of the precursor sample. In the second step, a major mass loss of 35% occurs between 196 °C and 430 °C, which can be attributed to the decomposition of the carbonate precursor to a metal oxide. The DSC curve shows a sharp exothermic peak at about 376 °C, corresponding to this dominant mass loss, which indicates that the amorphous carbonate precursor transformed to Zn0.5Mn0.5Co2O4 at this temperature.
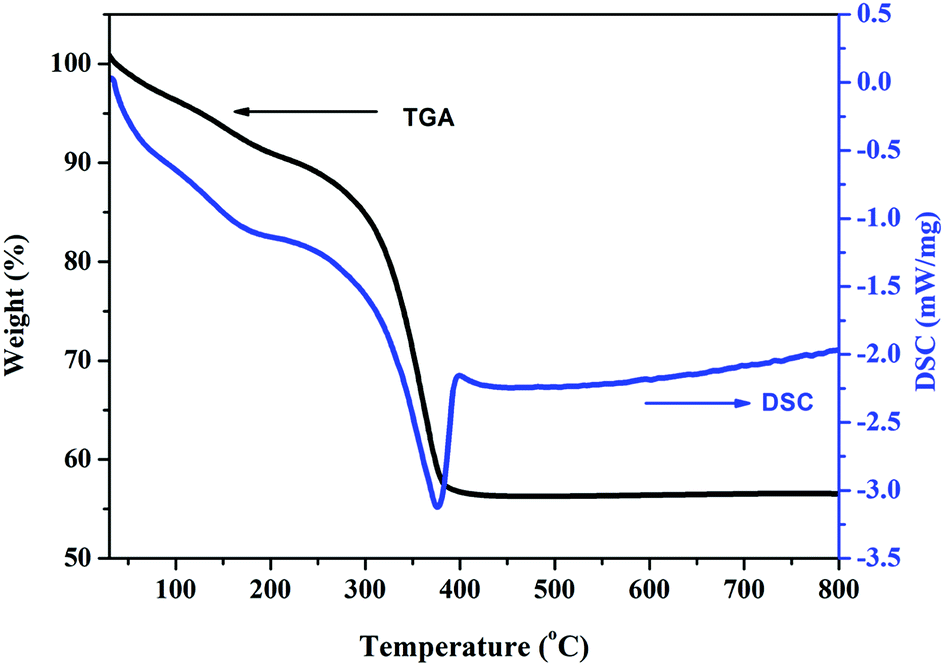 | ||
| Fig. 1 Thermogravimetric (TG) and differential scanning calorimetry (DSC) analysis curves of the Zn0.5Mn0.5Co2CO3 precursor in an air atmosphere. | ||
3.2 Structural studies
Crystalline nature and phase identity of the prepared materials were precisely determined from X-ray diffraction (XRD) studies. The XRD patterns of the Mn doped ZnCo2O4, MnxZn1−xCo2O4 (x = 0, 0.3, 0.5, 0.7, 1), oxides prepared by facile coprecipitation route and heat treatment at 600 °C are shown in Fig. 2.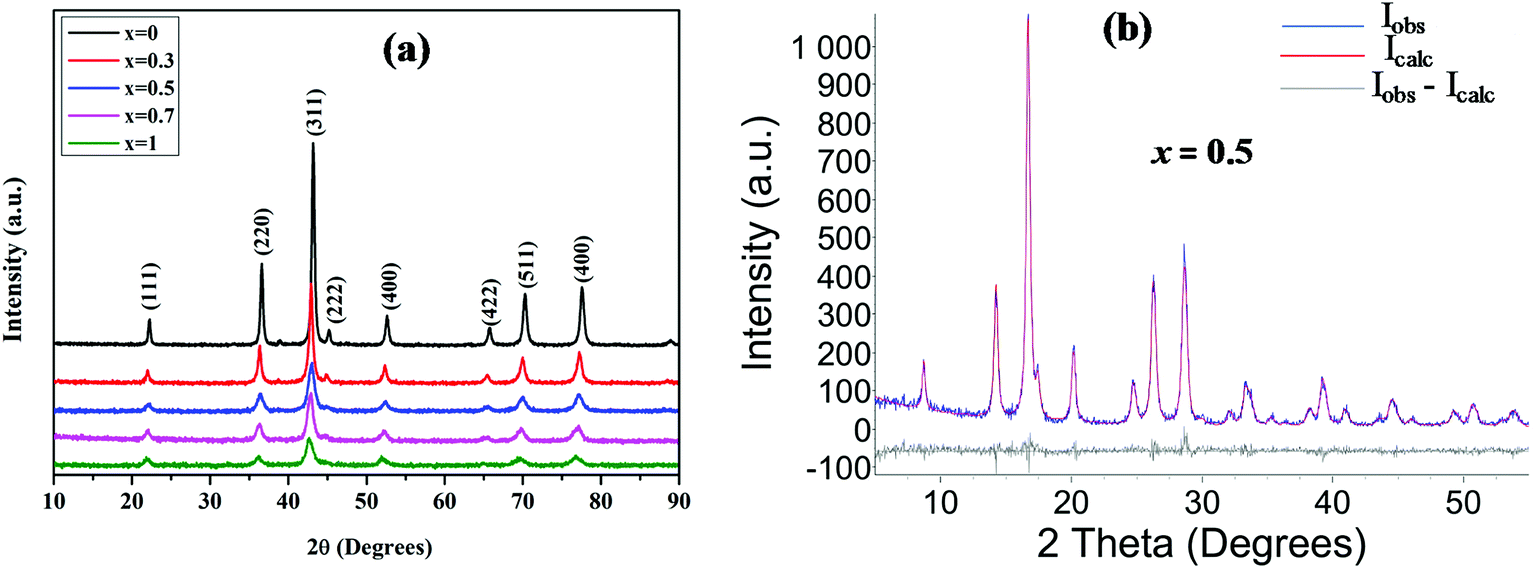 | ||
| Fig. 2 Panel (a) XRD patterns of the Mn substituted MnxZn1−xCo2O4 oxide with different Mn concentrations; x = 0, 0.3, 0.5, 0.7 and 1. Panel (b) Rietveld refined XRD pattern of Mn0.5Zn0.5Co2O4. | ||
The peaks at 2θ values are well matched with the standard cubic spinel structure of ZnCo2O4 (PDF card no. 23-1390) and MnCo2O4 (PDF card no. 23-1237) corresponding to the (111), (220), (311), (222), (400), (422), (511), and (440) lattice planes. This observation demonstrates the formation of a single phase for all the compositions. The intensity of the diffraction peaks of MnxZn1−xCo2O4 increases and the peak width (full width at half maximum, FWHM) decreases with increasing Zn concentration. The crystallite size was observed to decrease irregularly from 51 to 19 nm with increasing Mn concentration. Rietveld analysis of the XRD pattern of MnxZn1−xCo2O4 obtained from X-ray diffractometer with Mo-tube (see Fig. S-1† for XRD data using Mo, and Fig. S-2† for Rietveld refined patterns) is shown in Fig. 2(b) and the values are presented in Table 1 with the reliability factors (Rwp, RB, GOF), lattice parameter and crystal size given.
| Compound | Lattice parameter (a), Å | Rwp (%) | RB (%) | GOF | Average crystallite size (nm) |
|---|---|---|---|---|---|
| ZnCo2O4 | 8.0874 | 13.90 | 2.55 | 1.17 | 51.3 |
| Mn0.3Zn0.7Co2O4 | 8.1051 | 13.06 | 3.47 | 1.17 | 36.8 |
| Mn0.5Zn0.5Co2O4 | 8.1241 | 14.29 | 2.40 | 1.09 | 19.9 |
| Mn0.7Zn0.3Co2O4 | 8.1349 | 15.48 | 2.74 | 1.16 | 26.7 |
| MnCo2O4 | 8.1508 | 14.49 | 2.85 | 1.11 | 19.3 |
The lattice parameter, a = 8.0874 Å, calculated for ZnCo2O4 is close to the reported values (PDF card no. 23-1390). On substituting Mn ions for Zn2+, the lattice parameter increases compared to that of the pure ZnCo2O4 because of the slightly bigger ionic size of Mn ions compared to Zn2+ (0.740 Å).31 The lattice parameter shows a clear increase and a linear behaviour with increase of Mn ion doping which further corroborates successful substitution by the Mn ion.
Raman spectra for all of the compositions were recorded at room temperature and are shown in Fig. 3. The samples displayed two broad peaks between 460–540 cm−1, and 670–720 cm−1. Typically spinel metal oxides such as ZnCo2O4 and MnCo2O4 display 5 active Raman modes. With ZnCo2O4 there are three F2g modes which can occur around 190, 520, and 610 cm−1, an Eg mode around 470 cm−1, and an A1g mode at 690 cm−1.32–34 The phonon modes (three F2g, an Eg, and an A1g mode) for MnCo2O4 occur at similar positions.35 The broad peaks obtained obscure the various modes, and the broadness can be attributed to the nano-size of the materials (see TEM analysis section).
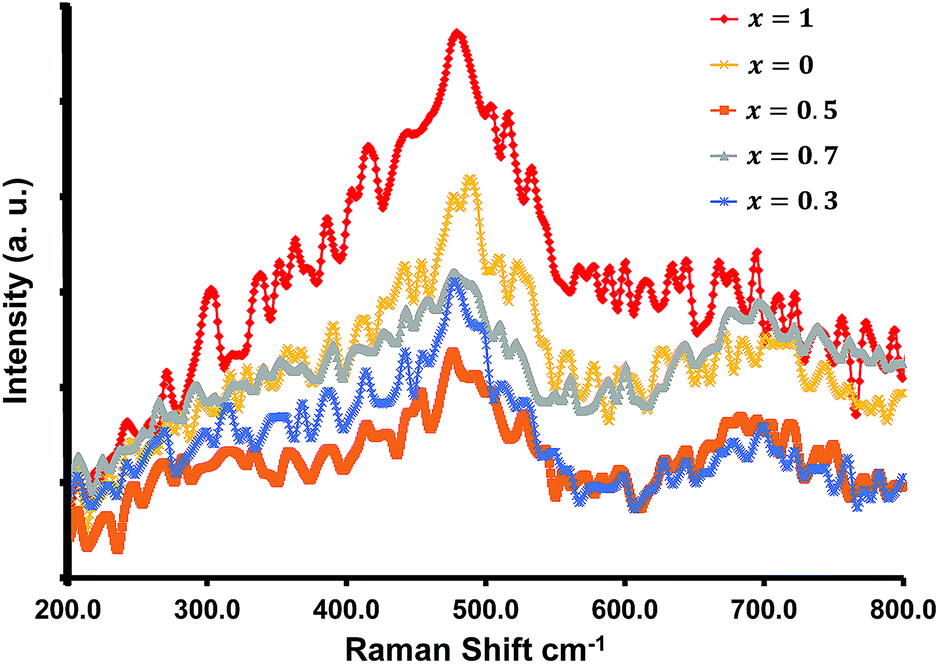 | ||
| Fig. 3 Raman spectra of various concentration of Mn doped ZnCo2O4. | ||
These characteristics peaks for crystalline spinel metal oxides can shift by several cm−1, and can be ascribed to the change in the surface strain or defects owing to the incorporation of Mn into the ZnCo2O4 crystal structure.32–35 The lack of distinct separate or characteristic peaks for the separate oxides are in accordance with the XRD results.
FTIR spectroscopy is an important technique to identify the stretching and bending vibrations of different materials. Fig. 4 shows FTIR spectra in the range from 1000 to 400 cm−1 as signals in this range are generally attributed to the vibration bands of metallic ions in the crystal lattice. Two intense peaks were observed between 700 and 550 cm−1 for each MnxZn1−xCo2O4 (x = 0, 0.3, 0.5, 0.7 and 1) sample, with a specific shift depending on Mn substitution (x). ZnCo2O4 (x = 0) exhibited absorption peaks centered at 677 and 585 cm−1 characteristic of Co–O and Zn–O vibration in the octahedral and tetrahedral sites of the spinel structure, respectively.36 On doping ZnCo2O4 with Mn, the Mn ions replace Zn2+ from the tetrahedral site as it is evident from the change in the lattice parameter shown in the Rietveld refinement of XRD data, and the bands shift to higher wavenumbers, as seen in Fig. 4. For MnCo2O4 (x = 1), the peaks shift to 648 and 560 cm−1 compared to the undoped ZnCo2O4. This behaviour suggests changes in bonding occurs in the crystal structure, which could be affected by the ratio between Zn and Mn and the lighter atomic mass of Mn compared to that of Zn.29 These observations further support the formation of cubic spinel crystal structure in the fabricated MnxZn1−xCo2O4.
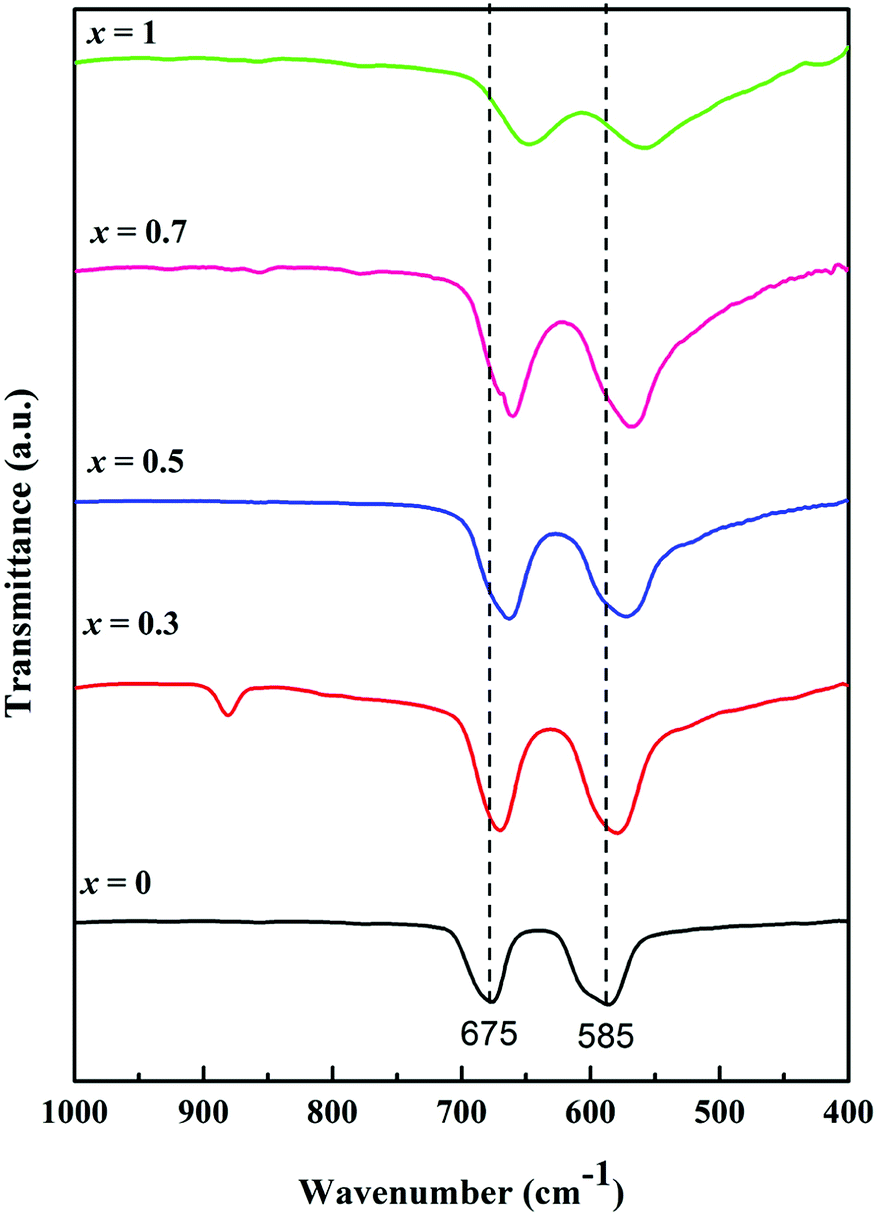 | ||
| Fig. 4 FTIR spectra of the Mn substituted MnxZn1−xCo2O4 oxide with different Mn concentrations; x = 0, 0.3, 0.5, 0.7 and 1. | ||
XPS measurements were performed in order to study the composition and investigate the electronic structure of the MnxZn1−xCo2O4 series. Fig. 5(a) shows the full survey spectra for the five investigated samples. The spectra show all the expected peaks and no additional elements were detected. Photoemission and Auger peaks are labeled accordingly in the figure. Zn and Mn core levels vary in intensity according to the sample composition, as expected.
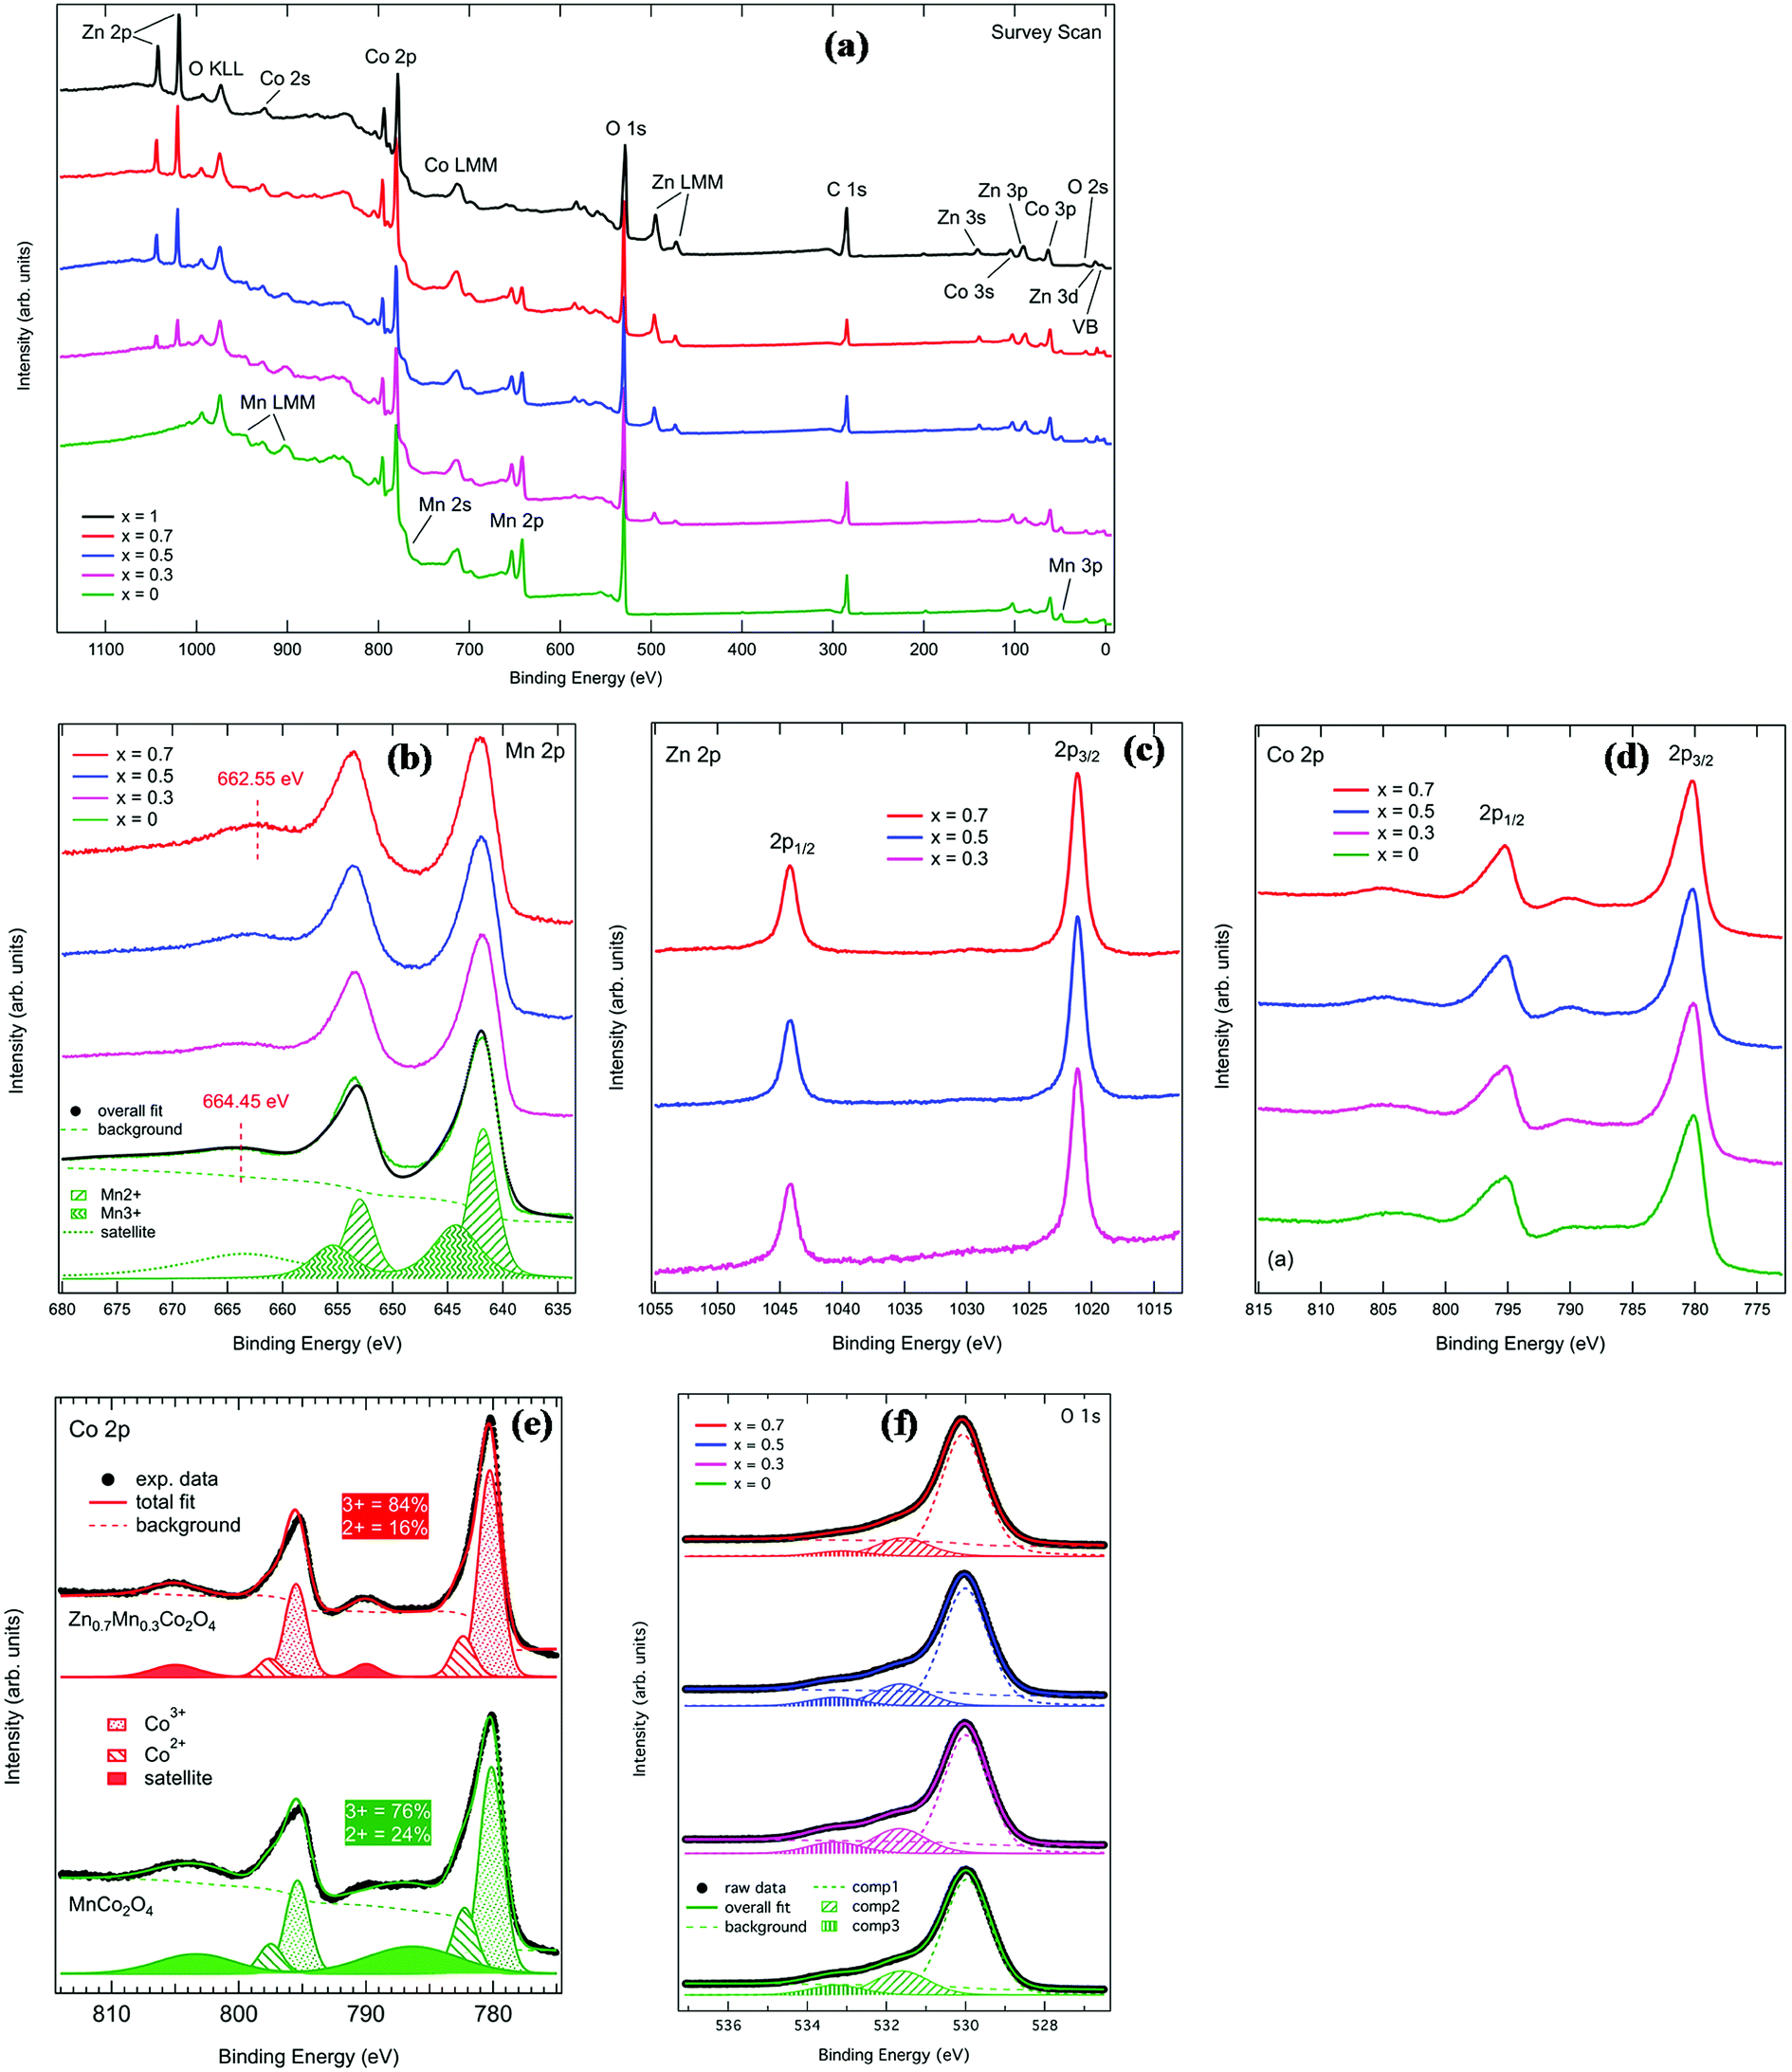 | ||
| Fig. 5 (a) XPS survey scans for the investigated samples. (b) Mn 2p core level spectra for x = 0.3, 0.5, 0.7, and 1 samples (c) Zn 2p spectra for x = 0.3, 0.5 and 0.7 samples (d) Co 2p core level spectra for MnxZn1−xCo2O4 spinel oxides. (e) Fitted Co 2p spectra for MnCo2O4 and Zn0.7Mn0.3Co2O4 and (f) O 1s core level spectra for MnxZn1−xCo2O4 spinel oxides. | ||
Fig. 5(b) shows the comparison of Mn 2p XPS core level spectra. Two main peaks with centroids at about 642 eV and 653.5 eV binding energy are visible in this energy region. These correspond to Mn 2p3/2 and 2p1/2 levels, respectively. The line shape of the main peaks remains identical across the series, indicating that there is no appreciable change in the valence of Mn with substitution by Zn. The only detectable difference is that the centroid of the satellite at the higher binding energy side of the 2p1/2 peak shifts by about 1.9 eV towards lower binding energies from x = 0 to x = 0.7 (the corresponding satellite for the 2p3/2 peak is not visible because it overlaps with the 2p1/2 peak). This is possibly due to the doping of the samples, as already reported for doped manganites.37 Because of the fact that the line shape of the main peaks does not change, only the fit of the x = 0 sample at the bottom of Fig. 5(b) is reported. The Mn core level line shape was deconvoluted using two spin orbit doublets representing Mn2+ (at lower binding energy) and Mn3+ (at higher binding energy) respectively, separated by a spin orbit splitting of 11.2 eV. The area ratio of these two doublets shows that roughly 55% of the Mn ions have a 2+ ionization state and 45% have a 3+ ionization state.
Zn 2p core level spectra for samples x = 0.3, 0.5 and 0.7 are reported in Fig. 5(c). The line shape is composed of two peaks at 1021.1 eV and 1044.2 eV, corresponding to Zn 2p3/2 and 2p1/2 spin orbit components, respectively. The line shape remains the same for the three compositions. This is consistent with Zn ions being found in +2 oxidation state, as reported in previous works.38,39
Fig. 5(d) reports the Co 2p XPS spectra for MnxZn1−x Co2O4. The Co 2p binding energy region is composed of two main peaks located at 780.2 eV and 795.3 eV, corresponding to the Co 2p3/2 and Co 2p1/2 spin–orbit components, respectively. In addition to these, two satellite peaks are detected on the higher binding energy of the main peaks. The line shape of the Co 2p spectrum shows changes across the series. For this reason, the spectra for MnCo2O4 and Zn0.7Mn0.3Co2O4 are plotted separately in Fig. 5(e), together with the overall fit to the data. The spectra have been decomposed into two main doublets corresponding to Co3+ (at lower binding energy) and Co2+ (at higher binding energy) oxidation states. The satellite has been fitted with a broad doublet. It is interesting to note that the percentage of Co3+ spectral weight increases from 76% in MnCo2O4 to 84% in Zn0.7Mn0.3Co2O4. This shows that the Co3+ content is slightly higher than in similar oxide systems.40,41 At the same time, the centroid of the satellite doublet shifts to 4 eV higher binding energy and becomes much narrower when moving from MnCo2O4 to Zn0.7Mn0.3Co2O4.
The ratio of Co3+/Co2+ ions present in the MnxZn1−xCo2O4 oxides can be determined from the deconvoluted high resolution Co 2p spectrum and is given in Table 2. For the prepared samples, with increase in manganese concentration Co3+/Co2+ ratio increases, which are consistent with previously reported literatures.42,43
| MnxZn1−xCo2O4 | Oxidation states ratios obtained from XPS | |
|---|---|---|
| Co3+/Co2+ | Mn3+/Mn2+ | |
| x = 0.3 | 5.25 | 0.82 |
| x = 0.5 | 4.55 | 0.82 |
| x = 0.7 | 3.87 | 0.82 |
| x = 1 | 3.17 | 0.82 |
Fig. 5(f) shows the O 1s XPS spectra for the series. Each spectrum has been fitted with three Voigt-type single components (labeled as “comp1”, “comp2” and “comp3” in the figure) in addition to a Shirley background. This is consistent with what has been published in the literature for similar systems.40,41 Component 1, on the lower binding energy side, is ascribed to stoichiometric oxygen in the oxide main matrix, while the second component is attributed to oxygen vacancies or defects in the lattice.41 The third component at 533 eV can be ascribed to chemisorbed oxygen.44 The fitted binding energies and relative percentage areas of these three components are reported in Table 3. In general, the fit results show that there is no significant change in the line shape of O 1s spectra across the series.
| Sample | BE comp1 (eV) | BE comp2 (eV) | BE comp3 (eV) | % area (comp1) | % area (comp2) | % area (comp3) |
|---|---|---|---|---|---|---|
| x = 0 | 529.97 | 531.61 | 533.27 | 74.9 | 17.8 | 7.3 |
| x = 0.3 | 530.02 | 531.67 | 533.31 | 73.4 | 18.3 | 8.3 |
| x = 0.5 | 530.01 | 531.65 | 533.29 | 76.7 | 16.7 | 6.6 |
| x = 0.7 | 530.07 | 531.58 | 533.12 | 81.2 | 14.6 | 4.2 |
3.3 Morphological characterization
Fig. 6(a) through Fig. 6(e) presents the SEM images of the MnxZn1−xCo2O4 (x = 0, 0.3, 0.5, 0.7, 1) while Fig. 5(f) is EDS spectrum of the Mn0.5Zn0.5Co2O4 sample. Microspheres of different size with varying concentration of Mn have been obtained as observed from the SEM images. The size of the microspheres tends to increase and become more regular with increasing concentration of Mn from x = 0 to x = 1. The results indicate that Mn content plays an important role in determining the surface morphologies of MnxZn1−xCo2O4 microstructure. The EDS analysis of the Mn0.5Zn0.5Co2O4 sample in Fig. 5(f) shows that the main elements in the sample are manganese, zinc, cobalt, and oxygen and that the approximate atomic ratio of Mn/Zn/Co is about 1![[thin space (1/6-em)]](https://www.rsc.org/images/entities/char_2009.gif) :0.97:2.1.
:0.97:2.1.
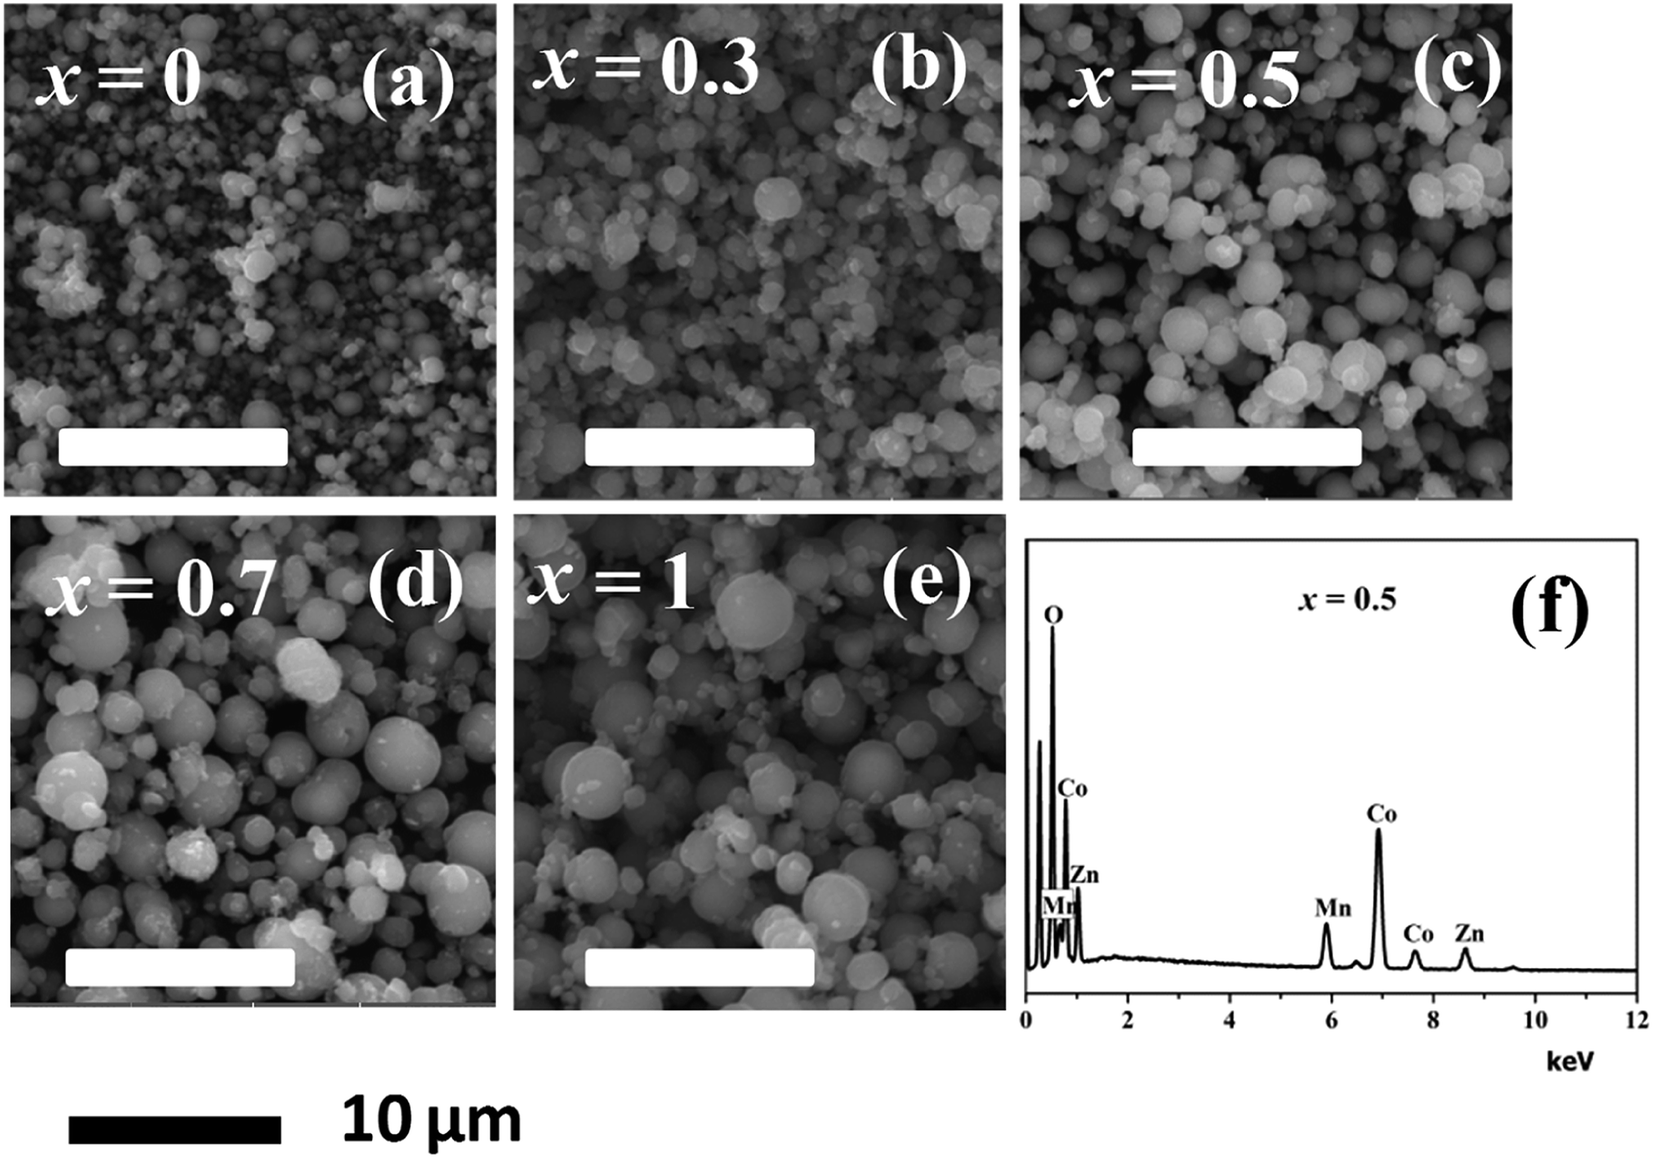 | ||
| Fig. 6 SEM images of the MnxZn1−xCo2O4 microspheres (x = 0, 0.3, 0.5, 0.7, 1) (a–e), and (f) EDS spectrum of the Mn0.5Zn0.5Co2O4 (x = 0.5) sample. | ||
Representative TEM, HRTEM, and SAED images of Mn0.5Zn0.5Co2O4 microspheres are shown in Fig. 7. The TEM image demonstrates the porous nature of the microspheres and it is made up of small interconnected nanoparticles as shown by the magnified TEM image (Fig. 7(c)). Clearly, the corresponding selected-area electron diffraction (SAED) pattern displays the diffraction rings, indicating that the porous Mn0.5Zn0.5Co2O4 microspheres are polycrystalline (Fig. 7(d)). The HRTEM image (Fig. 7(b)) further confirms the high crystallinity of the porous Mn0.5Zn0.5Co2O4 microspheres. The lattice fringe with a spacing of ∼2.4 Å is assigned to the interplanar spacing between the (311) planes of cubic Mn0.5Zn0.5Co2O4.
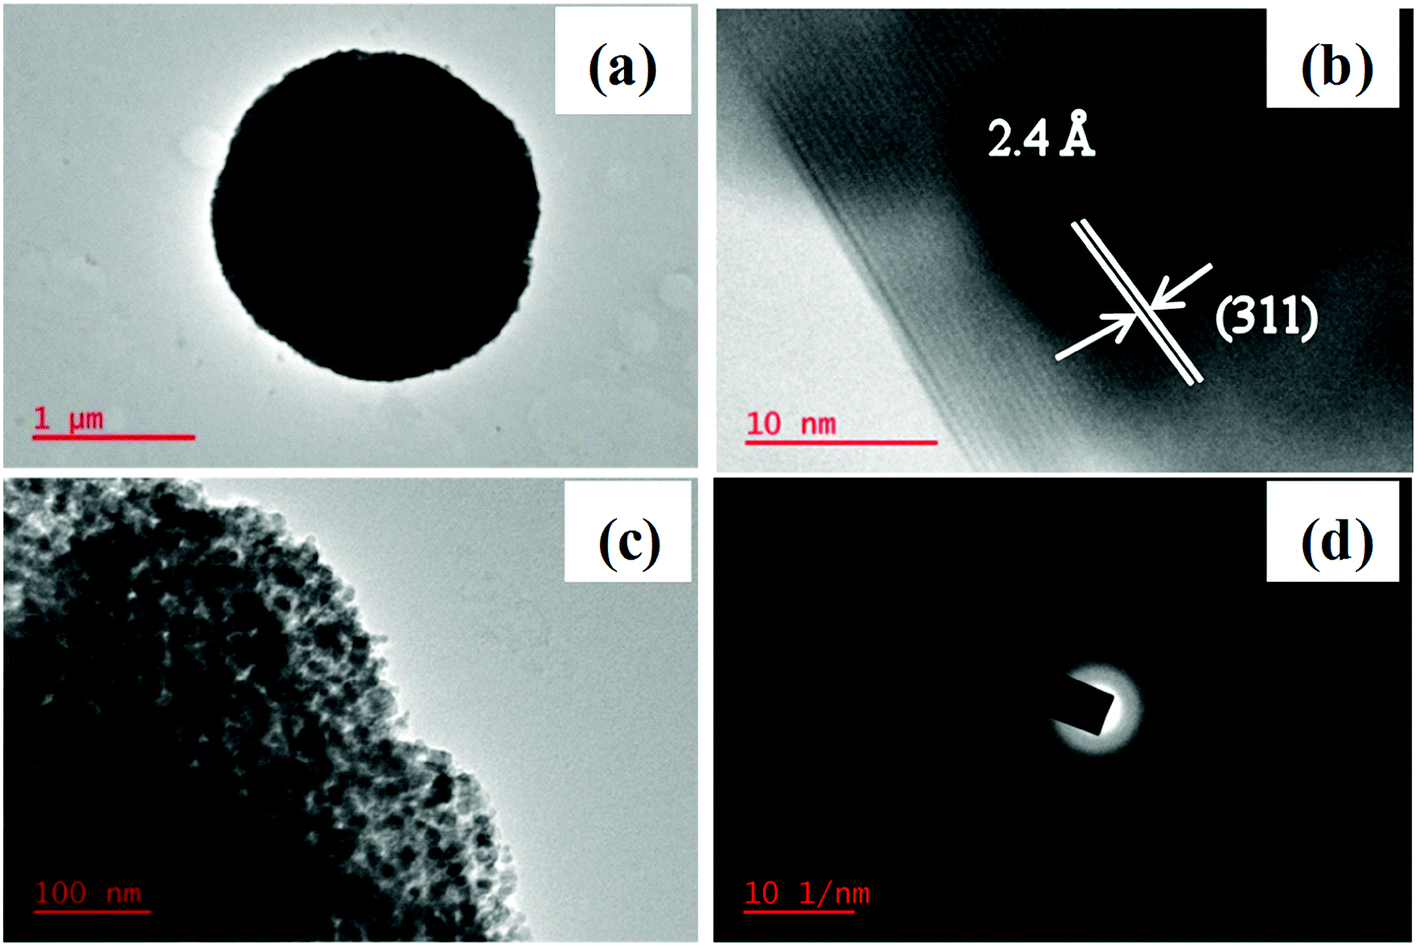 | ||
| Fig. 7 (a) TEM, (b) HRTEM (c) magnified TEM and (d) SAED pattern of the Mn0.5Zn0.5Co2O4 (x = 0.5) microsphere. | ||
The specific surface areas and pore size distribution of MnxZn1−xCo2O4 oxides were characterized by BET analysis using nitrogen adsorption–desorption isotherms. The N2 adsorption–desorption isotherms and pore size distribution data for MnxZn1−xCo2O4 (x = 0, 0.3, 0.5, 0.7, 1) samples are shown in Fig. 8. As shown in the Fig. 8(a), the N2 adsorption–desorption isotherms obtained for the MnxZn1−xCo2O4 are type IV, according to the IUPAC classification of hysteresis loops.45 Distinct H3 hysteresis loops were observed at a relative pressure of P/Po = 0.8–1.0 except for ZnCo2O4, indicating the mesoporous structure of MnxZn1−xCo2O4 microspheres.46 The textural properties of the samples are given in Table 4. It can be seen that the BET surface areas of 17.8, 50.25, 51.47, 56.27, and 51.66 m2 g−1 were obtained for ZnCo2O4, Mn0.3Zn0.7Co2O4, Mn0.5Zn0.5Co2O4, Mn0.7Zn0.3Co2O4, and MnCo2O4, respectively. It was observed that the BET surface area increases with substitution of Zn by Mn. This modification of the surface area correlates with the change in microsphere size as shown on the SEM images. The pore size distributions were mainly centered between 20 and 30 nm with an average pore diameter of 36, 19.4, 20, 17.5, and 18.4 nm, mainly resulting from the aggregation among primary particles as is evident from the TEM image.
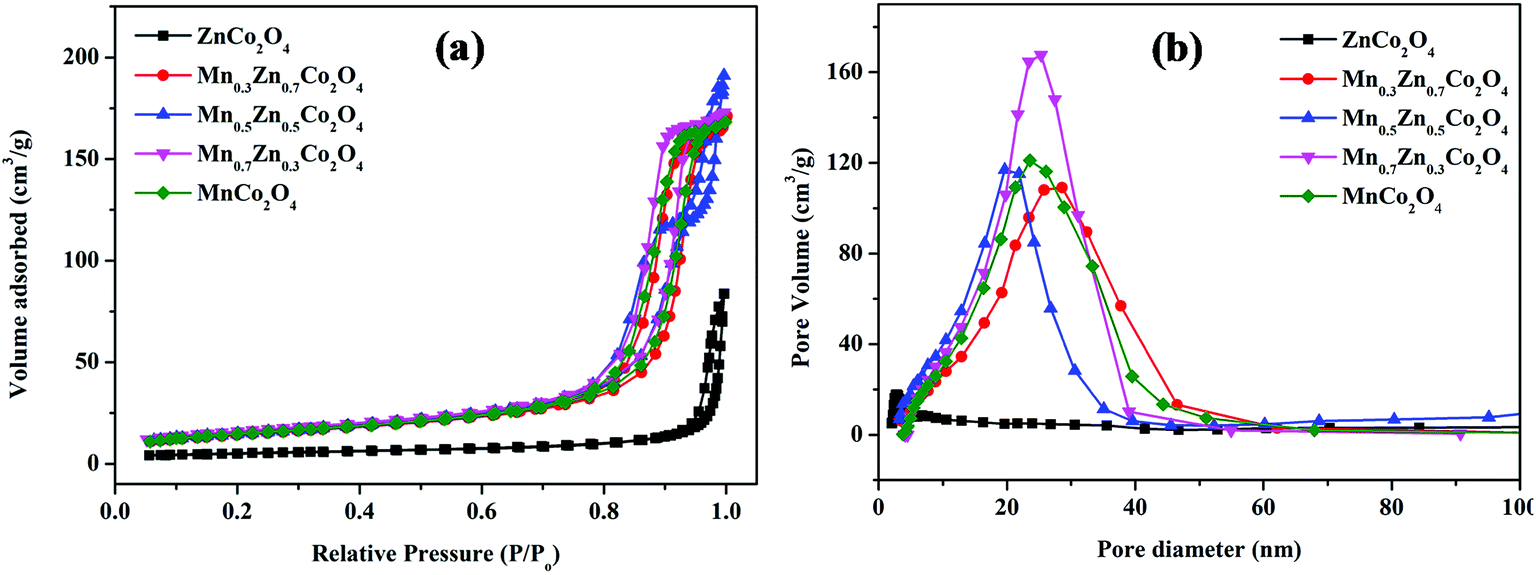 | ||
| Fig. 8 Nitrogen adsorption/desorption isotherms (a) and the corresponding pore size distributions (b) of the MnxZn1−xCo2O4 (x = 0, 0.3, 0.5, 0.7, 1) samples. | ||
| Sample | BET surface area (m2 g−1) | Pore volume (cm3 g−1) | Average pore size (nm) |
|---|---|---|---|
| ZnCo2O4 | 17.80 | 0.00563 | 36.0 |
| Mn0.3Zn0.7Co2O4 | 50.25 | 0.01280 | 19.4 |
| Mn0.5Zn0.5Co2O4 | 51.47 | 0.01461 | 20.0 |
| Mn0.7Zn0.3Co2O4 | 56.27 | 0.01353 | 17.5 |
| MnCo2O4 | 51.66 | 0.01171 | 18.4 |
3.4 Magnetic properties
The magnetic properties of MnxZn1−xCo2O4 samples were examined using a vibrating sample magnetometer (VSM) at room temperature and 10 K by applying a magnetic field of ±25 kOe. Magnetic hysteresis loops and the temperature dependent zero-field-cooled (ZFC) and field-cooled (FC) curves are shown in Fig. 9 and 10, respectively.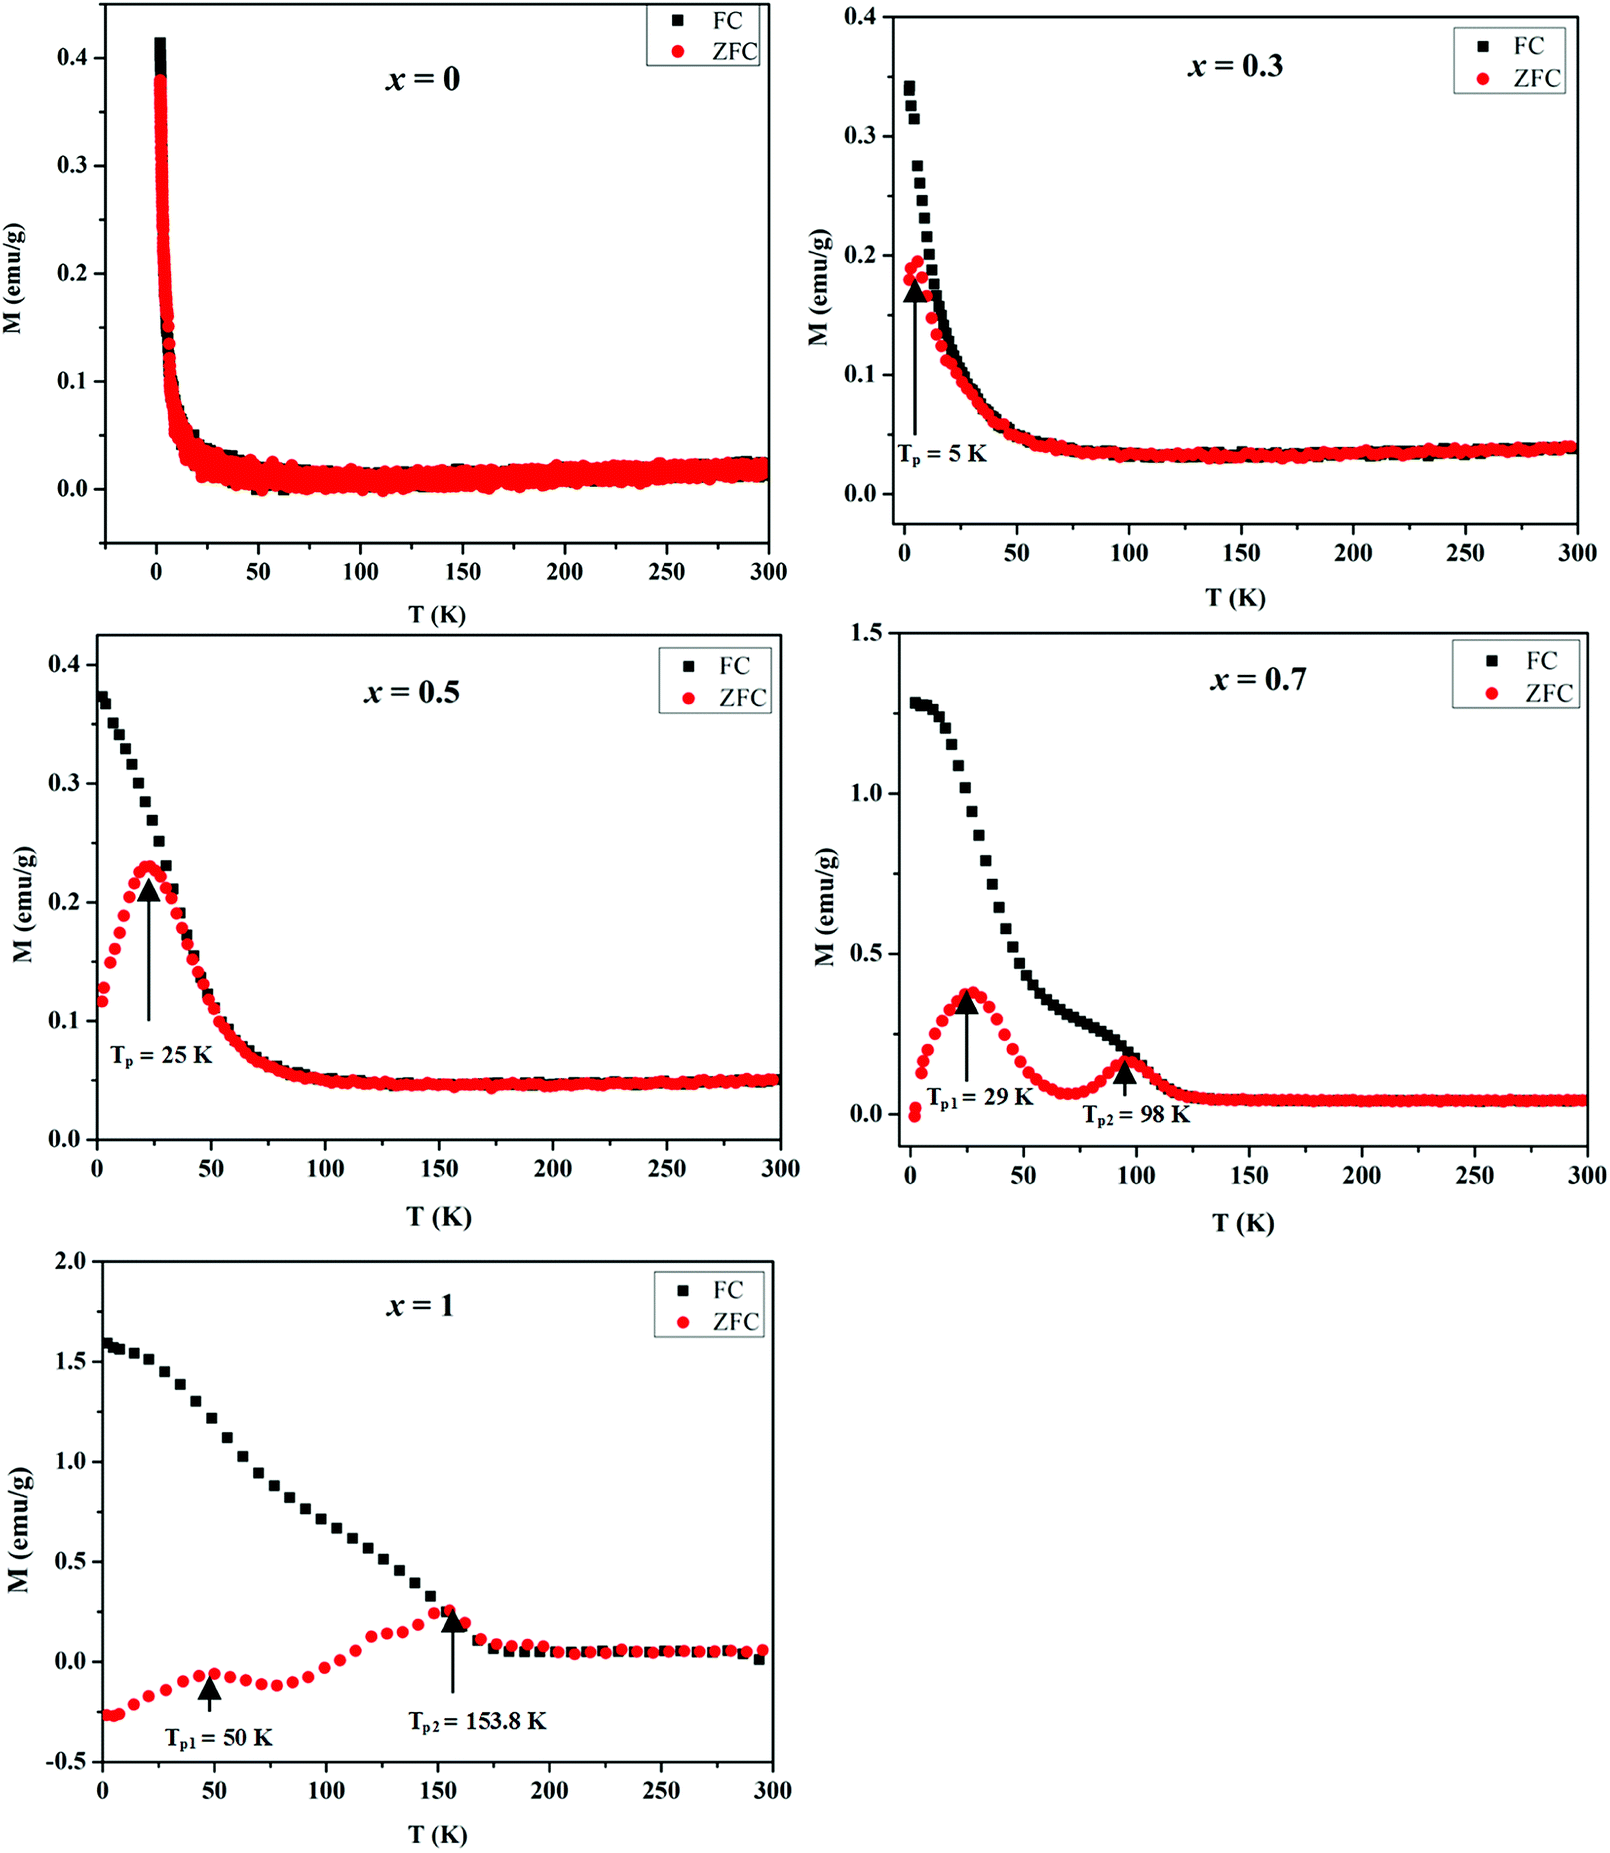 | ||
| Fig. 9 Temperature dependent ZFC and FC magnetization of MnxZn1−xCo2O4 microspheres with different concentration of Mn (x = 0, 0.3, 0.5, 0.7, 1) measured at an applied field of 500 Oe. | ||
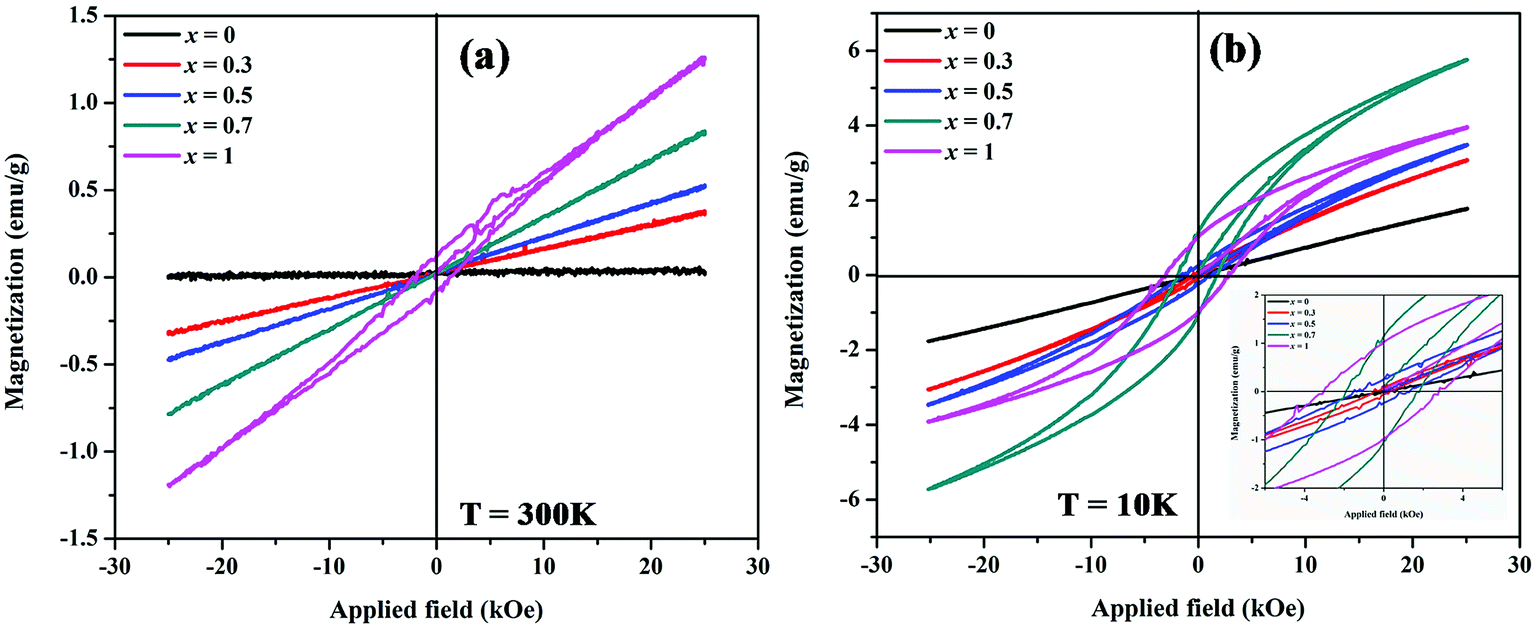 | ||
| Fig. 10 Magnetic hysteresis loops of MnxZn1−xCo2O4 microspheres with different concentration of Mn (x = 0, 0.3, 0.5, 0.7, 1) measured at (a) 300 K and (b) 10 K. | ||
Temperature dependent magnetization curves M(T) were collected under the zero field cooled (ZFC) and field cooled (FC) conditions and measured in the temperature range 2–300 K at 500 Oe. The magnetization during FC for all samples shows a general increase with decreasing temperature. However, it is noted that as the Mn concentration is increased the FC data tends to level of at low temperatures and an additional inflection similar to the peaks observed in the ZFC M(T) data develops. All the samples exhibit distinct bifurcation between ZFC and FC, except ZnCo2O4 (x = 0) for which the zero-field cooled and field cooled (ZFC-FC) curves did not diverge. The bifurcation temperature increases with an increase in Mn doping.
Generally, the presence of a maximum temperature (Tmax) in the ZFC magnetization curve is directly proportional to the average blocking temperature (TB) that depends upon the type of size distribution. The temperatures associated with the maxima in the ZFC magnetization data for the prepared MnxZn1−xCo2O4 samples is observed at TP = 5.5 K for x = 0.3, TP = 25 K for x = 0.5, TP1 = 29 K and TP2 = 98 K for x = 0.7, and TP1 = 50 K and TP2 = 153.8 K for x = 1. It is clear from these data that as more of Zn is substituted by Mn, the TP values increase and eventually more than one TP values are observed for x = 0.7 and 1, which may well be a result of the substitution of nonmagnetic Zn2+ by the Mn2+/Mn3+ ions.47 On moving form x = 0.7 to x = 1.0 the magnetization is suppressed to negative values below a temperature of approximately 100 K. This is due to a compensation effect, as the net magnetization is dependent on the sum of the magnetic contributions from the associated sublattices within the spinel structure.48
Fig. 10 shows magnetic hysteresis loops of MnxZn1−xCo2O4 (x = 0, 0.3, 0.5, 0.7, 1) microspheres measured at temperatures of 10 K and 300 K. The magnetization as a function of applied magnetic field, M–H, curves shows hysteretic behavior in all samples at 10 K, with the exception of the ZnCo2O4 sample. The magnetization is not fully saturated in fields of 25 kOe in all samples measured at 10 K, which represents the weak ferromagnetic ordering of the spins. The saturation magnetization for the samples was determined from extrapolation of M versus 1/H curve at 1/H = 0. The saturation magnetization (Ms), remnant magnetization (Mr), and coercive field (Hc) are summarized in Table 5. The Ms gradually increases from 0.01 (x = 0) to 1.3 (x = 1) emu/g and 1.82 (x = 0) to 5.92 (x = 0.7) emu g−1 measured at 300 K and 10 K, respectively with increasing Mn concentrations. The maximum value of Hc is observed for x = 1 (MnCo2O4).
| Sample | 300 K | 10 K | ||||
|---|---|---|---|---|---|---|
| Ms (emu g−1) | Mr (emu g−1) | Hc (kOe) | Ms (emu g−1) | Mr (emu g−1) | Hc (kOe) | |
| ZnCo2O4 | 0.01 | 0 | 0 | 1.82 | 0 | 0 |
| Mn0.3Zn0.7Co2O4 | 0.4 | 0 | 0 | 3.15 | 0.07 | 0.3 |
| Mn0.5Zn0.5Co2O4 | 0.55 | 0 | 0 | 3.51 | 0.25 | 1.32 |
| Mn0.7Zn0.3Co2O4 | 0.87 | 0 | 0 | 5.92 | 1.15 | 1.93 |
| MnCo2O4 | 1.3 | 0.12 | 1.2 | 4.08 | 1.03 | 3.02 |
M–H measurements done at 300 K shown in Fig. 10(a) reflects linear behavior associated with paramagnetism for all the samples, with the exception of the MnCo2O4 (x = 1) sample. For this sample weak hysteresis is still observed, thus indicating the antiferromagnetic nature of this sample at 300 K.43,49 This type of behavior is observed for Cu substituted spinel MnCo2−xCuxO4 (0 ≤ x ≤ 0.2) nanostructures with the samples x ≥ 0.1 having the coercivity Hc and remanence Mr close to 0.50
In the MnxZn1−xCo2O4 the non-magnetic divalent Zn2+ ions tend to occupy tetrahedral (A) sites and thereby force the incoming Mn ions to octahedral (B) sites due to their favoritism by polarization effect.30 In general, spinel type cobalt-based oxides contain high spin Co2+ (S = 3/2) in the tetrahedral site and low spin diamagnetic Co3+ (S = 0) in the octahedral site; magnetic ions in the sub lattices are arranged antiparallel to their four neighboring ions resulting in antiferromagnetic behavior of the material.51 In view of the above considerations and the ratio Co3+/Co2+ given in the Table 2 it can be shown that there is an enhancement of weak ferromagnetism of the samples with substitution of Zn with Mn ions. ZnCo2O4 is observed to have a linear M–H curve both at room temperature and 10 K, which is typical of paramagnetic nature and results due to Co–O–Co super exchange interaction.22,23 As the content of Mn ions increase and with both Mn2+ and Mn3+ distributed in the octahedral and tetrahedral sites, the magnetic moment on B-site increases and the magnetic moment on A-sites decreases and it leads to a stronger superexchange interaction between A and B sites. Thus, the net value of Ms increases, as expected.
4. Conclusions
MnxZn1−xCo2O4 oxide microspheres with a spinel structure were successfully prepared by using a facile coprecipitation method and calcination. It formed porous microspheres with the surface area and morphology being influenced by the composition of Mn. The lattice parameters for the spinel oxides increased linearly with Mn concentration. The results from XPS indicates that the elements Mn, Zn, and Co are observed to have oxidation states of +2 and +3, +2, and +2 and +3, respectively. It was shown that the percentage of Co3+ spectral weight increases from 76% in MnCo2O4 to 84% in Zn0.7Mn0.3Co2O4 whereas no appreciable change in the valence of Mn was observed with substitution by Zn. The magnetic properties of the MnxZn1−xCo2O4 microspheres are largely influenced by the concentration of Mn. As the concentration of Mn increases from x = 0 to x = 1 the saturation magnetization increases from 0.01 (x = 0) to 1.3 (x = 1) emu g−1 and 1.82 (x = 0) to 5.92 (x = 0.7) emu g−1 measured at 300 K and 10 K, respectively, which could be due to the substitution of the non-magnetic Zn2+ ion by Mn ions. The MnCo2O4 microspheres show maximum Hc of 1.2 and 3.02 kOe measured at 300 K and 10 K, respectively.Conflicts of interest
There are no conflicts to declare.Acknowledgements
The work reported herein was partially funded the National Research Foundation (South Africa), Grant numbers: 88080, 109623, and 93620. In addition, the authors thank the Centre for Nanomaterials Science Research at the Department of Applied Chemistry, the Department of Physics, the Faculty of Science at University of Johannesburg, and the School of Chemistry at University of the Witwatersrand, for support and access to research facilities.References
- X. Niu, W. Du and W. Du, Preparation and gas sensing properties of ZnM2O4 (M = Fe, Co, Cr), Sens. Actuators, B, 2004, 99(2–3), 405–409 CrossRef CAS.
- H. J. Park, J. Kim, N.-J. Choi, H. Song and D.-S. Lee, Nonstoichiometric Co-rich ZnCo2O4 hollow nanospheres for high performance formaldehyde detection at ppb levels, ACS Appl. Mater. Interfaces, 2016, 8(5), 3233–3240 CrossRef CAS PubMed.
- M.-S. Park, J. Kim, K. J. Kim, J.-W. Lee, J. H. Kim and Y. Yamauchi, Porous nanoarchitectures of spinel-type transition metal oxides for electrochemical energy storage systems, Phys. Chem. Chem. Phys., 2015, 17(46), 30963–30977 RSC.
- C. Lin, Y. Li, M. Yu, P. Yang and J. Lin, A facile synthesis and characterization of monodisperse spherical pigment particles with a core/shell structure, Adv. Funct. Mater., 2007, 17(9), 1459–1465 CrossRef CAS.
- K. Omata, T. Takada, S. Kasahara and M. Yamada, Active site of substituted cobalt spinel oxide for selective oxidation of COH2. Part II, Appl. Catal., A, 1996, 146(2), 255–267 CrossRef CAS.
- E. Kan, M. Li, S. Hu, C. Xiao, H. Xiang and K. Deng, Two-dimensional hexagonal transition-metal oxide for spintronics, J. Phys. Chem. Lett., 2013, 4(7), 1120–1125 CrossRef CAS PubMed.
- J.-M. Li, A. C. H. Huan, L. Wang, Y.-W. Du and D. Feng, Interface effects on magnetoresistance and magnetic-field-reduced Raman scattering in magnetite, Phys. Rev. B: Condens. Matter Mater. Phys., 2000, 61(10), 6876–6878 CrossRef CAS.
- L. Wang, J. Li, W. Ding, T. Zhou, B. Liu, W. Zhong, J. Wu and Y. Du, Magnetoelectric transport properties of quenched polycrystalline magnetite, J. Magn. Magn. Mater., 1999, 207(1), 111–117 CrossRef CAS.
- Y. Qiu, S. Yang, H. Deng, L. Jin and W. Li, A novel nanostructured spinel ZnCo2O4 electrode material: morphology conserved transformation from a hexagonal shaped nanodisk precursor and application in lithium ion batteries, J. Mater. Chem., 2010, 20(21), 4439–4444 RSC.
- S. Vijayanand, P. A. Joy, H. S. Potdar, D. Patil and P. Patil, Nanostructured spinel ZnCo2O4 for the detection of LPG, Sens. Actuators, B, 2011, 152(1), 121–129 CrossRef CAS.
- T. W. Kim, M. A. Woo, M. Regis and K.-S. Choi, Electrochemical synthesis of spinel type ZnCo2O4 electrodes for use as oxygen evolution reaction catalysts, J. Phys. Chem. Lett., 2014, 5(13), 2370–2374 CrossRef CAS PubMed.
- H. Guo, J. Chen, W. Weng, Q. Wang and S. Li, Facile template-free one-pot fabrication of ZnCo2O4 microspheres with enhanced photocatalytic activities under visible-light illumination, Chem. Eng. J., 2014, 239, 192–199 CrossRef CAS.
- S. Wang, Z. Ding and X. Wang, A stable ZnCo2O4 cocatalyst for photocatalytic CO2 reduction, Chem. Commun., 2015, 51(8), 1517–1519 RSC.
- F.-L. Schein, H. von Wenckstern, H. Frenzel and M. Grundmann, ZnO-Based n-Channel Junction Field-Effect Transistor With Room-Temperature-Fabricated Amorphous p-Type ZnCo2O4 Gate, IEEE Electron Device Lett., 2012, 33(5), 676–678 CAS.
- B. Henne, V. Ney, K. Ollefs, F. Wilhelm, A. Rogalev and A. Ney, Magnetic interactions in the ZnCoO system: tuning local structure, valence and carrier type from extremely Co doped ZnO to ZnCo2O4, Sci. Rep., 2015, 5, 16863 CrossRef CAS PubMed.
- P. Sati, C. Deparis, C. Morhain, S. Schäfer and A. Stepanov, Antiferromagnetic interactions in single crystalline Zn1−xCoxO thin films, Phys. Rev. Lett., 2007, 98(13), 137204 CrossRef CAS PubMed.
- X. Wen, Z. Chen, E. Liu and X. Lin, Structural and magnetic characterization of ZnCo2O4 thin film prepared by pulsed laser deposition, Appl. Surf. Sci., 2015, 357, 1212–1216 CrossRef CAS.
- T. Kammermeier, V. Ney, S. Ye, K. Ollefs, T. C. Kaspar, S. A. Chambers, F. Wilhelm, A. Rogalev and A. Ney, Element specific measurements of the structural properties and magnetism of CoxZn1−xO, J. Magn. Magn. Mater., 2009, 321(7), 699–701 CrossRef CAS.
- R. Khan, C. I. L. de Araujo, T. Khan, A. Khan, B. Ullah and S. Fashu, Influence of oxygen vacancies on the structural, dielectric, and magnetic properties of (Mn, Co) co-doped ZnO nanostructures, J. Mater. Sci.: Mater. Electron., 2018, 29(12), 9785–9795 CrossRef CAS.
- S.-g. Kang, Y. Kim, S. E. Kim and S. Kim, The effects of heat treatment on room temperature ferromagnetism in a digitally Co doped ZnO thin film, Electron. Mater. Lett., 2013, 9(1), 7–11 CrossRef CAS.
- M. Shatnawi, A. M. Alsmadi, I. Bsoul, B. Salameh, M. Mathai, G. Alnawashi, G. M. Alzoubi, F. Al-Dweri and M. S. Bawa’aneh, Influence of Mn doping on the magnetic and optical properties of ZnO nanocrystalline particles, Results Phys., 2016, 6, 1064–1071 CrossRef.
- H. J. Kim, I. C. Song, J. H. Sim, H. Kim, D. Kim, Y. E. Ihm and W. K. Choo, Electrical and magnetic properties of spinel-type magnetic semiconductor ZnCo2O4 grown by reactive magnetron sputtering, J. Appl. Phys., 2004, 95(11), 7387–7389 CrossRef CAS.
- M. Baskey, R. Maiti, S. Kumar Saha and D. Chakravorty, Superior magnetic, dielectric, and magnetodielectric effects in graphene/ZnCo2O4 nanocomposites, J. Appl. Phys., 2014, 115(9), 094306 CrossRef.
- J. H. Kim, H. Kim, D. Kim, Y. E. Ihm and W. K. Choo, Magnetoresistance in laser-deposited Zn1−xCoxO thin films, Phys. B, 2003, 327(2–4), 304–306 CrossRef CAS.
- H. J. Kim, I. C. Song, J. H. Sim, H. Kim, D. Kim, Y. E. Ihm and W. K. Choo, Growth and characterization of spinel-type magnetic semiconductor ZnCo2O4 by reactive magnetron sputtering, Phys. Status Solidi B, 2004, 241(7), 1553–1556 CrossRef CAS.
- N. H. Perry, T. O. Mason, C. Ma, A. Navrotsky, Y. Shi, J. S. Bettinger, M. F. Toney, T. R. Paudel, S. Lany and A. Zunger, Co3O4–Co2ZnO4 spinels: The case for a solid solution, J. Solid State Chem., 2012, 190, 143–149 CrossRef CAS.
- S. Maria and S. L. Cynthia, P-type zinc oxide spinels: application to transparent conductors and spintronics, New J. Phys., 2014, 16(5), 055011 CrossRef.
- D. S. Nikam, S. V. Jadhav, V. M. Khot, R. Bohara, C. K. Hong, S. S. Mali and S. Pawar, Cation distribution, structural, morphological and magnetic properties of Co1−xZnxFe2O4 (x = 0–1) nanoparticles, RSC Adv., 2015, 5(3), 2338–2345 RSC.
- N. Wiriya, A. Bootchanont, S. Maensiri and E. Swatsitang, Magnetic properties of Zn1−xMnxFe2O4 nanoparticles prepared by hydrothermal method, Microelectron. Eng., 2014, 126, 1–8 CrossRef CAS.
- L. Hao, Y. Zhao, Q. Jiao and P. Chen, Synthesis of zinc–nickel ferrite nanorods and their magnetic properties, RSC Adv., 2014, 4(30), 15650–15654 RSC.
- R. D. Shannon, Revised Effective Ionic Radii and Systematic Studies of Interatomic Distances in Halides and Chalcogenides, Acta Crystallogr., 1976, A32, 751 CrossRef CAS.
- M. Bouchard and A. Gambardella, Raman microscopy study of synthetic cobalt blue spinels used in the field of art, J. Raman Spectrosc., 2010, 41(11), 1477–1485 CrossRef.
- B. Hadžić, N. Romčević, M. Romčević, I. Kuryliszyn-Kudelska, W. D. Dobrowolski, U. Narkiewicz and D. Sibera, Raman study of surface optical phonons in ZnO (Co) nanoparticles prepared by hydrothermal method, Hem. Ind., 2013, 67(4), 695–701 CrossRef.
- K. K. Naik and C. S. Rout, Electrodeposition of ZnCo2O4 nanoparticles for biosensing applications, RSC Adv., 2015, 5(97), 79397–79404 RSC.
- C. Stella, N. Soundararajan and K. Ramachandran, Structural, optical, and magnetic properties of Mn and Fe-doped Co3O4 nanoparticles, AIP Adv., 2015, 5(8), 087104 CrossRef.
- L. Lu, S. Xu, Z. Luo, S. Wang, G. Li and C. Feng, Synthesis of ZnCo2O4 microspheres with Zn0.33Co0.67CO3 precursor and their electrochemical performance, J. Nanopart. Res., 2016, 18(7), 183 CrossRef.
- K. Garg, P. Nordblad, M. Heinonen, N. Panwar, V. Sen, F. Bondino, E. Magnano, E. Carleschi, F. Parmigiani and S. Agarwal, Study of Sb substitution for Pr in the Pr0.67Ba0.33MnO3 system, J. Magn. Magn. Mater., 2009, 321(4), 305–311 CrossRef CAS.
- J. Zheng, Q. Jiang and J. Lian, Synthesis and optical properties of flower-like ZnO nanorods by thermal evaporation method, Appl. Surf. Sci., 2011, 257(11), 5083–5087 CrossRef CAS.
- M. Ahmed, B. S. Mwankemwa, E. Carleschi, B. Doyle, W. E. Meyer and J. M. Nel, Effect of Sm doping ZnO nanorods on structural optical and electrical properties of Schottky diodes prepared by chemical bath deposition, Mater. Sci. Semicond. Process., 2018, 79, 53–60 CrossRef CAS.
- D. McNulty, H. Geaney and C. O'Dwyer, Carbon-coated honeycomb Ni–Mn–Co–O inverse opal: a high capacity ternary transition metal oxide anode for Li-ion batteries, Sci. Rep., 2017, 7, 42263 CrossRef CAS PubMed.
- T. H. Dolla, K. Pruessner, D. G. Billing, C. Sheppard, A. Prinsloo, E. Carleschi, B. Doyle and P. Ndungu, Sol-gel synthesis of MnxNi1−xCo2O4 spinel phase materials: Structural, electronic, and magnetic properties, J. Alloys Compd., 2018, 742, 78–89 CrossRef CAS.
- Q. Zhang, X. Liu, W. Fan and Y. Wang, Manganese-promoted cobalt oxide as efficient and stable non-noble metal catalyst for preferential oxidation of CO in H2 stream, Appl. Catal., B, 2011, 102(1–2), 207–214 CrossRef CAS.
- A. N. Naveen and S. Selladurai, Tailoring structural, optical and magnetic properties of spinel type cobalt oxide (Co3O4) by manganese doping, Phys. B, 2015, 457, 251–262 CrossRef CAS.
- A. Pendashteh, J. Palma, M. Anderson and R. Marcilla, Facile synthesis of NiCoMnO4 nanoparticles as novel electrode materials for high-performance asymmetric energy storage devices, RSC Adv., 2016, 6(34), 28970–28980 RSC.
- K. Sing, D. Everett, R. Haul, L. Moscou, L. Pierotti, J. Rouquerol and T. Siemieniewska, International union of pure and applied chemistry physical chemistry division reporting physisorption data for gas/soils systems with special reference to the determination of surface area and porosity, Pure Appl. Chem., 1985, 57, 603–619 CAS.
- S. Storck, H. Bretinger and W. F. Maier, Characterization of micro-and mesoporous solids by physisorption methods and pore-size analysis, Appl. Catal., A, 1998, 174(1–2), 137–146 CrossRef CAS.
- S. Yang and Y. Zhang, Structural, optical and magnetic properties of Mn-doped ZnO thin films prepared by sol–gel method, J. Magn. Magn. Mater., 2013, 334, 52–58 CrossRef CAS.
- D. P. Dutta, J. Manjanna and A. Tyagi, Magnetic properties of sonochemically synthesized CoCr2O4 nanoparticles, J. Appl. Phys., 2009, 106(4), 043915 CrossRef.
- S. Singh, P. Pramanik, S. Sangaraju, A. Mallick, L. Giebeler and S. Thota, Size-dependent structural, magnetic, and optical properties of MnCo2O4 nanocrystallites, J. Appl. Phys., 2017, 121(19), 194303 CrossRef.
- P. Pramanik, S. Thota, S. Singh, D. C. Joshi, B. Weise, A. Waske and M. Seehra, Effects of Cu doping on the electronic structure and magnetic properties of MnCo2O4 nanostructures, J. Phys.: Condens. Matter, 2017, 29(42), 425803 CrossRef PubMed.
- W. L. Roth, The magnetic structure of Co3O4, J. Phys. Chem. Solids, 1964, 25(1), 1–10 CrossRef CAS.
Footnote |
| † Electronic supplementary information (ESI) available. See DOI: 10.1039/c8ra08150f |
| This journal is © The Royal Society of Chemistry 2018 |