 Open Access Article
Interactions of a paracyclophane-based conjugated oligoelectrolyte with biological membranes†
Jakkarin Limwongyut a,
Yang Liuc,
Gayatri Shankar Chilambid,
Thomas Seviourd,
Jamie Hinksd,
Yuguang Muc and
Guillermo C. Bazan
 *abe
*abe
aCenter for Polymers and Organic Solids, Department of Chemistry and Biochemistry, University of California, Santa Barbara, CA 93106, USA. E-mail: bazan@chem.ucsb.edu
bMaterials Department, University of California, Santa Barbara, CA 93106, USA
cSchool of Biological Sciences, Nanyang Technological University, 637551, Singapore
dSingapore Centre on Environmental Life Sciences Engineering (SCELSE), Nanyang Technological University, 637551, Singapore
eSchool of Chemical and Biomedical Engineering, Nanyang Technological University, 637551, Singapore
First published on 29th November 2018
Abstract
A three-dimensional conjugated oligoelectrolyte (COE) bearing a [2.2]paracyclophane unit (COE2-3-pCp) was synthesized. Its biological activity was determined both in vivo and in silico within the context of membrane perturbation and biocompatibility. Molecular dynamics simulations indicate that, compared to its linear analog (COE2-3C), COE2-3-pCp introduces more lipid disorder with higher extent of membrane thinning. COE2-3-pCp also exhibits a higher MIC towards E. coli K12 and yeast, while maintaining similar levels of membrane permeabilization. These findings suggest a new design of COEs as biocompatible cell permeabilizers.
Introduction
Conjugated oligoelectrolytes (COEs) are defined by a conjugated backbone with ionic pendant groups tethered by hydrocarbon chains.1,2 COEs typically intercalate within microbial membranes in a well-organized fashion.3 Several molecular features are known to impact the extent of COE accumulation within cells and their effects on the membrane. For example, the degree to which the COEs intercalate within membranes depends on whether the charged groups are anionic or cationic.4 Additionally, the number of repeat units affects the distortion of the lipid bilayer and is a strong modulator of antimicrobial efficacy.5,6 Microbes with COEs have their properties and behaviour modified in ways that are desirable for specific applications. Consider, the homologous series of oligophenylenevinylene COEs illustrated by DSBN+, DSSN+ and COE1-5C (Scheme 1). While DSBN+ has a higher antimicrobial efficacy than DSSN+, both increase membrane permeability in E. coli K12. COE1-5C, in contrast, has been shown to rigidify membranes.5,7,8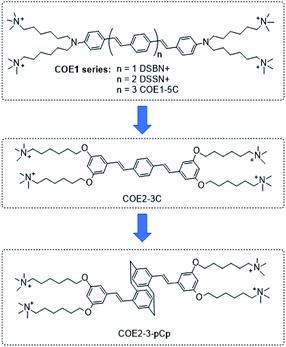 | ||
| Scheme 1 Structural evolution from the COE1 series to the paracyclophane-based COE (COE2-3-pCp). Iodide counterions are omitted from the structures. | ||
Oligophenylenevinylene COEs studied thus far largely contain a planar, two-dimensional conjugated fragment. A molecular structural variation that has yet to be considered concerns introducing dimensionality to the conjugated segment in order to understand possible repercussion of this structural modification on the reorganization of the membrane lipids and the overall perturbation of the bilayer. To accomplish this structural variation, we sought to include a rigid framework within the interior of the conjugated segment with an otherwise similar aspect ratio to phenylene unit. For this purpose, we chose the [2.2]paracyclophane (pCp) moiety. We hypothesized that three-dimensionality from the pCp adduct would increase lipid disorder in the membrane. The structural evolution is illustrated in Scheme 1.
We compared the properties of COE2-3-pCp to those of its linear counterpart COE2-3C by first carrying out molecular dynamics simulations to elucidate deformations and disorder within a model lipid bilayer structure. The results of the simulations provide a framework for understanding observed differences in the modification of E. coli K12 brought about by membrane modification with additional context provided by biophysical experiments with vesicles and cells. Of interest is the finding that while COE2-3-pCp has a lower minimum inhibitory concentration (MIC) relative to COE2-3C, it can induce similar levels of membrane permeabilization. Implications of increased permeabilization for whole-cell biocatalysis have been previously investigated using E. coli K12 and yeast.7,9,10
Results and discussion
The synthesis of COE2-3-pCp is shown in Scheme 2. 4,16-Dibromo[2.2]paracyclophane (1), a pseudo-para isomer of dibromo[2.2]paracyclophane, was used as the key starting material to maintain the overall linearity of the backbone. Compound 1 was converted into 2 by using s-BuLi, followed by addition of N,N-dimethylformamide (DMF). Formyl groups were then subjected to reduction and chlorination with sodium borohydride and thionyl chloride, respectively, to yield 4. The intermediate 5 was synthesized using triethyl phosphite. Precursor 7 was prepared under Horner–Wadsworth–Emmons (HWE) reaction conditions from 5 and 6. Finally, treatment of 7 with trimethylamine provides COE2-3-pCp. COE2-3C, which is the planar analogue of COE2-3-pCp, was synthesized according to reported protocols.2,6Absorption and fluorescence spectra of COE2-3-pCp are summarized in ESI (Fig. S1†). The UV-visible absorption spectrum of COE2-3-pCp in water shows three absorption peaks in the ultraviolet region, namely, 225 nm, 311 nm and a shoulder peak at 328 nm. The COE2-3-pCp fluorescence exhibits an emission maximum at 436 nm. The emission maximum exhibits a hypsochromic shift of 15 nm when treated with a solution of 1,2-dimyristoyl-sn-glycero-3-phosphocholine (DMPC) vesicles. In previous studies, it was shown that when COEs intercalate into lipid bilayers, fluorescence emission will shift to shorter wavelength due to the change of environment from a polar (water) to a non-polar (lipid tails) environment. Hence, the observed shift in the emission of COE2-3-pCp in the vesicles suggests that COE2-3-pCp similarly intercalates into lipid membranes.11
To validate intercalation into lipid bilayers in microbes, E. coli K12 was treated with COE2-3-pCp in 50 mM phosphate buffer saline (PBS) at the turbidity of OD600 = 1. After staining, cells were centrifuged at 7000 rpm for 7 minutes and the supernatant was collected for UV-visible absorption measurements revealing more than 90% association of COE2-3-pCp to E. coli K12 cells, even when [COE2-3-pCp] = 40 μM (Fig. 1a). Zeta potentials of cells and liposomes treated with COE2-3-pCp in 50 mM PBS were also measured (Fig. 1b and c). An increase in zeta potential should be observed when COEs intercalate into the bilayers. However, while an increase was observed for liposomes, little change occurred with the cells (Fig. 1b). The same observations were observed for COE2-3C with E. coli K12.12 A plausible reason underlying the relatively constant zeta potential with E. coli may be the presence of the lipopolysaccharide (LPS) layer. With the thickness of the LPS being around 2–3 nm in E. coli K12, the COE cationic groups may not be able to reach the surface of the cells after their intercalation into the lipid bilayer due to the molecular length of the COEs.12–14
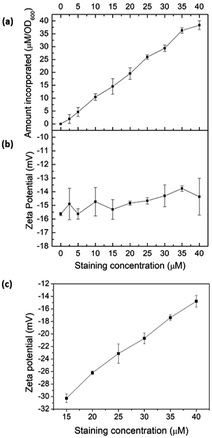 | ||
| Fig. 1 (a) COE2-3-pCp association to E. coli K12 cells; zeta potential of (b) E. coli K12, and (c) E. coli total lipid extract vesicles at different COE2-3-pCp staining concentrations. | ||
To verify COE2-3-pCp intercalation, we examined liposomes made of E. coli total lipid extract, which lacks the LPS layer. As shown in Fig. 1c, the zeta potential increased with COE2-3-pCp concentration, indicating intercalation into the bilayer. Finally, to visually illustrate COE uptake, fluorescence signals in cell suspensions were imaged using two-photon microscopy. The images clearly show the accumulation of COE on the cells (Fig. 2).
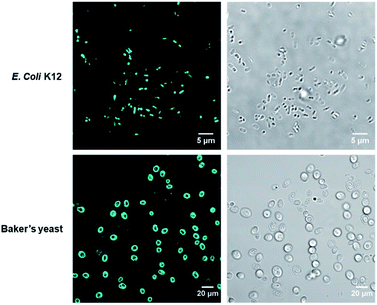 | ||
| Fig. 2 Two-photon micrographs of E. coli K12 and yeast treated with COE2-3-pCp from fluorescence channel (left) and brightfield channel (right). The excitation wavelength was 725 nm. | ||
Molecular dynamics (MD) simulations were undertaken on Gram-negative model membrane bilayer systems (3![[thin space (1/6-em)]](https://www.rsc.org/images/entities/char_2009.gif) :
:![[thin space (1/6-em)]](https://www.rsc.org/images/entities/char_2009.gif) 1 palmitoyloleoylphosphatidylethanolamine/palmitoyloleoylphospatidylglycerol, or POPE/POPG) doped with either COE2-3-pCp or COE2-3C (COE
1 palmitoyloleoylphosphatidylethanolamine/palmitoyloleoylphospatidylglycerol, or POPE/POPG) doped with either COE2-3-pCp or COE2-3C (COE![[thin space (1/6-em)]](https://www.rsc.org/images/entities/char_2009.gif) :
:![[thin space (1/6-em)]](https://www.rsc.org/images/entities/char_2009.gif) POPE
POPE![[thin space (1/6-em)]](https://www.rsc.org/images/entities/char_2009.gif) :
:![[thin space (1/6-em)]](https://www.rsc.org/images/entities/char_2009.gif) POPG = 4
POPG = 4![[thin space (1/6-em)]](https://www.rsc.org/images/entities/char_2009.gif) :
:![[thin space (1/6-em)]](https://www.rsc.org/images/entities/char_2009.gif) 110
110![[thin space (1/6-em)]](https://www.rsc.org/images/entities/char_2009.gif) :
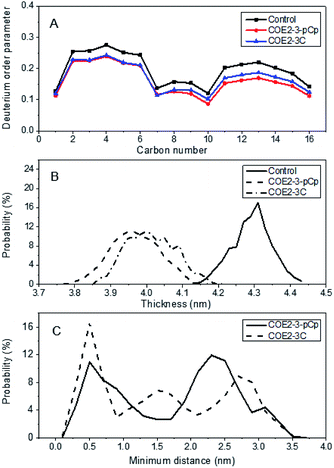
:![[thin space (1/6-em)]](https://www.rsc.org/images/entities/char_2009.gif) 36). Relative to COE2-3C, COE2-3-pCp induced a greater degree of disorder, as illustrated by the more pronounced reduction in deuterium order parameter along the first fatty acid chain (sn1) of POPE predicted for COE2-3-pCp (Fig. 3a). The same effect was observed on POPG for both the sn1 and sn2 (i.e. second fatty acid) chain (Fig. S3†).
36). Relative to COE2-3C, COE2-3-pCp induced a greater degree of disorder, as illustrated by the more pronounced reduction in deuterium order parameter along the first fatty acid chain (sn1) of POPE predicted for COE2-3-pCp (Fig. 3a). The same effect was observed on POPG for both the sn1 and sn2 (i.e. second fatty acid) chain (Fig. S3†).
This increased disorder observed for COE2-3-pCp relative to COE2-3C resulted in a greater reduction of the average bilayer thickness of the COE2-3-pCp-doped lipid bilayer (Fig. 3b). Earlier studies proposed that the COE length was a key parameter with regards to their antibiotic characteristics. Thus, antimicrobial activity was determined against E. coli K12 and yeast using broth microdilution method.15 All experiments were performed in triplicate (see ESI†). Specifically, the minimum inhibitory concentrations (MICs) of COE2-3-pCp on E. coli K12 and yeast are 64 μM and 128 μM, respectively, whereas those of COE2-3C are 16 μM and 64 μM, respectively. Modification of the COE by introducing a three-dimensional moiety decreased inhibitory action despite reduction of bilayer thickness. Hinks et al. attributed a reduction in antimicrobial activity of a fluorinated COE to increased range of movement of the COE pendant arm, which reduced the mechanical shock to the lipid bilayer. Another effect of this increased lability was reduced molecular aggregation within the bilayer and it is possible that this also contributed to attenuating COE2-3-pCp driven membrane disruption.5
According to the probability distribution for intermolecular distance between each COE pair in a four COE simulation (see ESI† for definition) (Fig. 3c), there was a 36% reduction in the duration that COE2-3-pCp molecules exist as an aggregate, relative to COE2-3C, as determined from an intermolecular distance of <0.5 nm. While introducing a non-planar aspect to the design of COEs may increase disorder, MD simulations indicate that the effect of this with regards to antimicrobial activity is most reasonably offset by reduced aggregation.
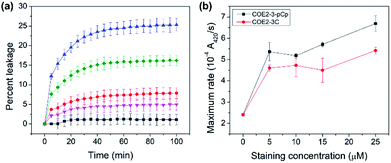
COE permeabilization ability was determined by calcein released from E. coli total lipid extract vesicles treated with the two COEs. At the COE amount of 2.5 mol% relative to lipids, COE2-3-pCp induced leakage up to 25% in 100 minutes, while COE2-3C induced 16% within the same timeframe (Fig. 4a). This supports the hypothesis that COE2-3-pCp has a potential to be a more effective membrane permeabilizer.
The impact of COEs on whole-cell biocatalysis was investigated using E. coli K12 hydrolysis of o-nitrophenyl β-D-galactopyranoside (ONPG) by β-galactosidase.16,17 Cells treated with COEs show increased catalytic rates. Turnover rates are 2.8 and 2.3-fold faster than untreated cells upon treatment with 25 μM COE2-3-pCp and COE2-3C, respectively (Fig. 4b). With the higher MIC of COE2-3-pCp compared to COE2-3C toward E. coli K12, the degree to which association with COEs impacts cell viability can thus be decoupled from the ability to permeabilize the membrane. Such an observation is surprising since these two properties usually follow the same trend.18
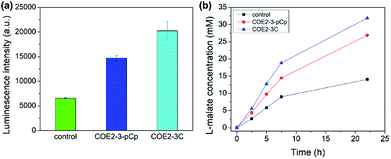
The membrane permeabilization effect was also tested with yeast. Relative extracellular ATP levels were used as an indicator of permeabilization as previously described.19 The amount of ATP in the supernatant is directly proportional to the observed luminescence signal from the luciferase–luciferin system. Yeast treated with 100 μM of COEs show higher extracellular ATP than control, indicating permeabilization (Fig. 5a).
The enantioselective hydration of fumarate by fumarase was then chosen for a model system to monitor biocatalysis, as the turnover rate can be accelerated by increasing permeability.20 Yeast cells were treated with 25 μM COEs per 0.1 g wet cells. Cells with COE2-3-pCp show significant catalytic acceleration from untreated cells at comparable degree to those treated with COE2-3C (Fig. 5b). Despite the slightly higher permeabilizing efficacy of COE2-3-pCp on E. coli, COE2-3-pCp is slightly less effective with yeast. Such differences may be related to the differences in membrane composition, but a more precise mechanistic rationale requires further work.
Conclusions
In summary, the paracyclophane-based COE2-3-pCp was designed and synthesized. Despite its similar length and cell association profile to its linear counterpart COE2-3C, COE2-3-pCp exhibits a higher MIC towards E. coli K12 and yeast. Moreover, COE2-3-pCp permeabilizes lipid bilayers to a similar extent as COE2-3C and thus improves biocatalysis processes in both microorganisms relative to untreated cells. In contrast to the higher MIC of COE2-3-pCp compared to COE2-3C, MD simulation suggests the pCp unit introduces more lipid disorder with higher extent of membrane thinning. Perhaps more surprisingly, the general molecular topology of COE2-3-pCp reduces the tendency to form aggregates in the membrane. To what degree self-association of COEs within the membrane impacts their ability to reduce cell viability remains an open question right now due to the absence of relevant experimental techniques. These insights hint to the strategic design of new COEs to manipulate intermolecular interactions that attenuate growth inhibition, while inducing permeabilization—findings that are relevant within the context of whole-cell biocatalysis.Conflicts of interest
There are no conflicts to declare.Acknowledgements
This work was supported by the Institute of Collaborative Biotechnologies through grant W911NF-09-0001 from the U.S. Army Research Office. We acknowledged the use of NRI-MCDB Microscopy Facility and the Multiphoton/Laser Scanning Confocal supported by the NCRR under Award # 1S10RR022585-01A1. SCELSE is funded by Singapore's National Research Federation, Ministry of Education, Nanyang Technological University (NTU), and National University of Singapore (NUS) and hosted by NTU in partnership with NUS. The work at SCELSE was supported by Singapore Ministry of Education through grant M4360005. J. L. is grateful for DPST fellowship from the Institute for the Promotion of Teaching Science and Technology, Thailand.Notes and references
- Y. Wang, Y. Tang, Z. Zhou, E. Ji, G. P. Lopez, E. Y. Chi, K. S. Schanze and D. G. Whitten, Langmuir, 2010, 26, 12509–12514 CrossRef CAS PubMed.
- H. Hou, X. Chen, A. W. Thomas, C. Catania, N. D. Kirchhofer, L. E. Garner, A. Han and G. C. Bazan, Adv. Mater., 2013, 25, 1593–1597 CrossRef CAS PubMed.
- H. Yan, C. Catania and G. C. Bazan, Adv. Mater., 2015, 27, 2958–2973 CrossRef CAS PubMed.
- A. W. Thomas, C. Catania, L. E. Garner and G. C. Bazan, Chem. Commun., 2015, 51, 9294–9297 RSC.
- J. Hinks, Y. Wang, W. H. Poh, B. C. Donose, A. W. Thomas, S. Wuertz, S. C. J. Loo, G. C. Bazan, S. Kjelleberg, Y. Mu and T. Seviour, Langmuir, 2014, 30, 2429–2440 CrossRef CAS PubMed.
- H. Yan, Z. D. Rengert, A. W. Thomas, C. Rehermann, J. Hinks and G. C. Bazan, Chem. Sci., 2016, 7, 5714–5722 RSC.
- C. Catania, C. M. Ajo-Franklin and G. C. Bazan, RSC Adv., 2016, 6, 100300–100306 RSC.
- J. Hinks, Y. Wang, A. Matysik, R. Kraut, S. Kjelleberg, Y. Mu, G. C. Bazan, S. Wuertz and T. Seviour, ChemSusChem, 2015, 8, 3718–3726 CrossRef CAS PubMed.
- R. F. Epand, J. E. Pollard, J. O. Wright, P. B. Savage and R. M. Epand, Antimicrob. Agents Chemother., 2010, 54, 3708–3713 CrossRef CAS PubMed.
- A. V. Presečki, B. Zelić and D. Vasić-Rački, Enzyme Microb. Technol., 2007, 41, 605–612 CrossRef.
- L. E. Garner, J. Park, S. M. Dyar, A. Chworos, J. J. Sumner and G. C. Bazan, J. Am. Chem. Soc., 2010, 132, 10042–10052 CrossRef CAS PubMed.
- C. Catania, A. W. Thomas and G. C. Bazan, Chem. Sci., 2016, 7, 2023–2029 RSC.
- M. Kastowsky, T. Gutberlet and H. Bradaczek, J. Bacteriol., 1992, 174, 4798–4806 CrossRef CAS PubMed.
- Q. Lu, J. Wang, A. Faghihnejad, H. Zeng and Y. Liu, Soft Matter, 2011, 7, 9366 RSC.
- I. Wiegand, K. Hilpert and R. E. W. Hancock, Nat. Protoc., 2008, 3, 163–175 CrossRef CAS PubMed.
- R. E. Huber, G. Kurz and K. Wallenfels, Biochemistry, 1976, 15, 1994–2001 CrossRef CAS PubMed.
- H. E. Mostafa, K. J. Heller and A. Geis, Appl. Environ. Microbiol., 2002, 68, 2619–2623 CrossRef CAS PubMed.
- C. C. C. R. de Carvalho, Microb. Biotechnol., 2017, 10, 250–263 CrossRef PubMed.
- F. Zaknoon, H. Sarig, S. Rotem, L. Livne, A. Ivankin, D. Gidalevitz and A. Mor, Antimicrob. Agents Chemother., 2009, 53, 3422–3429 CrossRef CAS PubMed.
- A. V. Presečki and D. Vasić-Rački, Biotechnol. Lett., 2005, 27, 1835–1839 CrossRef PubMed.
Footnote |
| † Electronic supplementary information (ESI) available: Experimental procedures, absorption and emission spectra, and NMR spectra. See DOI: 10.1039/c8ra08069k |
| This journal is © The Royal Society of Chemistry 2018 |


