 Open Access Article
Self-assembled hierarchical porous NiMn2O4 microspheres as high performance Li-ion battery anodes†
Shuang Zhao,
Honglei Li,
Zhixu Jian,
Yalan Xing* and
Shichao Zhang *
*
School of Materials Science and Engineering, Beihang University, Beijing 100191, PR China. E-mail: csc@buaa.edu.cn; Fax: +86 01082338148; Tel: +86 01082339319
First published on 13th December 2018
Abstract
Hierarchical structured porous NiMn2O4 microspheres assembled with nanorods are synthesized through a simple hydrothermal method followed by calcination in air. As anode materials for lithium ion batteries (LIBs), the NiMn2O4 microspheres exhibit a high specific capacity. The initial discharge capacity is 1126 mA h g−1. After 1000 cycles, the NiMn2O4 demonstrates a reversible capacity of 900 mA h g−1 at a current density of 500 mA g−1. In particular, the porous NiMn2O4 microspheres still could deliver a remarkable discharge capacity of 490 mA h g−1 even at a high current density of 2 A g−1, indicating their potential application in Li-ion batteries. This excellent electrochemical performance is ascribed to the unique hierarchical porous structure which can provide sufficient contact for the transfer of Li+ ion and area for the volume change of the electrolyte leading to enhanced Li+ mobility.
Introduction
The development of sustainable new energy sources is considered as a feasible solution to solve the energy crisis and global environmental pollution.1–3 Lithium-ion batteries (LIBs) with high power density, high output voltage and low environmental pollution, show superior performance to traditional secondary batteries and have been widely used in portable mobile electronic devices and power vehicles.4–7 However, the specific capacity of current commercial lithium-ion batteries is still stuck at a low level and fail to satisfy the demands of large-scale applications. Therefore, it is necessary to develop new electrode materials with high reversible specific capacity, high rate performance and long cycle life to meet the greater demand for high energy density LIBs.8–12Compared with traditional graphite anode materials, transition metal oxides (TMOs) have higher theoretical specific capacity (700–900 mA h g−1) and better specific power characteristics, which can meet the energy density needs of power batteries.13,14 Moreover, owing to their lower voltage and higher energy density, binary manganese-based composite metal oxide anode materials such as ZnMn2O4, NiMn2O4, and CoMn2O4 have attracted enormous attention.15–18 Wang et al. fabricated a novel ZnMn2O4/N-doped graphene (ZMO/NG) nanohybrid with a sandwiched structure which exhibits a specific capacity of 747 mA h g−1 after 200 cycles at 500 mA g−1.19 Zhang et al. obtained pure phase ZnMn2O4 samples sandwiched via a combustion assisted coprecipitation method with a specific capacity of 716 mA h g−1 after 90 cycles at 100 mA g−1.20 Hu et al. fabricated the spinel CoMn2O4 hierarchical mesoporous microspheres with a specific capacity of 894 mA h g−1 after 65 cycles at 100 mA g−1.21 Wang and his team developed a NiMn2O4/C array of sandwich structures on Ni foil by a simple hydrothermal reaction, and obtained a NiMn2O4 composite with excellent performance as a negative electrode of a lithium ion battery at a current density of 500 mA g−1. After 200 cycles, the ultra-high specific capacity of 1346 mA h g−1 was maintained.22 Ma et al. obtained a superior NiMn2O4 based anode material by incorporating Fe into NiMn2O4, and maintained 620 mA h g−1 after circulating 250 times at a current density of 200 mA g−1 as the negative electrode for a lithium ion battery.23
Among the manganese-based binary oxides, spinel-structured NiMn2O4 with the advantages of abundant resources and environmental benignancy shows potential commercial application in Li-ion batteries.24 Moreover, the synergistic effects of Ni2+ and Mn3+ during cycling also provide a high specific capacity (922 mA h g−1), and the electrochemical reaction of the NiMn2O4 electrode is as follows:25–28
| NiMn2O4 + 8Li+ + 8e− → Ni + 2Mn + 4Li2O | (1) |
| Ni + Li2O → NiO + 2Li+ + 2e− | (2) |
| Mn + Li2O → MnO + 2Li+ + 2e− | (3) |
| 2MnO + 1/3Li2O → 1/3Mn3O4 + 3Li+ + 2/3e− | (4) |
Although the NiMn2O4 electrode material has so many advantages, it still possesses poor conductivity and large volume changes during the charging and discharging processes as an anode material for LIBs.29,30 The insertion/extraction of lithium ions generates huge volume changes during cycling which lead to serious pulverization and agglomeration of the anode materials and reduce the contact area between the active material and the electrolyte. Thus, the design of NiMn2O4 oxides with a unique hierarchical porous structure are considered to be essential to mitigate the volume change and to solve the above problems.
Herein, we first synthesized novel hierarchical porous NiMn2O4 microspheres by a one-step hydrothermal reaction and subsequent heat treatment with KMn2O4 as the manganese source. As a LIB anode material, the NiMn2O4 microspheres exhibit a high specific capacity. The initial discharge capacity is 1126 mA h g−1 and after 1000 cycles, the specific capacity is 900 mA h g−1. In particular, the porous NiMn2O4 microspheres could still deliver a remarkable discharge capacity of 490 mA h g−1 even at a high current density of 2 A g−1, indicating considerable potential application in high energy density Li-ion batteries.
Results and discussion
The Ni–Mn precursor was obtained with the simple hydrothermal method. The bottom curve of Fig. 1a shows XRD patterns of the Ni–Mn precursor. It can be seen that the precursor's crystallinity is poor and the diffraction peaks are not correspond to any nickel or manganese compound. It indicates that the precursor is not a spinel-type NiMn2O4. Heat treatment is necessary to obtain spinel-type NiMn2O4. The DTG/TG (Fig. 1b) analysis of the precursor (under an air atmosphere) shows that the precursor has two distinct exothermic peaks at 500 °C and 790 °C with the weight reduction. According to the curve, it can be inferred that some exothermic reaction occurs in the vicinity of these two temperatures, corresponding to the formation or transformation of the crystal structure. Therefore, the precursor was calcined at 600 and 800 °C in an air atmosphere to obtain the products NMO-600 and NMO-800. XRD (Fig. 1a) analysis proves that NMO-600 contains a variety of nickel–manganese oxides, such as NiMnO3 (JCPDS 65-3695), MnO2 (JCPDS 44-0141) etc.; while the diffraction peak of NMO-800 corresponds to the peak on the standard card of NiMn2O4 (JCPDS 36-0083). It indicates that the precursor can be converted to NiMn2O4 at a calcination temperature of 800 °C, but not at 600 °C. Therefore, the exothermic peak and mass drop at 790 °C on the DSC/TG curve correspond to the formation of spinel structure, while the peak near 500 °C corresponds to the transformation of multiphase material, but fails to form a spinel structure NiMn2O4. | ||
| Fig. 1 (a) The XRD pattern of the as-prepared NMO-0, NMO-600, and ZMO-800. (b) DSC/TG curve of the precursor of Ni–Mn. | ||
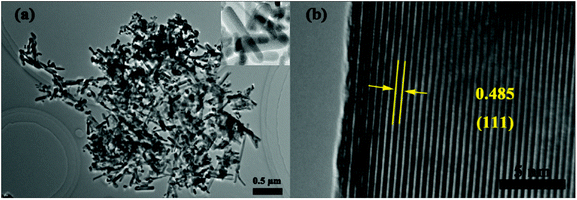
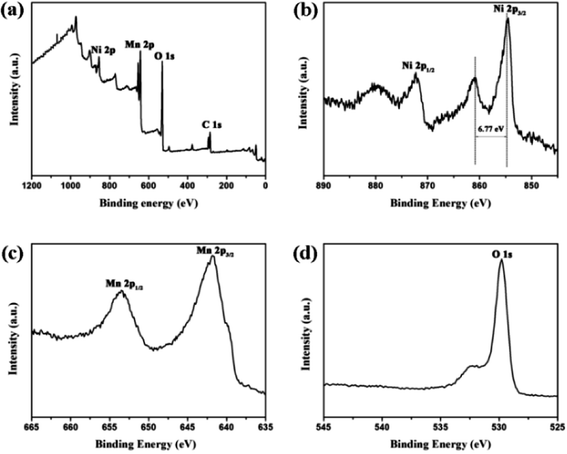
Fig. 2 displays the SEM image of the precursor and NMO-800. Fig. S1† shows the SEM image of the NMO-600. It can be seen that the precursor and the NMO-600 have the hierarchical porous microsphere structure, the NMO-800 are hierarchical porous microspheres composed of nanorods with a diameter in the range of 4–5 μm. The elemental mapping of O, Mn and Ni depicted in Fig. 2c shows the uniform distribution of all elements in the microspheres. The structure will provide space for volume expansion during deintercalation of lithium and increase the contact area between the electrode and the electrolyte. Meanwhile, the nanorods will shorten the diffusion distance of lithium ions in the active material and improve its conductivity. The hierarchical porous microsphere structure of NMO-800 was further confirmed by the TEM observation. Moreover, the TEM image (Fig. 3a) indicates that the interior of the microspheres is also porous. The HRTEM image (Fig. 3b) shows that the lattice fringe spacing is 0.485 nm, which corresponds to the (111) plane of the spinel NiMn2O4 phase. The uniformity of lattice fringes indicates that the porous NiMn2O4 microsphere has a high crystallinity. The oxidation state of the corresponding transition metal ions in the obtained sample was further investigated by X-ray photoelectron spectroscopy (XPS). The survey spectrum (Fig. 4a) confirms the presence of Ni, Mn and O elements and the C 1s (284.79 eV) peak is used as a standard peak. By magnifying the area corresponding to each element, we further understand the atomic state of each element in NMO-800. The Ni 2p spectrum is shown in Fig. 4b, and the three peaks in the spectrum are 2p1/2, 2p3/2, and the satellite peaks of 2p3/2 of Ni atoms, respectively. Among them, the difference of 2p3/2 and its satellite peaks characterizes the degree of electron hybridization of p orbital and 3d orbital in Ni atom, and the difference of 6.77 eV indicates that Ni element exists in divalent form.31 In the Mn 2p spectrum (Fig. 4c), the two peaks located at 653.5 eV and 641.8 eV are correspond to the Mn 2p1/2 and Mn 2p3/2 orbitals, respectively, with the difference of 11.7 eV, which is consistent with the previous literature. It indicates that the Mn element exists in the form of trivalent. The O 1s (Fig. 4d) which have been splitted into two different valence states: one peak at 529.7 eV is due to the typical metal–oxygen bonds, while the other broad peaks at 529–533 eV are due to the lattice oxygen in the spinel NiMn2O4 (530.8 eV) and the surface adsorbed oxygen (531.8 eV).32,33
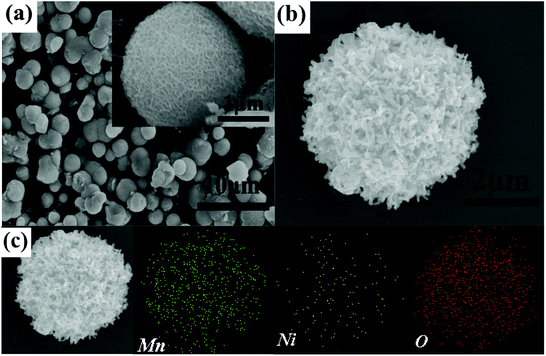 | ||
| Fig. 2 SEM images of (a) NMO-0, (b) NMO-800 and (c) the elemental mapping of Ni, Mn and O of NMO-800. | ||
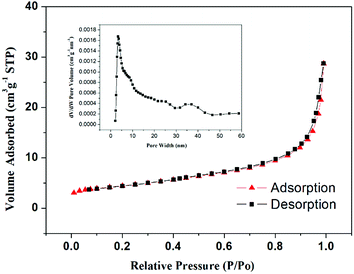
The nitrogen desorption experiment was used to characterize the specific surface area and the pores size distribution, the results are shown in Fig. 5. The BET results indicate that it has a specific surface area of 15.6 m2 g−1 and a specific pore volume of 0.044 cm3 g−1; the BJH pore size distribution indicates that the pore size is mainly concentrated at 2 to 50 nm. These pore structures will provide a buffer space for the volume expansion of the electrode during charge and discharge, and increase the contact area between the electrolyte and the active material, thereby reducing the lithium ion diffusion distance and improving its cycle performance and rate performance.
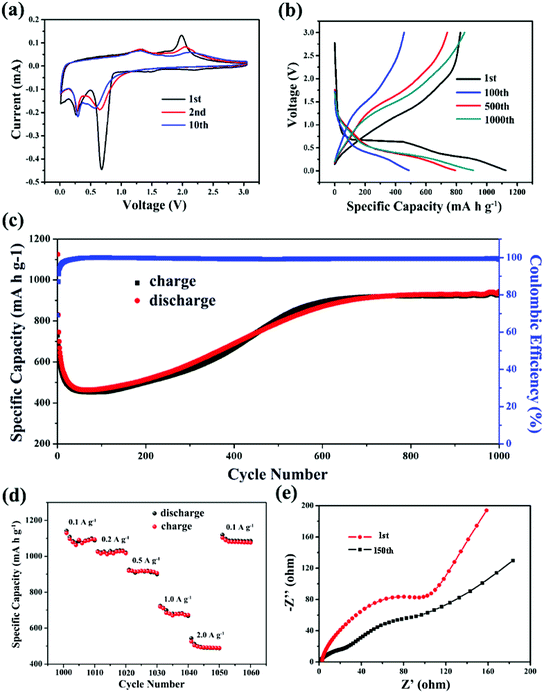
The electrochemical performance of the NMO-800 as anode materials for LIBs was investigated by cyclic voltammetry (CV). The results are shown in Fig. 6a, including cyclic voltammetry curves of the 1st, 2nd, and 10th. In the first cycle, there are three peaks. The broad peak centered at 1.3 V, which can be attributed to the reduction of Mn3+ to Mn2+. The reduction peak located at ∼0.70 V is ascribed to the reduction of Ni2+ to Ni, and may along with the formation of solid electrolyte interface film; the reduction peak located at ∼0.25 V is ascribed to the reduction of Mn2+ to Mn.
The three reduction reactions of the first cycle is accompanied by the lithium-ion embedding to form Li2O and the formation Ni and Mn metal. There are two oxidation peaks at 1.26 V and 1.92 V, respectively. The broad oxidation peak at ∼1.26 V is ascribed to the oxidation of Mn to MnO, accompanied by desorption of Li+; the relatively sharp oxidation peak at ∼1.92 V is ascribed to the oxidation of Ni to NiO, accompanied by the desorption of Li+. The delithiation potential of the negative electrode directly affects the output voltage of the lithium ion battery, thereby affecting its energy density. The higher the negative electrode potential, the lower the energy density. The delithiation potential of NiO as a negative electrode of a lithium ion battery is about 2.3 V. In comparison, the delithiation potential of about 1.92 V of NiO formed in NMO-800 clearly means a higher energy density.34 In the following cycles, the reduction peak near 1.5 V in the first cycle disappears, because of the disappearance of Mn3+, while the other redox peaks are coincide with the peak position of the first cycle, indicating that NMO-800 has good cycle stability. Based on the above CV analysis, we confirmed the electrochemical reactions for the NiMn2O4 electrode as a negative electrode of a lithium ion battery.
Fig. 6b shows the typical charge and discharge curves of NMO-800 at a current density of 500 mA h g−1 between 0.01–3.0 V. In the first discharge process, the voltage plateau at about 0.70 V and 0.25 V, which are consistent with the CV curve and corresponds to the reduction of NiO and MnO, respectively. The initial discharge capacity is 1126 mA h g−1 with a coulombic efficiency (CE) of 74%. The extra capacity could be attributed to the irreversible capacity originated from the decomposition of the solvent in the electrolyte solution and the formation of a solid electrolyte interphase (SEI) layer.22,35 And the capacity lost is attributed to the formation of solid electrolyte interface film (SEI).
As shown in Fig. 6c, at the subsequent charge and discharge cycles, the coulombic efficiency begins to rise, but its specific capacity decreases rapidly. Until to the 40th cycle, it has dropped to 460 mA h g−1. The specific capacity eventually stabilize around the 600th cycle, which reaches above 900 mA h g−1. This phenomenon may be mainly due to the activation mechanism of the electrode during the cycles. First, the SEI film is continuously formed on the new surfaces generated by the volume change, which could affect the lithium storage and lead to capacity fading at an early stage. After the further charging and discharging, the structure of binary metal oxides are reconstructed with SEI films tending to be stable, and the electrolyte gradually penetrates into the inner part of the active materials, which contribute to the increased charge–discharge capacity and superior cycle performance.33,36 After 1000 cycles, the capacity reaches a stable capacity of 900 mA h g−1, which is close to the theoretical specific capacity of NiMn2O4, indicating that the active material of NMO-800 is almost not destroyed during the cycles. This may be attributed to the hierarchical porous structure and the mutual support between Ni, Mn and their oxides formed after the cycles, which together alleviate the volume change of the metal oxide during charge and discharge process, thus the protective electrode is not destroyed. Fig. S2† shows the cycling performance of NMO-600 at a current density of 500 mA g−1. It can be seen that the stable specific capacity is about 600 mA h g−1 which is less than NMO-800, indicating that NM0-800 has an excellent performance.
Fig. 6d shows the cycling behavior of the as-prepared NMO-800 at different current densities of 0.1, 0.2, 0.5, 1.0, 2.0, 0.1 A g−1. The specific capacity changes from 1090 mA h g−1 to 490 mA h g−1. Finally the specific capacity revert to above 1000 mA h g−1, which indicates a good rate cycling. The above results prove that NMO-800 has excellent rate performance and structural stability.
In order to investigate the conductivity of the NMO-800 electrode, we conducted an AC impedance test. The Nyquist plot is shown in Fig. 6e. The figure shows the Nyquist curve of NMO after the first and the 150th cycle. At the first cycle, the semicircle of the high frequency region represents the charge transfer resistance of the electrode, and the oblique line of the low frequency region is related to the diffusion of lithium ions in the electrode. It can be seen that the NMO-800 electrode has a small charge transfer resistance, which may be due to the NMO-800's nano composition. The NMO-800's surface is activated because of nano effect, so that the charge is easy to transfer. Through further analysis, we find that the charge transfer resistance of the electrode after the 150th cycle is smaller than that the first cycle, which may be attributed to the change of the electrode active material after the charge and discharge, resulting in the change of the structure and the electrode surface state with the electrode electrochemical activated.26
Conclusions
Hierarchical porous NiMn2O4 microspheres are synthesized through a simple hydrothermal method and subsequent calcination with a new manganese source (KMnO4). The structure will provide space for volume expansion during deintercalation of lithium and increase the contact area between the electrode and the electrolyte. At the same time, the nanorods will shorten the diffusion distance of lithium ions in the active material and improve its conductivity. Therefore NMO-800 shows a high specific capacity of 900 mA h g−1 retained after 600 cycles at 500 mA g−1 and a good rate performance. The hierarchical porous material could be coated with carbon to further improve the performance of the material and be promising to be used as an anode for next generation LIBs.Experimental
Preparation of materials
Structural and morphological characterization
Differential scanning calorimetry thermogravimetric (DSC/TG) curves were obtained in air at a heating rate of 10 °C min−1 using a NETZSCH STA 449C thermal analyzer. The crystal phase composition of the product was analyzed by X-ray diffraction (XRD, Rigaku D/Max-2400) with an energy dispersive spectrometer (EDS) using CuKα radiation. Transmission electron microscopy (TEM, JEM-2100F), and high resolution transmission electron microscopy (HR-TEM, FEI, Tecnai G2 F20). And the atomic information in the crystal was collected to X-ray photoelectron spectroscopy (XPS, Thermo VG ESCALAB 250), Raman microscope (voltage: 100–240 V, power: 150 W; RENISHAW Invia, UK), BET surface-area and pore-size analyzer (Quantachrome Autosorb-6B).Cell assembly and electrochemical measurements
![[thin space (1/6-em)]](https://www.rsc.org/images/entities/char_2009.gif) :
:![[thin space (1/6-em)]](https://www.rsc.org/images/entities/char_2009.gif) 1
1![[thin space (1/6-em)]](https://www.rsc.org/images/entities/char_2009.gif) :
:![[thin space (1/6-em)]](https://www.rsc.org/images/entities/char_2009.gif) 1, and after fully grinding in the mortar, the powder is transferred to a small weighing bottle and was stirred with the solvent N-methylpyrrolidone (NMP) for 30 minutes to obtain a slurry, and the slurry was uniformly coated on a copper foil. It was then dried under vacuum at 80 °C for 12 hours. Finally, the copper foil coated with the active material was cut into a disc with a diameter of 1 cm.
1, and after fully grinding in the mortar, the powder is transferred to a small weighing bottle and was stirred with the solvent N-methylpyrrolidone (NMP) for 30 minutes to obtain a slurry, and the slurry was uniformly coated on a copper foil. It was then dried under vacuum at 80 °C for 12 hours. Finally, the copper foil coated with the active material was cut into a disc with a diameter of 1 cm.![[thin space (1/6-em)]](https://www.rsc.org/images/entities/char_2009.gif) :
:![[thin space (1/6-em)]](https://www.rsc.org/images/entities/char_2009.gif) 1, by volume). The battery was discharged and charged using a NWEARE BTS-610 tester, and a cyclic voltammetry (CV) test was performed using a CHI 660D electrochemical workstation at a scan rate of 0.1 mV s−1, both having a potential range of 0.01–3.0 V vs. Li+/Li. Electrochemical impedance spectroscopy (EIS) was performed at the open circuit voltage by the Zahner IM6e electrochemical workstation, and the frequency range of the electrochemical workstation ranges from 10 MHz to 10 mHz. All of the above electrochemical tests were carried out at room temperature.
1, by volume). The battery was discharged and charged using a NWEARE BTS-610 tester, and a cyclic voltammetry (CV) test was performed using a CHI 660D electrochemical workstation at a scan rate of 0.1 mV s−1, both having a potential range of 0.01–3.0 V vs. Li+/Li. Electrochemical impedance spectroscopy (EIS) was performed at the open circuit voltage by the Zahner IM6e electrochemical workstation, and the frequency range of the electrochemical workstation ranges from 10 MHz to 10 mHz. All of the above electrochemical tests were carried out at room temperature.Conflicts of interest
There are no conflicts to declare.Acknowledgements
This work was supported by National Natural Science Foundation of China (51575030 and 51774017), Beijing Natural Science Foundation (2174075), Key Program of Equipment Pre-Research Foundation of China (6140721020103) and Scientific Research Foundation of SGCC (52170217000L).Notes and references
- K. Amine, R. Kanno and Y. Tzeng, MRS Bull., 2014, 39, 395–401 CrossRef CAS.
- J. B. Goodenough and Y. Kim, J. Power Sources, 2011, 196, 6688–6694 CrossRef CAS.
- J. Xu, S. Dou, H. Liu and L. Dai, Nano Energy, 2013, 2, 439–442 CrossRef CAS.
- J. B. Goodenough and Y. Kim, Chem. Mater., 2010, 22, 587–603 CrossRef CAS.
- D. Andre, S. J. Kim, P. Lamp, S. F. Lux, F. Maglia, O. Paschos and B. Stiaszny, J. Mater. Chem. A, 2015, 3, 6709–6732 RSC.
- D. Larcher and J. Tarascon, Nat. Chem., 2015, 7, 19–29 CrossRef CAS PubMed.
- J. R. Croy, A. Abouimrane and Z. Zhang, MRS Bull., 2014, 39, 407–415 CrossRef CAS.
- G. B. Peter, S. Bruno and T. Jean-Marie, Angew. Chem., Int. Ed., 2008, 47, 2930–2946 CrossRef PubMed.
- Y. G. Guo, J. S. Hu and L. J. Wan, Adv. Mater., 2010, 20, 2878–2887 CrossRef.
- M. Armand and J. M. Tarascon, Nature, 2008, 451, 652–657 CrossRef CAS PubMed.
- Y. Idota, T. Kubota, A. Matsufuji, Y. Maekawa and T. Miyasaka, Science, 1997, 276, 1395–1397 CrossRef CAS.
- J. M. Tarascon and M. Armand, Nature, 2001, 414, 359–367 CrossRef CAS.
- A. G. Belous, O. Z. Yanchevskii and A. V. Kramarenko, Russ. J. Appl. Chem., 2006, 79, 345–350 CrossRef CAS.
- R. Holze, J. Solid State Electrochem., 2005, 9, 794–795 CrossRef CAS.
- Y. L. Ding, X. B. Zhao, J. Xie, G. S. Cao, T. J. Zhu, H. M. Yu and C. Y. Sun, J. Mater. Chem., 2011, 21, 9475–9479 RSC.
- d. K. Kim, P. Muralidharan, H. W. Lee, R. Ruffo, Y. Yang, C. K. Chan, H. Peng, R. A. Huggins and Y. Cui, Nano Lett., 2008, 8, 3948–3952 CrossRef CAS PubMed.
- L. Zhou, H. B. Wu, T. Zhu and X. W. Lou, J. Mater. Chem., 2011, 22, 827–829 RSC.
- X. Zhang, F. Cheng, K. Zhang, Y. Liang, S. Yang, J. Liang and J. Chen, RSC Adv., 2012, 2, 5669–5675 RSC.
- D. Wang, W. Zhou, Y. Zhang, Y. Wang, G. Wu, K. Yu and G. Wen, Nanotechnology, 2016, 27, 045405 CrossRef PubMed.
- T. Zhang, Y. Gao, H. Yue, H. Qiu, Z. Guo, Y. Wei, C. Wang, G. Chen and D. Zhang, Electrochim. Acta, 2016, 198, 84–90 CrossRef CAS.
- L. Hu, H. Zhong, X. Zheng, Y. Huang, P. Zhang and Q. Chen, Sci. Rep., 2012, 2, 986 CrossRef PubMed.
- Y. Ouyang, Y. Feng, H. Zhang, L. Liu and Y. Wang, ACS Sustainable Chem. Eng., 2016, 5, 196–205 CrossRef.
- Y. Ma, C. W. Tai, R. Younesi, T. Gustafsson, J. Y. Lee and K. Edström, Chem. Mater., 2015, 27, 7698–7709 CrossRef CAS.
- F. Courtel, H. Duncan, Y. Abulebdeh and I. Davidson, J. Mater. Chem., 2011, 21, 10206–10218 RSC.
- Y. Ouyang, Y. Feng, H. Zhang, L. Liu and Y. Wang, ACS Sustainable Chem. Eng., 2016, 5, 196–205 CrossRef.
- W. Kang, Y. Tang, W. Li, X. Yang, H. Xue, Q. Yang and C. S. Lee, Nanoscale, 2014, 7, 225–231 RSC.
- J. Li, S. Xiong, X. Li and Y. Qian, Nanoscale, 2013, 5, 2045–2054 RSC.
- L. Li, Y. Cheah, Y. Ko, P. Teh, G. Wee, C. Wong, S. Peng and M. Srinivasan, J. Mater. Chem. A, 2013, 1, 10935–10941 RSC.
- R. B. Rakhi, W. Chen, D. Cha and H. N. Alshareef, Nano Lett., 2012, 12, 2559–2567 CrossRef CAS.
- C. Yuan, H. B. Wu, Y. Xie and X. W. Lou, Angew. Chem., Int. Ed., 2014, 53, 1488–1504 CrossRef CAS.
- A. J. F. Cabral, J. P. Serna, B. R. Salles, M. A. Novak, A. L. Pinto and C. M. R. Remédios, J. Alloys Compd., 2015, 630, 74–77 CrossRef.
- J. G. Kim, S. H. Lee, Y. Kim and W. B. Kim, ACS Appl. Mater. Interfaces, 2013, 5, 11321–11328 CrossRef CAS.
- H. Sun, G. Xin, T. Hu, M. Yu, D. Shao, X. Sun and J. Lian, Nat. Commun., 2014, 5, 4526 CrossRef CAS PubMed.
- X. H. Huang, J. P. Tu, C. Q. Zhang and F. Zhou, Electrochim. Acta, 2010, 55, 8981–8985 CrossRef CAS.
- W. Kang, Y. Tang, W. Li, X. Yang, H. Xue, Q. Yang and C. S. Lee, Nanoscale, 2015, 7, 225–231 RSC.
- F. Wu, S. Xiong, Y. Qian and S. H. Yu, Angew. Chem., Int. Ed., 2015, 54, 10787–10791 CrossRef CAS PubMed.
Footnote |
| † Electronic supplementary information (ESI) available. See DOI: 10.1039/c8ra08080a |
| This journal is © The Royal Society of Chemistry 2018 |

