
 Open Access Article
 This Open Access Article is licensed under a Creative Commons Attribution-Non Commercial 3.0 Unported Licence
A variable-temperature X-ray diffraction and theoretical study of conformational polymorphism in a complex organic molecule (DTC)†
Andrea Giondaa,
Giovanni Macettiab,
Laura Locontea,
Silvia Rizzato a,
Ahmed M. Orlandoa,
Carlo Gattibc and
Leonardo Lo Presti*abc
a,
Ahmed M. Orlandoa,
Carlo Gattibc and
Leonardo Lo Presti*abc
aUniversità degli Studi di Milano, Department of Chemistry, Via Golgi 19 I-20133 Milano, Italy. E-mail: leonardo.lopresti@unimi.it
bCentre for Materials Crystallography, Århus University, Langelandsgade 140, DK-8000 Århus C, Denmark
cIstituto di Scienze e Tecnologie Molecolari, Italian CNR, Via Golgi 19 I-20133 Milano, Italy
First published on 14th November 2018
Abstract
Two conformational crystal polymorphs of 3-diethylamino-4-(4-methoxyphenyl)-1,1-dioxo-4H-1λ6,2-thiazete-4-carbonitrile (DTC) have been analyzed in the 100 K-room temperature range by single crystal X-ray diffraction and high quality DFT calculations. DTC has strongly polar as well as aliphatic substituents but no hydrogen bonding groups, and thus qualifies as a test molecule for the relative importance of electrostatic vs. dispersion–repulsion terms. The two polymorphs have the same P21/n space group and differ by a flipping of the –OCH3 group, the two conformations being almost equi-energetic and separated by a low barrier. The system is monotropic in the observed temperature range with nearly identical thermal expansion coefficients and energy–temperature slopes, one phase consistently predicted to be more stable in agreement with the relative ease of appearance. Energy decompositions show that the electrostatic term is dominant and stabilizes with decreasing temperature. Dispersion and repulsion show the expected behavior, the former becoming more stabilizing at lower temperature in contrast with increasing repulsion at higher density. Absolute values and trends are very similar in the two phases, explaining the small total energy difference. Geometrical analyses of intermolecular contacts using fingerprint plots, as well as the study of molecular dipole moments as a function of T in the framework of the Quantum Theory of Atoms in Molecules, reveal more details of phase stability.
1. Introduction
Different polymorphs have different intensive physical properties. Prediction and control of the most probable solid-state forms would be highly desirable in several cutting-edge technological areas, such as the development of functional materials1 and drug research.2 Unfortunately, polymorphism is far from being clearly understood.3 In a well-known commentary dating back more than a decade ago,4 Desiraju admitted that “the question of polymorphism […] takes the difficult problem of” crystal structure prediction (CSP) “to an even higher level”. Crystal nucleation and growth kinetics are as important as thermodynamics in governing the crystallization process,5,6 and there is no way to know in advance whether the Ostwald polymorph(s) – the first appearing one(s) – will be also thermodynamically favoured or not.4,7 Accordingly, it cannot be predicted if a change in the crystallization conditions will result in different crystal structures.8,9 In the last decade, several computational recipes10 have been proposed to face the CSP problem; sometimes, impressive successes have been achieved,10,11 but a predictive theory of crystal structure is still lacking.12,13 On the other hand, the recent flourishing of accurate tools for exploring in depth crystal energy landscapes10,14,15 led to the paradox that the simulations often suggest more thermodynamically stable structures than known polymorphs.6 In molecular crystals, lattice cohesive energies are various orders of magnitude lower than bond dissociation energies15 and rely, besides the electrostatic, on non-covalent interactions (NCI), often competing with one another.16–18 What likely drives the system toward a minority of stable structures, preventing at the same time frequent abrupt transformations from one polymorph to another, are the high energy barriers6,19 that keep close minima far apart, in conjunction with the early selection of (meta)stable clusters at the initial stages of the nucleation event.20 This poses into question the general reliability of brute force CSP methods, which are based on the comparison of computer-generated stable structures at 0 K. A better understanding of finite-T effects could come from the knowledge of how the electrostatic interactions and the relative weights of competing NCI networks evolve as a function of macroscopic thermodynamic variables. Such informations are, however, rather scanty.In this work, a multi-temperature study of the two known conformational polymorphs21–23 of 3-diethylamino-4-(4-methoxyphenyl)-1,1-dioxo-4H-1λ6, 2-thiazete-4-carbonitrile (DTC, Scheme 1, C14H17N3O3S) is reported. The main objectives are (i) to study correlations between molecular conformation and interaction energetics in the two forms, providing a rationale for their relative stability, and (ii) to investigate how and why electrostatic interactions and the various NCI patterns depend on temperature. The title compound is strongly polar,23 lacks –OH and –NH hydrogen bond (HB) donor groups and does not undergo structural phase transitions in the T range here explored. Thus, it represents an ideal test case to single out the mutual interplay of dispersive and electrostatic interactions as possible structure-determining factors.
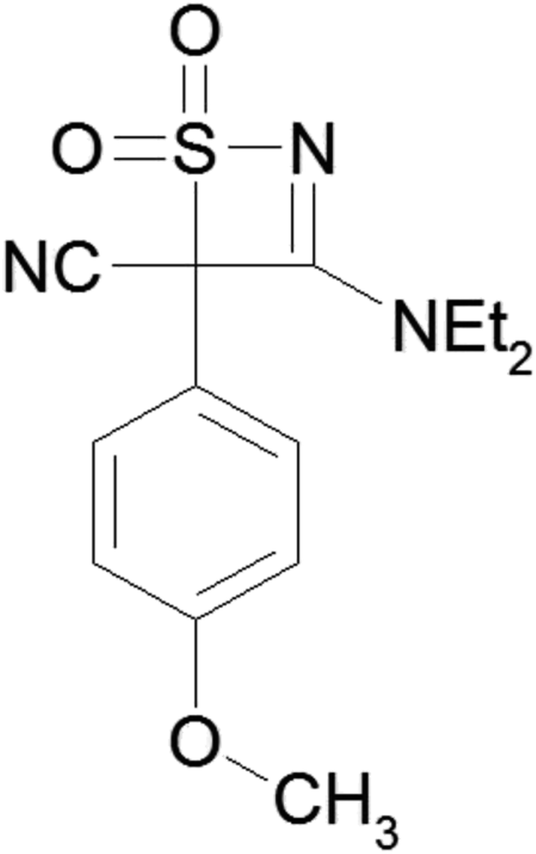 | ||
| Scheme 1 Molecular structure of DTC. | ||
2. Methods
2.1 Crystallization
The structure of the form A was originally solved in 2003, after crystallizing freshly synthesized DTC by slow evaporation from a 1![[thin space (1/6-em)]](https://www.rsc.org/images/entities/char_2009.gif) :1 CH2Cl2:Et2O mixture.21,22 In 2010, the form B was discovered upon dissolution of the aged compound in warm distilled water and subsequent recrystallization by slow evaporation at RT.22 The scarceness of the synthesized material21 prevented further crystallization screenings. In the present study, the same specimen of the B phase employed in a previous work22 was used.
:1 CH2Cl2:Et2O mixture.21,22 In 2010, the form B was discovered upon dissolution of the aged compound in warm distilled water and subsequent recrystallization by slow evaporation at RT.22 The scarceness of the synthesized material21 prevented further crystallization screenings. In the present study, the same specimen of the B phase employed in a previous work22 was used.
2.2 X-ray diffraction
Diffraction experiments were performed on a three-circle Bruker SMART APEX II diffractometer equipped with a CCD area detector and an Oxford Cryostream N2 gas blower. A series of, on average, 99.9% (form A) and 100.0% (form B) complete spheres of diffraction data were recorded up to a maximum average resolution of 0.768 Å (form A) and 0.769 Å (form B). ω-scans (0.5 deg per frame) with graphite-monochromated Mo Kα radiation were performed at 7 temperatures among 100 K and RT. The SAINT+ software package24 was used for data reduction, whereas corrections for beam anisotropy and specimen absorption were carried out with SADABS.25 All the structural least-squares refinements were performed by shelxl,26 starting from the previously determined phases at room temperature.21,22 Tables S1 and S2 in the ESI† show the main specs of data collections and refinements.2.3 Rigid body analysis and hydrogen atoms treatment
The experimental atomic coordinates were corrected for the rigid-body libration of the asymmetric unit,27 as computed through the Schomaker and Trueblood TLS decomposition procedure28 of the experimental Debye–Waller tensors. The program THMA14c29 was employed to this scope. Then, all the C–H bond distances were renormalized a posteriori to neutron-derived estimates30 by Mercury v3.931 (“H-correction”).31 It must be stressed that this procedure ensures a high quality of the experimental geometries, as correction for rigid-body motion avoids the typical underestimation of covalent bond lengths, which especially affects substituents far from the inertial axes.27 Actually, the lacking of accurate experimental models is often a bottleneck against computational methods aimed at the correct energy ranking of polymorphs.32 As expected, the higher the temperature, the higher is the TLS correction (Fig. S3 ESI†). Tables S3 and S4 ESI† report on the eigenvalues of the TLS tensors for both crystal forms and Tables S5 and S6† ESI provide (TLS + H)-corrected atomic coordinates in f(T).2.4 Solid-state quantum simulations
Following commonly accepted procedures,33–36 single-point periodic DFT calculations were carried out on the accurate X-ray structures of DTC polymorphs (Section 2.3) with the CRYSTAL14 program.37 The Minnesota-class meta-GGA M06 functional38 was used throughout, in conjunction with the Peintinger's pob-TZVP basis set39 specifically developed for solid state studies. M06 includes non-local terms that depend on the kinetic energy density. Therefore, it can partially retrieve correlation effects related to dispersion interactions and it is largely employed to this purpose.40–42 An attempt to include dispersion terms semiempirically, with a PBE0+D functional, led here to positive cohesive energies (see Section 3.6 below). No dipolar approximations were exploited for bielectronic integrals, while truncation criteria of 10−8 and 10−16 were used (TOLINTEG 8 8 8 8 16).37 A level shifter of 0.3 h and a 30% mixing of the Kohn–Sham matrix coefficients were applied to subsequent SCF cycles to accelerate convergence.37 A 4 × 4 × 4 sampling of the independent part of the first Brillouin zone defined the k-space grid for exploiting the SCF procedure. The Atoms in Molecules (AIM) topological analysis43 of the wavefunction-derived primary charge density was carried out by the TOPOND14 program44 embedded in the main CRYSTAL14 code.37 A lower theory level (M06/86-311G**(sulphur)45 + 6-31G*(other atoms)46) was employed to fully optimize the A and B lattices at T = 0 K. The Hirshfeld surface analysis47 was performed with the CrystalExplorer17 (ref. 48) suite.2.5 In vacuo quantum simulations
The Gaussian09 program49 was employed throughout. Isolated molecular pairs were computed at their in-crystal geometries using the same M06/pob-TZVP theory level as described above (Section 2.4). The energy barrier for the interconversion between the A and B conformers in the two crystal forms was estimated by a transition-state optimization in the gas phase through the Synchronous Transit-Guided Quasi-Newton (STQN) method.502.6 Cohesive energies
M06 crystal cohesive energies per molecule, Ecoh, are defined as:51,52| Ecoh = Ebulk/Z − (Eiso + ΔErel − ΔEBSSE) | (1) |
2.7 Energy decomposition
It is known that cohesive (Ecoh) and molecule–molecule interaction energies (Eint) can be decomposed into Coulomb–polarization (Ec, Ep) and dispersive–repulsive (Edis, Erep) terms once a suitable energy partitioning scheme is available:| Etot = Ec + Ep + Edis + Erep | (2) |
2.8 Quality assessment and reproducibility
CCDC 1821383–1821396 contain the full supplementary crystallographic data for this work. PLATON58 checkcif files were also deposited as part of the ESI.† All the quantum simulations were performed using commercial programs, whereas PAMoC is available free of charge for Academic institutions from the following websites: https://www.pamoc.it; http://www.angelogavezzotti.it; http://crystalexplorer.scb.uwa.edu.au/.3. Results and discussion
3.1 Molecular conformation
The title compound is chiral and its known A and B polymorphs are both centrosymmetric racemates. Fig. 1 shows the geometry of DTC at 100(2) K, together with the atom-numbering scheme. The most striking difference between A and B consists in the relative orientation of the terminal –OCH3 group. At T = 100 K, the phenyl–OCH3 torsion angle, τ(C1–O1–C2–C5), is −7.1(2) deg for the A polymorph and −174.4(1) deg for the B one (Fig. 1, inset). Other conformational differences are significantly smaller. They concern a small rotation of the phenyl group with respect to the thiazete 4-membered ring around the C7–C8 bond and a minor adjustment of the terminal ethyl chains, C11–C12 and C13–C14 (Fig. S4 ESI†). In form A, the thiazete ring is invariably almost completely planar, with a weighted average of absolute torsion angles well below 5 deg; in the form B, a very small puckering was detected only at low T, with an amplitude coefficient59 Q(2) never greater than −0.07 Å for T ≤ 140 K. | ||
| Fig. 1 (a) Molecular structure of the asymmetric unit of DTC in the crystal form A, with the atom-numbering scheme. (b) Same as (a), in the crystal form B. Thermal ellipsoids, drawn at the 50% probability level, refer to the structures at T = 100 K. Inset: best least-squares superposition of the two asymmetric units, overlaid onto the thiazete group, with the corresponding root mean square deviation. | ||
3.2 T-dependent phenomena
The two crystal forms share the same centrosymmetric space group P21/n and have very similar cell volumes (Fig. S5 ESI†), differing at most by 0.9% at RT and by 0.5% at 100 K. Also densities (at 100 K, ρ(A) = 1.389 g cm−3; ρ(B) = 1.383 g cm−3) and mean coefficients of thermal expansion in the 100 K – RT range (α(A) = 1.7(3) × 10−4 K−1; α(B) = 1.9(2) × 10−4 K−1, computed on the change of the cell volume) are almost identical as well. A similar behaviour was reported also for other organic crystals,60–62 though not being a general rule.63–65 No phase transitions were identified in either sample (see Tables S1 and S2 ESI†). In both phases, the DTC conformation does not significantly depend on T (Fig. S4 ESI†). The molecular units also maintain a constant relative orientation with respect to reference system. Comparing the inertial eigenvectors among 100 K and RT, it turns out that the asymmetric unit undergoes a 0.41 deg wide rotation in form A and 0.36 deg in form B. The 3–4% large reduction of cell volume (Fig. S5 ESI†) forces the molecules to come closer and closer. On average, the centre-of-mass distances, dCM, within the whole packing sphere with dCM ≤ 13 Å reduces by 1.11(6) % in form A and 1.21(8) % in form B. Lowering T implies thus just a rescaling of the intermolecular centre of mass distances, without significantly affecting the main packing features of either crystal form.3.3 Crystal packing
Fig. 2 compares the Hirshfeld surface fingerprint plots47 for A and B at T = 100 K. A full list of short intermolecular contacts is available in the ESI (Section S3, Tables S7–S10†). The general shape of the plots is similar, and actually, the relative amount of surface bins attributable to possibly favorable interactions is similar as well. | ||
| Fig. 2 (a) Hirshfeld surface fingerprint plot for the asymmetric unit of form A at T = 100 K. The plot shows the frequency of intermolecular pairs of internal (di) and external (de) distances describing the closest atomic contacts with the in-crystal molecular Hirshfeld surface. Light blue points mean increasing frequency. (b) Same as (a), referring to the asymmetric unit of B. | ||
Fig. 3 compares the fingerprint plot coverage of different atom pairs, i.e. it represents the relative amount of the total Hirshfeld surface that is covered by the (di + de) pixels attributed to various X⋯H (X = N, O, C, H) distances. In both polymorphs, H⋯H contacts are the most frequent ones, as it usually occurs in hydrogen-rich crystals. The slight increment of N,O⋯H frequencies in B occurs at the expenses of the C⋯H frequency, while other atom–atom close contacts are much less relevant.
 | ||
| Fig. 3 Relative contributions to Hirshfeld surface area for the close molecular contacts in DTC forms A and B. | ||
Translating the relative picture on absolute grounds, we note that some features that are clearly visible in A become barely appreciable, or even disappear, in B (Fig. 2). The four spikes in A, at a total distance (di + de) of ≈2.4 Å and ≈2.5 Å, are the signature of short H⋯O and H⋯N contacts, respectively. In B, they shift at higher di + de and are smoothed down into the H⋯H background in central region of the diagram. The two lateral wings in A at di + de ≈ 2.7 Å, which are due to close C⋯H contacts and are partly attributable to C–H⋯π interactions, somewhat survive in B at longer distances, but again they are not neatly distinguishable anymore. In general, close hydrogen-acceptor contacts roughly conserve their relative occurring frequencies in both the crystal structures, even though O⋯H and N⋯H interactions are slightly more frequent in the polymorph B (Fig. 3). Overall, though, these differences are barely significant, accounting for changes lower than 2.5% in the relative coverage of Hirshfeld surfaces, as expected for weak hydrogen bonded contacts in polymorphs of organic crystals.66 In general, both the crystal forms of DTC are characterized by similar packing modes, with the A form exploiting a slightly higher packing efficiency, as testified by a lower cell volume (Section 3.1) and by the fact that, on average, similar intermolecular contacts are translated at longer distances in the B phase. These evidences suggest that intermolecular NCI might be somehow weaker in this phase.
3.4 Conformational interconversion paths
In the gas phase, the two DTC conformers have essentially the same energy after full coordinate optimization. At the M06/pob-TZVP theory level here adopted, and taking into account the vibrational zero-point corrections, the B conformer is more stable by just 8.64 × 10⁻⁵ h (0.05 kcal mol−1) than the A one. STQN calculations (Section 2.5) estimate that the rotation barrier of the terminal –OCH3 group which relates the two minima (Section 3.1) is 3.2 kcal mol−1 high, i.e. comparable with that associated to internal rotations in ethane (2.8–2.9 kcal mol−1).67 Accordingly, it can be expected that free interconversion of the isolated molecule between the stable DTC conformers easily occurs at ordinary temperatures. DTC is thus an interesting test case for studying how different conformations, equally populated in the Boltzmann's sense before nucleation, give rise to crystal structures with different relative stability. This is probably due to the fact that the rotation of the methoxy group has a neat influence on the distribution and strength of intermolecular contacts (see below).In the crystal, at variance with the gas-phase results, the conformer A becomes invariably more stable than the B one by, on average, 1.20(4) kcal mol−1. This is likely related to a slight more favorable conformation of the whole molecule, which implies small adjustments in the dihedral angles that describe the mutual orientation of the phenyl and thiazete rings and the relative position of the –NEt2 alkyl chains (Section 3.1). However, the rotation of the methoxy moiety must be hindered in the solid state, as spontaneous interconversion of the two polymorphs was never observed (see below).
3.5 Virtual polymorph screening
To gain insights into the relative interplay of molecular conformation and crystal packing, either conformer was fully optimized within the lattice of the other one,19 comparing the virtual structures so generated with the actual ones. Table 1 shows the corresponding lattice energies, as obtained from full optimization (atomic coordinates and cell parameters) of the corresponding crystal structures (Section 2.4). No significant differences were detected in the crystal packing of the fully optimized A and B polymorphs with respect to the original X-ray structures. Moreover, in agreement with previous studies on virtual polymorphs,19,68,69 both the hypothetic structures formed by the A lattice allocating the B conformer (A[B]) and those with exchanged roles (B[A]) correspond to a minimum on the electronic potential energy surface. This means that the P21/n DTC lattice has enough flexibility to fit molecules of different shape. A change in the translational invariance conditions is sufficient to relax the unfavorable NCI (see below) and/or to strengthen the favorable ones. Even though it is still possible that a symmetry lowering (increase) to suitable subgroups (supergroups) will result in even more stable DTC polymorphs, no experimental evidence is available up to now of crystal forms different from P21/n. A broader experimental polymorph screening might disclose further hints on this topic.| Conformer → | Energies | Densities | ||
|---|---|---|---|---|
| Structure ↓ | A | B | A | B |
| a Virtual structures were generated starting from the real ones, upon a ∼170 deg wide rotation of the terminal –OCH3 group in the asymmetric unit.b All the crystal structures were fully optimized at 0 K with the CRYSTAL14 program by relaxing at the same time cell parameters and atomic coordinates at the same M06/pob-TZVP theory level employed in single-point calculations. Standard convergence criteria37 on energy and its gradient were employed. Lattice energies take into account the conformational relaxation of the asymmetric unit and are expressed in kcal per mol per molecule. | ||||
| A | −43.0 | −39.1 | 1.502 | 1.510 |
| B | −34.4 | −42.7 | 1.441 | 1.533 |
As for the present case, the optimized unit cells of the virtual structures (Table S11 ESI†) are markedly different with respect to the real ones. Overall, the cell volumes of the A and B lattices change by −0.6% and +6.4% when they are forced to allocate the “wrong” conformers. In both cases, the c cell edges undergoes a significant increase (A[B]: +4.6%; B[A]: +3.8%), while the monoclinic angle sharpens (A[B]: −2.0%; B[A]: −4.9%). In A, however, both the a and b edges become shorter by ∼−2.6% (Table S11 ESI†), overall resulting in a cell volume and density very similar to the original A[A] one (Table 1). However, lattice energies of the virtual A[B] and B[A] structures are invariably less favorable than the real A[A] and B[B] ones (Table 1). Interestingly, the B structure is the less suited to allocate the other conformer, as lattice adjustments would require up to ∼+8 kcal per mol per molecule, while the A one can fit the B conformer with a ∼+4 kcal per mol expense per molecule.
This procedure suggests that there is a 1:1 correspondence among the observed structures and the observed molecular conformations. A hypothetical conformational change in the solid state is never fully compatible with the pristine crystal lattice. This complies well with the existence of a high kinetic barrier against the interconversion of the two polymorphs in the solid state, which indeed was never observed.
3.6 Lattice cohesive energies and energy ranking
Fig. 4 shows the total M06 cohesive energies (Section 2.6) as a function of T, each computed from the corresponding (TLS + H)-corrected (Section 2.3) experimental structure. Table S12 ESI† shows the corresponding numerical entries. In both polymorphs, the lattice energy mirrors the quadratic behavior of the cell volume (Fig. S5†), indicating that the electronic PES, on average, is well described by a harmonic potential. Interestingly, the distance between the Ecoh's curves linearly decreases with T, and becomes ∼0.4 kcal mol−1 per molecule smaller at 100 K. However, assuming that the quadratic form of the potential holds true also for T < 100 K, the two curves should never cross down to 0 K, where the estimated cohesive energies per molecule are Ecoh(A) = −19.6(2) kcal mol−1 and Ecoh(B) = −17.8(3) kcal mol−1. | ||
| Fig. 4 Lattice cohesive energies, Ecoh, of the A (blue rhombi) and B (red triangles) DTC polymorphs per molecule, as evaluated by periodic calculations at the M06 pob-TZVP theory level, from the experimental structures as a function of T. The corresponding linear least-squares fits have equations Ecoh = 2.8(6) × 10−5 × T2 + 5(4) × 10−3 × T − 17.8(1) with R2 = 0.9965 for the form B (red line) and Ecoh = 3.4(5) × 10−5 × T2 + 1(2) × 10−3 × T − 19.6(2) with R2 = 0.9987 for the form A (blue line). | ||
On the basis of M06 calculations, DTC is likely monotropic and B is the metastable phase, in agreement with the predictions at T = 0 K on the fully optimized structures (Section 3.5). Moreover, the following experimental, crystallographic and electronic evidences substantiate the M06 outcomes. (i) The molecular conformer present in the A form is slightly more stable than that present in the B form (Section 3.1); (ii) in the form A, molecules are packed more closely, setting up somewhat shorter favorable interatomic contacts than in the B one (Section 3.3). (iii) The in-crystal molecular dipole moment of the polymorph A is larger, and thus stronger attractive electrostatic interactions are set up (Section 3.8 below). We thus believe that the present M06/pob-TZVP correctly reproduce the relative stability of the two crystal forms, at least on a common, relative energy scale. It should be stressed, however, that absolute energy differences are quite low (less than 2 kcal per mol per molecule) and their magnitudes depend on the theoretical framework. For example, dispersion-corrected PBE0+D/pob-TZVP simulations even result in positive Ecoh estimates (Table S13 ESI†), even though the system remains monotropic.
It can be thus concluded that the mutual conversion between the two forms is thermodynamically not possible; in principle, only B could spontaneously transform into A, but such a phase change was never observed since the synthesis of B in 2010.22 This evidence can be explained with (i) the high crystal-field induced kinetic barrier that hampers free rotation of the –OCH3 group in the DTC asymmetric unit, and (ii) the significant lattice rearrangement to which the B structure would undergo to reallocate the A-compatible conformer (Section 3.5).
3.7 Energy decomposition
To gain insights into the relative weight of different NCI in determining the cohesive energy of the two crystal forms, it is desirable to decompose Ecoh into terms that can be associated with specific physical-chemical classes of intermolecular interactions.18 The interested reader can find a full discussion on the comparison of different computational recipes in the ESI (Section S4 ESI†). We here refer to the outcomes from Spackman's ECDA model on the M06/pob-TZVP charge densities, as this method quantitatively reproduces the trend of molecule–molecule interaction energies (Eint) vs. their centre-of-mass distances, as estimated from the corresponding full quantum calculations. In any case (Section S4 ESI), all the computational recipes we tested agree very well in their general trends, and even quantitatively as concerns the electrostatic terms (Fig. S7 ESI†). Therefore, the general conclusions remain the same irrespective of the specific energy decomposition scheme adopted.Fig. 5 shows the ECDA trends of electrostatic and dispersive–repulsive contributions to total cohesive energies for the A and B phases as a function of T. The corresponding tabular entries are provided in Table S14 ESI.† Electrostatic energies dominate in both forms, but their relative weight with respect to (Edis + Erep) becomes smaller at higher T. In fact, (Eel) and (Edis + Erep) have always opposite slopes as a function of T, with electrostatic terms becoming more stabilizing upon cooling (Fig. 5a) and van der Waals ones upon warming. A close look to individual energy contributions (Fig. 5b, Table S14 ESI†) shows that, upon cooling, the overall |Erep/Edis| ratio linearly increases in both polymorphs. As molecules come closer and closer while the cell volume shrinks (Section 3.1, Fig. S5 ESI†), repulsions increase their relative importance over dispersions. However, lowering T implies rigid translations of molecular units toward each other (Section 3.2), i.e. no significant conformational changes take place to relieve unfavorable atom–atom contacts. This means that cohesion in DTC is not driven by pure dispersive–repulsive balance; otherwise, symmetry-dependent molecules would rearrange themselves to adapt to the mutated thermodynamic boundary conditions by maximizing Edis and/or reducing Erep. Yet, neither structural discontinuities nor significant conformational changes were appreciable in either phase, in strict agreement with the ECDA predictions. Thus, we conclude that the present study demonstrates that electrostatic energy terms are invariably the dominant ones (Fig. 5) and mostly determine the crystal field.
 | ||
| Fig. 5 Energy contributions, in kcal mol−1, to the total cohesive energies, Ecoh, of the A (full blue points) and B (open red points) lattices as a function of T. Diamonds: electrostatic energy (Eel); triangles: dispersive–repulsive energy (Edr = Edis + Erep). (a) ECDA energies. (b) |Erep/Edis| ratio. | ||
3.8 In-crystal dipole moments
To gain a deeper understanding of DTC electrostatics, in-crystal molecular dipole moments, μ, were evaluated from the M06/pob-TZVP periodic densities by exploiting the AIM theory (Section 2.4).70 In this framework, each dipole can be decomposed into an atomic polarization component, μP, given by the vector sum of atomic first moments , plus a charge transfer (CT) term,
  , q(Ω) being the net atomic charge associated to the Ω atomic basin, and rΩ the corresponding nuclear coordinate vector. Being DTC neutral, both μP and μCT are origin-independent and retain a physical meaning in their own.23,70 Parameters used to assess the quality of the integration of the charge density, such as the residual charge of the unit cell and the absolute values of atomic Lagrangian integrals, were all satisfactorily low, being on average as low as 0.0115(8) (0.0108(7)) e and 4.6(4) × 10−4 (5.5(3) × 10−4) e Å−2, respectively, for the form A(B). Table 2 reports the modules of the various polarization and charge transfer vectors, as well as the angle between them (γ), for the asymmetric unit of both polymorphs as a function of T. As it is often the case, the two contributions oppose each other as atoms customarily polarize in a direction counter to the local electric field caused by the interatomic charge transfer; indeed, γ was found to be close to 180 deg within 10–25 deg.
| Form A | Form B | ||||||||
|---|---|---|---|---|---|---|---|---|---|
| T | |μP| | |μCT| | |μ| | γ | T | |μP| | |μCT| | |μ| | γ |
| 100 | 4.39 | 16.52 | 12.23 | 169.9 | 100 | 3.13 | 14.11 | 11.30 | 156.9 |
| 120 | 4.39 | 16.53 | 12.23 | 169.9 | 120 | 3.15 | 14.12 | 11.31 | 156.6 |
| 140 | 4.44 | 16.50 | 12.16 | 170.0 | 140 | 3.17 | 14.14 | 11.30 | 156.6 |
| 180 | 4.43 | 16.48 | 12.14 | 169.9 | 180 | 3.20 | 14.14 | 11.26 | 156.9 |
| 220 | 4.47 | 16.46 | 12.09 | 170.0 | 220 | 3.24 | 14.17 | 11.26 | 156.9 |
| 260 | 4.49 | 16.43 | 12.04 | 170.0 | 260 | 3.27 | 14.19 | 11.24 | 157.3 |
| 292 | 4.55 | 16.42 | 11.97 | 169.4 | 297 | 3.27 | 14.15 | 11.23 | 156.5 |
As expected on the basis of the more favorable electrostatic energies (Section 3.7, Fig. 5), the DTC molecule bears a ∼0.8–0.9D larger dipole module in the form A. Moreover, in both polymorphs the dipole magnitude increases at low T. Fig. 6 shows the relative changes of |μP| and |μCT| modules with respect to the room temperature structures. The dominant charge transfer contributions (Table 2) are essentially independent on T, as they just exhibit very small (<1%) adjustments down to 100 K. More significant are the relative changes of the |μP| terms, whose modules show a neat tendency to undergo up to a ∼4% reduction upon decreasing T. Since μP is opposed to μCT, the total dipole moments increase at lower T. Recently, some of us demonstrated23 that the crystal field has a significant enhancing effect on the dipole moment of the isolated DTC molecule. In particular, crystal packing forces the atomic polarization to decrease and makes it less effective in counteracting CT contributions, in agreement also with previous studies.71,72 Therefore, a decrease of |μP| might be considered as a sign of an increased strength of the crystal field. This complies well with the increasing importance of electrostatic contributions to the total lattice energy at low T. As molecules become closer and closer, their local electric fields cooperate more effectively, determining a shift of the system toward more attractive regions of the Coulomb and polarization potentials.
 | ||
| Fig. 6 Behavior of the polarization, |μP| (diamonds), and charge transfer, |μCT| (triangles), contributions to the total in-crystal dipole vector module of the DTC molecule in forms A (full blue points) and B (empty red points), as a function of T. All quantities derive from the integration of the corresponding periodic M06/pob-TZVP charge densities, according with the AIM theory. Values normalized to RT estimates are provided. The lines are guides for the eye. | ||
4. Conclusions
In this work, the two known conformational polymorphs of DTC, a thermally stable azidation by-product of some isothiazole derivatives that exhibits a significant similarity with β-sultamic drugs,21 were studied among RT and 100 K. Single crystal X-ray diffraction experiments were complemented by accurate quantum mechanical and semiempirical simulations, both in the solid state and in the gas phase, to disclose how energetic and structural factors cooperate in giving rise to different crystal packings. In this respect, DTC is an ideal test case to investigate the interplay of dispersive and electrostatic interactions, as it lacks strong hydrogen bonds and does not undergo structural phase transitions in the T range here explored.The two DTC forms, A and B, are very similar from a general crystallographic viewpoint. They both have the same P21/n symmetry and comparable cell volumes, densities and thermal expansion coefficients. The most striking difference is due to the relative orientation of a terminal –OCH3 group, which in the phase B is rotated by ∼170 deg with respect to the asymmetric unit in the phase A. Lowering T implies just a reduction of the intermolecular centre of mass distances, and does not significantly affect conformations and mutual orientations of neighboring molecules. Accordingly, most intermolecular close contacts are similar in the two polymorphs.
In the gas phase, the rotation barrier of the terminal –OCH3 group in DTC is as low as 3.2 kcal mol−1. This rotation is kinetically hindered in the solid state, as the system is monotropic in the 100 K – RT range, with the phase B as the metastable one. Virtual polymorph screening suggests that there is a 1:1 correspondence among the observed lattice structures and the solid-state molecular conformations. A hypothetical conformational change in the asymmetric unit is never compatible with the pristine crystal lattice, as it produces unfavorable intermolecular interactions that must be relieved at the expense of the lattice cohesive energy.
In both polymorphs, the T-driven reduction of the cell volume increases the strength of electrostatic interactions and, in particular, decreases the atomic dipolar polarization terms and cause the total molecular dipole moment to increase. At the same time, dispersive interactions become less effective, as repulsive terms are enhanced by closer proximity of neighbouring molecules at lower temperatures. These results do not depend on the specific computational method employed to decompose the crystal cohesive energy into individual NCI terms. This conformity of views provides in our opinion solid grounds to our interpretation of crystal field effects of DTC as dominated by electrostatics, and in particular by permanent molecular dipole moments.
It should be remarked that the title compound was selected as a practical test case where the crystal packing is clearly governed by the balance among dispersive/repulsive and electrostatic factors. The presence of strong hydrogen bond patterns, as well as more than one molecule in the asymmetric unit, would likely complicate the picture. The occurring of strong hydrogen bond patterns will likely cooperate with electrostatics, relegating the dispersive/repulsive balance to a less central role. Structural and energetic investigations as a function of T on other suitable test cases will provide further insights on this topic.
In conclusion, we showed that multi-T single-crystal X-ray diffraction experiments, combined with quantum mechanical and semiempirical calculations, allow to go a step further with respect to the static view provided by usual computational polymorph screening, which focuses on the most stable structures at 0 K and does not explicitly take into account finite-T effects. The relative weights of electrostatic and dispersive/repulsive interactions were investigated as a function of T, and a tentative explanation for the reasons behind monotropism in DTC was proposed. In addition, the present study provides accurate experimental molecular geometries and thermal expansion coefficient estimates in a couple of subtly different polymorphs, and might be useful as a reference test bench for predictive calculations of thermal properties and crystal structures.
Conflicts of interest
There are no conflicts of interest to declare.Acknowledgements
The Authors thank prof. F. Clerici for provision of the title compound. Thanks are also due to prof. A. Gavezzotti for fruitful discussions. The LISA program sponsored by CINECA and Regione Lombardia is gratefully acknowledged for provision of computing time (project MODEFRUC) and the Danish National Research Foundation is acknowledged for partial funding of this work through contract grant number DNRF93. This research was partially funded by the Unimi Development Plan–Line 2, Action B, project NOVAQ, no. PSR2015-1716FDEMA_08. Mr P. Colombo of the Italian CNR is also to be warmly thanked for technical assistance.References
- A. O. F. Jones, B. Chattopadhyay, Y. H. Geerts and R. Resel, Adv. Funct. Mater., 2016, 26, 22335 CrossRef.
- Design of Organic Solids, in Top. Curr. Chem., ed. E. Weber, Springer-Verlag: Berlin-Heidelberg, 1998, vol. 198 Search PubMed.
- A. J. Cruz-Cabeza and J. Bernstein, Chem. Rev., 2014, 114, 2170 CrossRef CAS PubMed.
- R. G. Desiraju, Nat. Mater., 2002, 1, 77 CrossRef PubMed.
- T. Threlfall, Org. Process Res. Dev., 2003, 7, 1017 CrossRef CAS.
- S. L. Price, Acta Crystallogr., Sect. B: Struct. Sci., Cryst. Eng. Mater., 2013, 69, 313 CrossRef CAS PubMed.
- A. Gavezzotti and G. Filippini, Chem. Commun., 1998, 287 RSC.
- G. M. Day, A. V. Trask, W. D. S. Motherwell and W. Jones, Chem. Commun., 2006, 54–56 RSC.
- W. C. McCrone, Polymorphism, Physics and Chemistry of the Organic Solid State, ed. D. Fox, M. M. Labes and A. Weissberger, Interscience Publishers, New York, 1965; vol. 2; p. 725 Search PubMed.
- A. M. Reilly, R. I. Cooper, C. S. Adjiman, S. Bhattacharya, A. D. Boese, J. G. Brandenburg, P. J. Bygrave, R. Bylsma, J. E. Campbell and R. Car, et al., Acta Crystallogr., Sect. B: Struct. Sci., Cryst. Eng. Mater., 2016, 72, 439 CrossRef CAS PubMed.
- M. A. Neumann, F. J. J. Leusen and J. Kendrick, Angew. Chem., Int. Ed., 2008, 47, 2427 CrossRef CAS PubMed.
- A. Gavezzotti, Acc. Chem. Res., 1994, 27, 309 CrossRef CAS.
- G. R. Desiraju, Angew. Chem., Int. Ed., 2007, 46, 8342 CrossRef CAS PubMed.
- S. L. Price and S. M. Reutzel-Edens, Drug Discovery Today, 2016, 6, 912 CrossRef PubMed.
- A. Gavezzotti, Molecular Aggregation. Structural Analysis and Molecular Simulations of Crystals and Liquids, IUCr book series, Oxford University Press, Oxford, 2007 Search PubMed.
- L. Lo Presti, R. Soave and R. Destro, J. Phys. Chem. B, 2006, 110, 6405 CrossRef CAS PubMed.
- R. Destro, E. Sartirana, L. Loconte, R. Soave, P. Colombo, C. Destro and L. Lo Presti, Cryst. Growth Des., 2013, 13, 4571 CrossRef CAS.
- G. Macetti, L. Loconte, S. Rizzato, C. Gatti and L. Lo Presti, Cryst. Growth Des., 2016, 16, 6043 CrossRef CAS.
- M. Causà and R. Centore, CrystEngComm, 2017, 19, 1320 RSC.
- M. Salvalaglio, C. Perego, F. Giberti, M. Mazzotti and M. Parrinello, Proc. Natl. Acad. Sci. U. S. A., 2015, 112, E6 CrossRef CAS PubMed.
- F. Clerici, M. L. Gelmi, R. Soave and L. Lo Presti, Tetrahedron, 2002, 58, 5173 CrossRef CAS.
- A. M. Orlando, L. Lo Presti and R. Soave, Acta Crystallogr., Sect. E: Struct. Rep. Online, 2010, 66, o2032 CrossRef CAS PubMed.
- L. Lo Presti, A. M. Orlando, L. Loconte, R. Destro, E. Ortoleva, R. Soave and C. Gatti, Cryst. Growth Des., 2014, 14, 4418 CrossRef CAS.
- Bruker, SMART and SAINT, Bruker AXS Inc., 1999, Madison, Wisconsin, USA Search PubMed.
- G. M. Sheldrick, SADABS: Program for scaling and corrections of area-detector data, University of Göttingen, Germany, 1996 Search PubMed.
- G. M. Sheldrick, Acta Crystallogr., Sect. A: Found. Crystallogr., 2008, 64, 112 CrossRef CAS PubMed.
- B. T. M. Willis and A. W. Pryor, Thermal Vibrations in Crystallography, Cambridge University Press, Cambridge, 1975 Search PubMed.
- V. Schomaker and K. N. Trueblood, Acta Crystallogr., Sect. B: Struct. Sci., 1998, 54, 507 CrossRef.
- J. D. Dunitz, E. F. Maverick and K. N. Trueblood, Angew. Chem., Int. Ed. Engl., 1988, 27, 880 CrossRef.
- F. H. Allen and I. J. Bruno, Acta Crystallogr., Sect. B: Struct. Sci., Cryst. Eng. Mater., 2010, 66, 380 CrossRef CAS PubMed.
- C. F. Macrae, I. J. Bruno, J. A. Chisholm, P. R. Edgington, P. McCabe, E. Pidcock, L. Rodriguez-Monge, R. Taylor, J. van de Streek and P. A. Wood, J. Appl. Crystallogr., 2008, 41, 466–470 CrossRef CAS.
- N. Wahlberg, P. Ciochón, V. Petriĉek and A. Ø. Madsen, Cryst. Growth Des., 2014, 14, 381 CrossRef CAS.
- J. G. Brandenburg and S. Grimme, J. Phys. Chem. Lett., 2014, 5, 1785 CrossRef CAS PubMed.
- J. J. Holstein, P. Luger, R. Kalinowski, S. Mebs, C. Paulman and B. Dittrich, Acta Crystallogr., Sect. B: Struct. Sci., Cryst. Eng. Mater., 2010, 66, 568 CrossRef CAS PubMed.
- E. A. Zhurova, C. F. Matta, N. Wu, V. V. Zhurov and A. A. Pinkerton, J. Am. Chem. Soc., 2006, 128, 8849 CrossRef CAS PubMed.
- D. E. Hibbs, J. R. Hanrahan, M. B. Hursthouse, D. W. Knight, J. Overgaard, P. Turner, R. O. Piltz and M. P. Waller, Org. Biomol. Chem., 2003, 1, 1034 RSC.
- R. Dovesi, V. R. Saunders, C. Roetti, R. Orlando, C. M. Zicovich-Wilson, F. Pascale, B. Civalleri, K. Doll, N. M. Harrison, I. J. Bush, P. D'Arco, M. Llunell, M. Causà and Y. Noël, CRYSTAL14 User's Manual, University of Torino, Torino, 2014 Search PubMed.
- Y. Zhao and D. G. Truhlar, Theor. Chem. Acc., 2008, 120, 215 Search PubMed.
- M. F. Peintinger, D. V. Oliveira and T. Bredow, J. Comput. Chem., 2013, 34, 451 CrossRef CAS PubMed.
- J. M. Skelton, E. Lora Da Silva, R. Crespo-Otero, L. E. Hatcher, P. R. Raithby and S. C. ParkerWalsh, Faraday Discuss., 2015, 177, 181 RSC.
- M. Walker, A. J. A. Harvey, A. Sen and C. E. H. Dessent, J. Phys. Chem. A, 2013, 117, 12590 CrossRef CAS PubMed.
- N. Marom, A. Tkatchenko, M. Rossi, V. V. Gobre, O. Hod, M. Scheffler and L. Kronik, J. Chem. Theory Comput., 2011, 7, 3944 CrossRef CAS PubMed.
- R. F. W. Bader, Atoms in Molecules: A Quantum Theory, Clarendon Press, Oxford, 1990 Search PubMed.
- C. Gatti and S. Casassa, TOPOND14 User's Manual, 2014 Search PubMed.
- T. Bredow, P. Heitjans and M. Wilkening, Phys. Rev. B, 2004, 70, 115111 CrossRef.
- M. A. Spackman and A. S. Mitchell, Phys. Chem. Chem. Phys., 2001, 3, 1518 RSC.
- M. A. Spackman and D. Jayatilaka, CrystEngComm, 2009, 11, 19 RSC.
- M. J. Turner, J. J. McKinnon, S. K. Wolff, D. J. Grimwood, P. R. Spackman, D. Jayatilaka and M. A. Spackman, CrystalExplorer17, University of Western Australia, 2017, http://hirshfeldsurface.net Search PubMed.
- M. J. Frisch, G. W. Trucks, H. B. Schlegel, G. E. Scuseria, M. A. Robb, J. R. Cheeseman, G. Scalmani, V. Barone, et al., Gaussian 09 (Revision A.1), Gaussian, Inc., Wallingford CT, 2009 Search PubMed.
- C. Peng and H. B. Schlegel, Isr. J. Chem., 1993, 33, 449 CrossRef CAS.
- B. Civalleri, K. Doll and C. M. Zicovich-Wilson, J. Phys. Chem. B, 2007, 111, 26 CrossRef CAS PubMed.
- L. Lo Presti, R. Soave, M. Longhi and E. Ortoleva, Acta Crystallogr., Sect. B: Struct. Sci., Cryst. Eng. Mater., 2010, 66, 527 CrossRef CAS PubMed.
- S. F. Boys and F. Bernardi, Mol. Phys., 1970, 19, 553 CrossRef CAS.
- M. A. Spackman, Chem. Phys. Lett., 2006, 418, 158 CrossRef CAS.
- M. A. Spackman, Keynote Lecture KN23.28, Electrostatic and related properties from accurate charge density analyses, IUCR2005, Book of Abstracts, Firenze, 2005, vol. C5 Search PubMed.
- A. D. Buckingham, Physical Chemistry: An Advanced Treatise, ed. D. Henderson, Academic Press, New York, 1970, p. 349 Search PubMed.
- M. Barzaghi, PAMoC (Version 2010-07-27), Online User's Manual; CNR-ISTM, Institute of Molecular Science and Technologies, Milano, Italy, http://www.istm.cnr.it/%7Ebarz/pamoc/ Search PubMed.
- A. L. Spek, Acta Crystallogr., Sect. D: Struct. Biol., 2009, 65, 148 CrossRef CAS PubMed.
- D. Cremer and J. A. Pople, J. Am. Chem. Soc., 1975, 97, 1354 CrossRef CAS.
- S. Bhattacharya, V. G. Saraswatula and B. K. Saha, Cryst. Growth Des., 2016, 16(1), 277 CrossRef CAS.
- V. G. Saraswatula and B. K. Saha, Cryst. Growth Des., 2015, 15, 593 CrossRef CAS.
- S. Bhattacharya and B. K. Saha, Cryst. Growth Des., 2013, 13, 3299 CrossRef CAS.
- B. K. Saha, S. A. Rather and A. Saha, Eur. J. Inorg. Chem., 2017, 28, 3390 CrossRef.
- V. G. Saraswatula, S. Bhattacharya and B. K. Saha, New J. Chem., 2015, 39, 3345 RSC.
- S. Bhattacharya and B. K. Saha, CrystEngComm, 2014, 16, 2340 RSC.
- L. Lo Presti, CrystEngComm, 2018, 20, 5976–5989 RSC.
- G. Ercolani, J. Chem. Educ., 2005, 82, 1703 CrossRef CAS.
- R. Centore, S. Fusco, F. Capone and M. Causà, Cryst. Growth Des., 2016, 16, 2260 CrossRef CAS.
- R. Centore, M. Causà, F. Cerciello, F. Capone and S. Fusco, CrystEngComm, 2014, 16, 9168 RSC.
- R. F. W. Bader, A. Larouche, C. Gatti, M. T. Carroll, P. J. MacDougall and K. B. J. Wiberg, Chem. Phys., 1987, 87, 1142 CAS.
- E. May, R. Destro and C. Gatti, J. Am. Chem. Soc., 2001, 123, 12248 CrossRef CAS PubMed.
- C. Gatti, B. Silvi and F. Colonna, Chem. Phys. Lett., 1995, 247, 135 CrossRef CAS.
Footnote |
| † Electronic supplementary information (ESI) available: Details of the energy decomposition schemes explored in this work; crystallographic and refinement details; eigenvalues of the translations and libration tensors describing the rigid body motion of the DTC asymmetric unit; TLS + H corrected fractional coordinates; conformational descriptors; crystal packing; hydrogen bonded contacts at 100 K and RT; optimized lattice parameter of real and virtual polymorphs; total cohesive energy per molecule (M06 and PBE0+D); molecule–molecule interaction energies. CCDC 1821383–1821396. For ESI and crystallographic data in CIF or other electronic format see DOI: 10.1039/c8ra08063a |
| This journal is © The Royal Society of Chemistry 2018 |