 Open Access Article
Effect of iron ion diffusion on the corrosion behavior of carbon steels in soil environment†
Ziheng Baiab,
Kui Xiao *ab,
Pengfei Dongab,
Chaofang Dong
 ab,
Dan Weic and
Xiaogang Liab
aCorrosion and Protection Center, University of Science and Technology Beijing, Beijing 100083, China. E-mail: xiaokui@ustb.edu.cn
bInstitute of Advanced Materials and Technology, University of Science and Technology Beijing, Beijing 100083, China
cService Center for Societies, China Association for Science and Technology, Beijing 100081, China
First published on 5th December 2018
Abstract
The corrosion behavior of metal materials in soil environments has been intensively studied recently. Even so, the detailed corrosion mechanisms remain elusive, especially regarding the role of metal ions. In this study, we investigated the effect of ion diffusion on the corrosion processes of carbon steel via scanning electron microscopy (SEM), in situ laser Raman spectroscopy and scanning Kelvin probe (SKP). It was found that the Fe3+ diffusion was a key factor to the corrosion rate, as well as the formation of corrosion products. Typically, the corrosion products suppressed the diffusion of ions to the surface of carbon steels, and thus the cation diffusion coefficient played a significant role in formation processes of corrosion products, which furthermore affected the corrosion processes of the carbon steels.
1. Introduction
Soil is a mixture of soil particles, water, and air, with the characteristics of heterogeneity, porosity, and relative fixity, which lead to very complicated and special corrosion processes.1–3 And the corrosion problems have caused extensive expense due to lack of reliability of materials in the natural environment.4,5 In general, soil corrosion is a type of electrochemical process, which occurs at soil/metal interfaces. Compared with corrosion occurring at the solution/metal interface, the interaction between soil and metal is quite different, so that some special corrosion products will be formed, which have been the subject of the extensive studies.6,7It was found that ion diffusion plays an important role in soil corrosion processes.8 For example, the soil chemical kinetic process was investigated using a thin disc flowing system, which indicated that when the soil sample layer was sufficiently thin, the vertical concentration gradient of the soil could be ignored.9 Macroscopically, the whole system can be approximated as the ions' horizontal one-dimensional movement, which simplifies the boundary conditions of the diffusion model. It was found that dissolved oxygen and the migration of Fe2+ greatly affected the formation process and composition of the corrosion products in the soil environment.10 Typically, ion diffusion often became the controlling factor. The passive film formed on a mild steel surface was composed of Fe(II) oxide, Fe(III) oxide, and/or hydroxides, and the contribution of the Fe(II) species vanished when the potential of the film formation shifted into the passive domain.11 The corrosion of carbon steel in NaCl solution was investigated by using in situ Raman spectroscopy.12 The rust layer was composed of γ-FeOOH as an outer layer and Fe3O4 as an inner layer.13,14 The FeOOH was transformed into Fe3O4 when oxygen was insufficient, and the corrosion rate declined when the FeOOH layer became thicker and denser.14
However, most of these studies focused on the diffusion effect of compounds (i.e., Fe2O3, Fe3O4, FeOOH, FeCO3, etc.), not Fe2+ and Fe3+ ions; these studies simultaneously focused on the physical and chemical properties of soil and failed to consider the soil as an electrolyte in their research. In this study, the electrochemical and corrosion behaviors of carbon steel in three different simulated soil environments, comprising kaolin, agar gel, and a simulated solution, were investigated by weight loss method, scanning electron microscopy (SEM), and in situ laser Raman spectroscopy as well as scanning Kelvin probe (SKP) method.
2. Experimental methods
2.1. Materials and environmental media
The chemical composition of carbon steel is (wt%): C 0.16, Si 0.20, Mn 0.61, P 0.019, S 0.023 and Fe balance. The specimens for electrochemical measurement were machined to the dimensions 10 mm × 10 mm × 5 mm. Then, the specimens were embedded in epoxy resin with an exposed working area of 1 cm2. The specimens for electrochemical measurements were sequentially ground with SiC paper from 320 grit to 2000 grit, polished with a 0.1 μm alumina polishing powder, and then degreased with alcohol.The compositions of the simulated soil media are listed in Tables 1 and 2. The composition of kaolin is Al2O3·SiO2·H2O (Table 1), which has a good aggregative state. Owing to the crystal structure, kaolin has extraordinary adsorption, dehydration, rehydration and ion exchange performance properties. Thus, kaolin is very close to a real soil environment. The quartz sand used here provides porosity. The agar gel can change into a colloid when it absorbs 20 times its volume of water. Agar gel can be dissolved in hot water but not cold water, and the solution remains a liquid at 42 °C but coagulates into a colloid at 37 °C. The agar gel colloid has the properties of solidification and stability. To keep the concentration of Cl− and SO42− in the solution uniform (mass fraction), a defined ratio of salts to agar was prepared, and the mixture was dissolved at 90 °C after being well mixed, turning into a colloid after cooling. The proportions are listed in Table 2.
| Component | NaCl | Na2SO4 | Deionized water | Kaolin | Quartz sand |
|---|---|---|---|---|---|
| Weight (g) | 14.61 | 3.551 | 200 | 250 | 43.72 |
| Component | NaCl | Na2SO4 | Deionized water | Agar gel powder |
|---|---|---|---|---|
| Weight (g) | 2.92 | 0.71 | 96.7 | 5 |
To eliminate the effect of anions in the aqueous solution on corrosion, the simulated solution containing Cl− (0.5 mol L−1) and SO42− (0.05 mol L−1) was prepared by using FeCl3 and FeSO4, respectively. In addition, the ions were balanced by NaCl and Na2SO4. The concentration of Fe3+ was changed from 0 mol L−1 to 0.005 mol L−1, 0.01 mol L−1, and 0.05 mol L−1. The electrochemical samples of carbon steel were prepared by electrochemical tests in the prepared and oxygen-free solution.
2.2. Weight loss method
The prepared samples were immersed in the simulated media environments. The samples were taken out after being immersed or buried for 0 h, 24 h, 72 h and 128 h. The surface corrosion products were removed using an acid solution (500 mL HCl + 500 mL deionized water + 4 g hexamethylenetetramine). The acid solution was the standard acid solution used to remove the rust on carbon steel, which is, however, not harmful to carbon steel substrates; to obtain the weight G1, samples were rinsed with clean water after pickling, soaked in ethanol, dried in a cool air flow, and kept in the dryer. The samples were weighed (with an accuracy of 0.1 mg), and the corrosion weight loss, W, was calculated by the following equation:
 | (1) |
2.3. The analyses of corrosion products
The SEM morphologies of the corrosion products were observed via an FEI Quanta 250 scanning electron microscope. A JY-HR800 micro-Raman spectrometer was used to detect the composition of the corrosion products. Raman excitation was performed at a wavelength of 532 nm, a laser power of 1 mW and a laser spot diameter of 3 μm. The data collection time was 100 s.2.4. Ion diffusion rate test
Fig. 1 shows CAD diagrams of the diffusion coefficient measuring device. The device consisted of a Plexiglass box which was divided into two reservoirs and a central cavity. A piece of semipermeable membrane was stuck on one side of the cavity using silicone. The cavity was filled with agar gel colloid or kaolin after the silicone had been air-dried. Then, on the other side, it was also sealed by silicone and the other semipermeable membrane in the same way as the former one. The equipment was air-dried and washed with deionized water.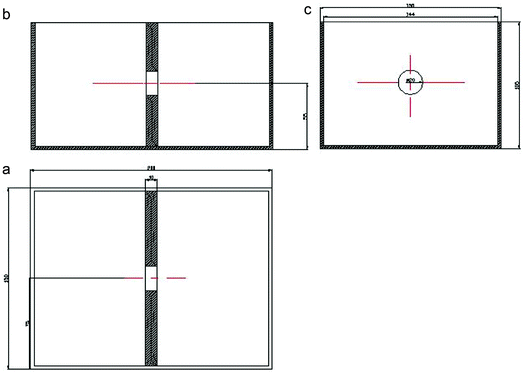 | ||
| Fig. 1 CAD three-view of the diffusion coefficient measuring device, (a) front view, (b) side front with the membrane and (c) vertical view (from left to right). | ||
A 1 L volume of deionized water was poured into the reservoir on one side of the Plexiglass box as the original receptor solution, and 1 L of a 0.01 mol L−1 FeCl3 benchmark solution was poured into the other side of the box as the donor solution. The box was placed horizontally and sealed with plastic wrap to prevent evaporation. The ion-exchange membrane adopted in this experiment was JAM-1 homogeneous cation exchange membrane that was made of aromatic hydrocarbons, double vinyl compounds and linear polymers. The total number of iron ions was determined by means of phenanthroline spectrophotometry.
The test instrument used in the iron standard curve and spectrophotometric test was a Hitachi U-3900H spectrophotometer; the measurement wavelength range was 400–600 nm and the molar absorption coefficient was 1.1 × 10⁴ L mol−1 cm. The simulated solution was prepared by a prescribed procedure.
2.5. Surface potential analysis of the samples
The surface potential of metal with corrosion products in atmospheric environment can be detected using a scanning Kelvin probe (SKP), which has a linear relationship with corrosion potential. Thus, the SKP can reflect the changes of corrosion potential in corrosion processes, and furthermore investigate the corrosion behavior. The SKP test was performed using the SKP module of an M370 scanning microelectrochemical workstation manufactured by Princeton Applied Research. The scanning Kelvin probe test system was calibrated using a saturated calomel electrode (SCE) before the testing. The test setup is shown in Fig. 2, where the test area is marked with a white square.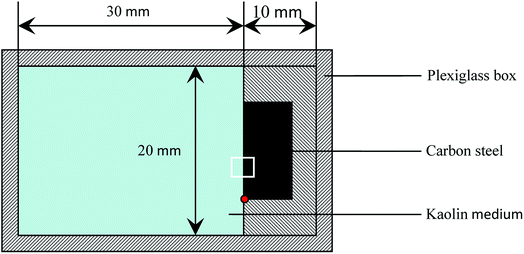 | ||
| Fig. 2 Schematic of the SKP test of carbon steel in kaolin medium, where the test area is marked with a white square. | ||
To determine the test location, we moved the probe down to the lower left corner of the sample surface as a reference point (red dot in Fig. 2), and then moved it 3000 μm in the Y+ direction. Next, we set the parameters, and then moved the probe 1000 μm in the X-direction for the origin of the SKP plane scan. To make sure that each test was located at that point for an in situ measurement, we set the test parameters as follows: the scanning area was 2000 μm × 1000 μm, the step length was 50 μm, the probe vibration amplitude was 30 μm, and the average distance between the probe and the sample surface was controlled within 100 μm.
The test environment was saturated water (∼20%) kaolin; the ingredients are shown in Table 1. To maintain a constant moisture content, the kaolin was sealed with plastic wrap after each test was completed. Every 24 hours, the kaolin was weighed on a balance and water was added dropwise to maintain a constant weight.
3. Results
3.1. Weight loss curves in different medium environments
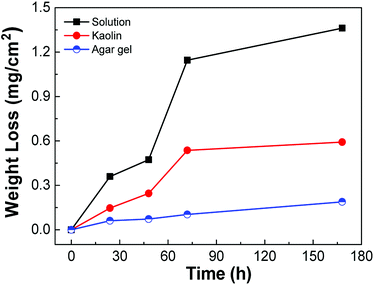
The measurement of weight loss of the carbon steel in three different media is shown in Fig. 3. The weight loss in solution increased with increasing experimental time. For the fresh surface of the sample in the early stage, the surface metal continuously dissolved into the simulated solution; however, the early corrosion products provided a protective effect in suppressing the corrosion process formed on the surface, and thus the corrosion rate slowed down gradually with the formation of a rust layer. However, as the corrosion products became loose and dissolvable in the solution, the protective effect on the matrix was weakened, and the corrosion rate increased again. Finally, the corrosion rate gradually reduced to a fixed value. This situation is similar to the weight loss trend of mild steel in sandy, clay and loamy soil environments.15 It was obvious that the cations generated on the surface in the kaolin and agar gel cannot diffuse as readily as those in the solution, and therefore, the corrosion products were not as loose as those in the solution. When the corrosion products accumulated to a certain threshold, the corrosion rate rapidly decreased.3.2. Corrosion product analysis
Fig. 4 shows the morphology of the corrosion products in three different media. In Fig. 4(a), the rust grew relatively smoothly and perpendicular to the surface. The outer rust layer was smooth, and needle-like products were observed. In Fig. 4(b), the rust grew along the surface. Owing to its growth restriction in the perpendicular direction, the homogeneity and crystallization of the rust were enhanced. Fig. 4(c) shows the growth of rust intertwined with the agar gel, in which flake-like crystallites can be observed only in a localized area. Combined with the kinetic weight loss curves, the corrosion rate in the simulated solution was the highest, followed by that in kaolin and, lastly, that in agar gel. This could be explained by the structure of the different corrosion products in the media. The structure of the outer-layer corrosion products generated in solution was loose, and could not restrain corrosive species such as anions or oxygen from permeating into the substrate;16 thus, the corrosion rate in the solution environment was the highest. Although the corrosion products formed in kaolin were more intensive, the blocking effect of its petal-like rust layer was less than that in agar gel, and therefore, the degree of corrosion in kaolin was more severe than that in agar gel.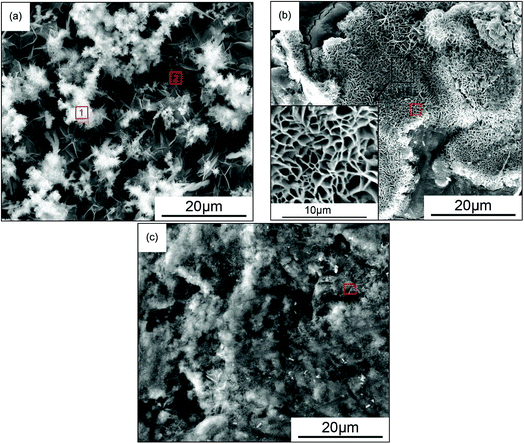 | ||
| Fig. 4 The SEM images of the corrosion products of carbon steel in three different simulated soil media. (a) Simulated solution for 24 h, (b) kaolin for 168 h, (c) agar gel for 168 h. | ||
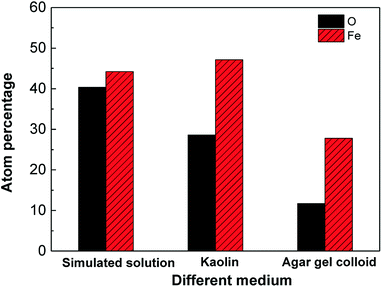
The permeability of a soil is determined by its structure and particle size,17 and it can affect the movement rate of gases and liquids in the soil. The retention ability of small particles, such as slime, is much higher than that of large-sized particles, such as sand.18 Low-permeability soils can absorb underground water through capillary action, and thus water saturation occurs in some part, which becomes a barrier against the movement of air. In the case of kaolin, owing to the fact that its conglutination on the metal surfaces was strong, its expansion or contraction under hydration and ion exchange processes could introduce mechanical forces on material surfaces, which finally caused damage to the metal surfaces. Therefore, the corrosive ingredients in the solution could arrive at the metal surfaces through the cracks and ultimately led to the accelerating of corrosion processes. A similar phenomenon was observed in soil corrosion of X70 pipeline steel in a red clay soil environment.19 However, because of the small particles in kaolin, the diffusion ability of the ions was less, and thus, the corrosion products were able to adhere to the surface of the specimen more easily, and additionally inhibit the corrosion processes. The ratio (atomic percentage) of the elements iron and oxygen in the red squares area of Fig. 4 is shown in Fig. 5. The percentage of iron in the corrosion products in kaolin was higher than that in agar gel, and the medium was responsible for this: based on the test of the diffusion rate, the diffusion rate of iron in agar gel was faster than that in kaolin, and hence only a small amount of iron remained on the surfaces and then formed corrosion products.
Fig. 6 shows the micro-Raman spectroscopy of the various corrosion products. The Raman spectrum of the corrosion products formed on the carbon steel surface in the simulated solution is shown in Fig. 6(a). According to the values for Raman peaks of iron compounds given in previous studies,20,21 the corrosion products could be identified as follows. The peaks appearing at 250, 526, 651, 1050 and 1304 cm−1 are the characteristic peaks of γ-FeOOH, while the peaks at 310 and 341 cm−1 are the characteristic peaks of γ-Fe2O3. In addition, a small amount of α-Fe2O3 is also indicated in the spectrum, with the corresponding peaks at 225 and 300 cm−1. The Raman spectrum of the corrosion products formed in kaolin is shown in Fig. 6(b). The peaks at 298, 399, 481, 554 and 1002 cm−1 are the characteristic peaks of α-FeOOH, while those at 222, 244, 298, 501, 615, and 1318 cm−1 are the characteristic peaks of α-Fe2O3. In addition, the two peaks at 550 and 675 cm−1 also indicate that a small amount of Fe3O4 appeared in the corrosion products. The Raman spectrum of the corrosion products generated in agar gel is shown in Fig. 6(c). The peaks at 50, 380, 526, 651, 1050 and 1304 cm−1 are the characteristic peaks of γ-FeOOH, the double peaks at 550 and 675 cm−1 suggest that there was a small amount of Fe3O4, and the peaks at 1400–1600 cm−1 are associated with the carbon in the agar gel.
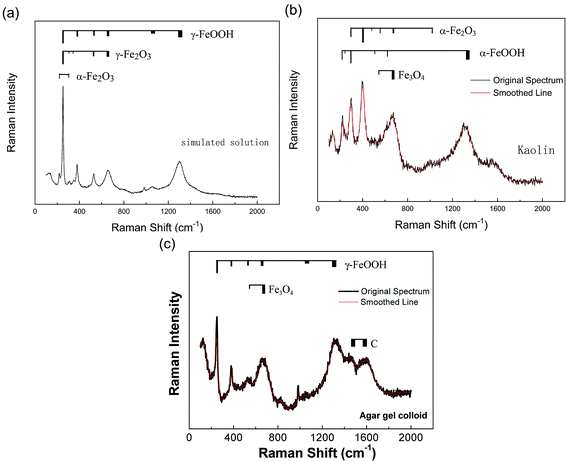 | ||
| Fig. 6 Raman spectra of the corrosion products of carbon steel in three different diffusion media after 168 h: (a) simulated solution, (b) kaolin, and (c) agar gel. | ||
From the differences among the three media, it could be found that the corrosion products in kaolin were mainly α-FeOOH and α-Fe2O3, while in the simulated solution and agar gel, they were mainly γ-FeOOH and Fe3O4. Typically, the formation of corrosion products of carbon steels and their transformation were different in different media. Previous research21 had demonstrated that in neutral environments, the primary corrosion product was γ-FeOOH, which gradually transformed into γ-Fe2O3, which was more stable. Because the crystal structure of FeOOH was poor, the FeOOH tended to transform into Fe2O3, and the formula for this transformation is
| 2FeOOH → Fe2O3 + H2O | (2) |
Formula (2) can be regarded as a dehydration reaction. The concentration of Fe2O3 was low in the simulated solution and in the agar gel medium. And since they have better water absorption, γ-FeOOH could convert into α-FeOOH or γ-Fe2O3 at first, and then the γ-Fe2O3 be transformed into α-Fe2O3.22 The corrosion products γ-FeOOH and Fe3O4 that were detected in corrosion products of low carbon steel in 0.01 M NaCl solution mainly came from the passivity of iron.23
3.3. SKP test in soil medium
In this section, the potential change of the cross section of sample-interface (corrosion products) – kaolin of Q235 carbon steel in a soil environment was studied by scanning Kelvin probe (SKP). This was used to detect the influence of ions and the formation of corrosion products. The SKP method has been used in the study of corrosion behaviors of metals.24,25 The in situ measurements of the marked locations of the samples in Fig. 2 were taken at 0 h, 24 h, 72 h and 168 h respectively, and the test results are shown in Fig. 7 as unified z-axis coordinate contour maps.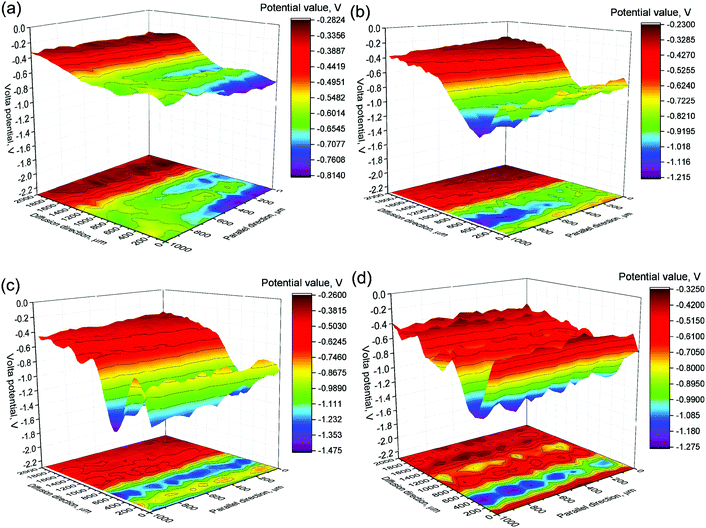 | ||
| Fig. 7 Potential distribution diagrams of SKP test of carbon steels in kaolin simulated medium for different times: (a) 0 h, (b) 24 h, (c) 72 h and (d) 168 h. | ||
The potential of the cross section of the kaolin and metal specimens was different (from Fig. 7(a)). The light blue area in Fig. 7(b), which could be considered as a mixture of corrosion products and kaolin, possibly caused by the edge effect of the metal sample. The darker color areas in Fig. 7(b–d) indicated the diffusion of metal ions, and illustrated the diffusion of ions with time prolonged. The figure also indicated that the ion diffusion areas continued to shrink, and simultaneously the transition area became wider. This phenomenon occurred because the iron ions continued to take part in the reactions and generated iron oxide or oxy-hydroxide compounds.
Moreover, the following information can be obtained from Fig. 7. First, along the x-axis, the potential mainly consisted of the following three regions: the higher potential region which corresponded to the metal sample side, the lower potential region which was associated with the kaolin side, and the middle region which reflected the transition zone. The higher potential of the specimen on the metal side after 24 hours represented the formation of the corrosion products, and this region gradually expanded along the y-axis with prolonged reaction time. The potential distribution of the kaolin side gradually became disperse, and a point of extremely high value appeared. This phenomenon indicated that the diffusion of ions and the corrosion products in the kaolin was not uniform and was different in different localized regions. In a soil environment, owing to the complexity of the soil structure and the differences of physicochemical properties, metal ions and the related corrosion products are also preferentially diffused along voids with high porosity or moisture after the metal is dissolved.
3.4. Phenanthroline spectrophotometry
Fig. 8 shows the standard curve of iron measured by the phenanthroline spectrophotometry (ISO 6685-1982). It was fitted by a linear standard curve equation as follows, where y is absorption and x is the concentration of Fe3+:| y = 0.2182x + 0.0004 | (3) |
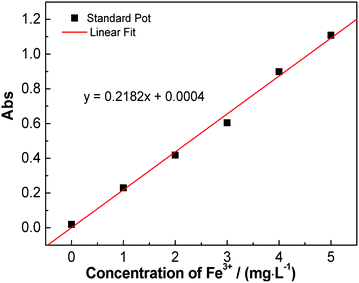 | ||
| Fig. 8 Iron standard curve measured by phenanthroline spectrophotometry, where the molar concentration of Fe3+ is 8.39 × 10⁻⁴ mol L−1 after the conversions. | ||
The ion diffusion rate example in kaolin was calculated as an example. The measured absorption of the water sample after 48 h was y = 0.103; thus, a value of x = 0.470 (mg L−1) was obtained after substitution into the standard curve equation (with a 100-fold diluted solution). The total number (n) of iron ions in the receptor solution (1 L) could be calculated as follows:
 | (4) |
Therefore, the average diffusion rate (νd) of iron in the kaolin medium in the first 2 days was:
 | (5) |
From Fick's first law, the relationship between the average diffusion rate (νd) and the average concentration gradient was as follows, where c is the concentration of ions, x is the length and D is the diffusion coefficient:
 | (6) |
 | (7) |
In the early stage of the diffusion, compared with the donor solution, the ion concentration in the receptor solution was very low; therefore, Δc could be approximated as 0.01 mol L−1, while Δx was the length of the diffusion cavity, which was 1 cm. The diffusion coefficient (D = −4.86 × 10⁻⁴ cm2 s−1) in kaolin medium was calculated using eqn (7). This value was larger than that measured in Fricke gel dosimeters (where D is around −1.81 × 10⁻⁶ cm2 s−1),26,27 maybe due to the fact that νd in kaolin medium was larger than that in agar gel colloid dosimeters. Similarly, the diffusion rate and coefficient in agar gel medium could be calculated, and the results are listed in Table 3. The diffusion rate of Fe3+ in the agar gel was higher than that in kaolin.
| Diffusion medium | Diffusion capacity (mol) | Diffusion rate (mol cm−2 s−1) | Diffusion coefficient (cm2 s−1) |
|---|---|---|---|
| Kaolin | 8.39 × 10⁻⁴ | 4.86 × 10⁻⁹ | −4.86 × 10⁻⁴ |
| Agar gel colloid | 2.50 × 10⁻³ | 1.45 × 10⁻⁸ | −1.45 × 10⁻³ |
Combined with Fig. 3, we further concluded that the diffusion rate of ions was fast, and therefore, rust could not accumulate on the matrix. Although rust was formed, the structure was still very loose and its protection ability was very poor. For the comparison between agar gel colloid and kaolin, the inflection point of the weight loss curve of kaolin was more obvious, which indicated that the ability of the corrosion products to suppress corrosion processes was more useful.
3.5. The models of corrosion mechanisms
In general, corrosion processes consist of two basic reactions, the anodic and cathodic reactions, the cathodic one in the corrosion of iron is as follows, which is also the first step in the sequence of corrosion processes of iron:| Fe → Fe2+ + 2e− | (8) |
Typically, the OH− mainly comes from the anodic action in the electrochemical reaction that is associated with the corrosion processes, and the anodic action in a neutral environment is:
| O2 + 2H2O + 4e− → 4OH− | (9) |
Owing to the tiny interstices among the kaolin particles which had a diameter about 2–20 μm, thin water films occurred on the surfaces of specimens. When Fe2+, the product of reaction (8), occurred in these thin liquid films, the diffusion step began as the result of the concentration gradient, and the direction was from the thin liquid films to the interstices owing to the dissolvability of Fe2+. In the aqueous environment, reaction (8) occurred on the surface of specimens and the ions diffused from the surface to the solution. Thus, the cathodic reaction proceeded continuously and the corrosion products formed (eqn (10)–(12)).
When the samples were immersed in the simulated solution or simulated soil environments, the electrode reaction occurred at the interface between the matrix and the solution or liquid films (eqn (8) and (9)), and γ-FeOOH gradually covered the surfaces of the specimens (10)–(12).
| Fe2 + 2OH− → Fe(OH)2 | (10) |
| 2Fe(OH)2 + O2 + H2O → 2Fe(OH)3 | (11) |
| Fe(OH)3 → γ-FeOOH + H2O | (12) |
Because the γ-FeOOH had poor crystal structure, there was a tendency for it to transform into Fe2O3 as shown in formula (13). Thus, γ-FeOOH and Fe2O3 were detected in Raman analysis of the simulated solution.
| 2γ-FeOOH → Fe2O3 + H2O | (13) |
However, with lower diffusion rates of ions in agar and kaolin, the Fe2+ was more easily accumulated on the surface area of the carbon steel, and thus more corrosion products were easily formed. Therefore, an insufficient O2 environment occurred because of obstruction by the corrosion product layer. It was found that Fe3O4 formed more easily when the dissolved oxygen was insufficient;10 the relevant reactions are shown in formulas (14) and (15).20 And this interpretation is consistent with Evans's theory,28,29 which explained the mechanism during the dehydration process with the formation of the corrosion products of carbon steel. Thus, the corrosion products in agar consisted of γ-FeOOH and a little Fe3O4:
| 8γ-FeOOH + Fe → 3Fe3O4 + 4H2O | (14) |
| Fe2+ + 8γ-FeOOH + 2e− → 3Fe3O4 + 4H2O | (15) |
Furthermore, when the supply of oxygen was more insufficient, the location where the electrode reaction went on gradually migrated from the interface between the matrix and liquid films to the interface between the inner and outer rust layers. Thus, the Fe3O4 was oxidized to form α-FeOOH according to formula (16), and so α-FeOOH was detected in the corrosion products in kaolin owing to the lower diffusion rate.
| 3Fe3O4 + 3/4O2 + 9/2H2O → α-FeOOH | (16) |
Moreover, based on the SKP results above, the diffusion models of the iron ions and corrosion products of carbon steel are shown in Fig. 9. The models include a carbon steel substrate, a corrosion product layer with a good crystalline structure containing oxide and oxy-hydroxide, a diffusion zone composed of a mixture of corrosion products and soil medium, and an outer soil medium zone.
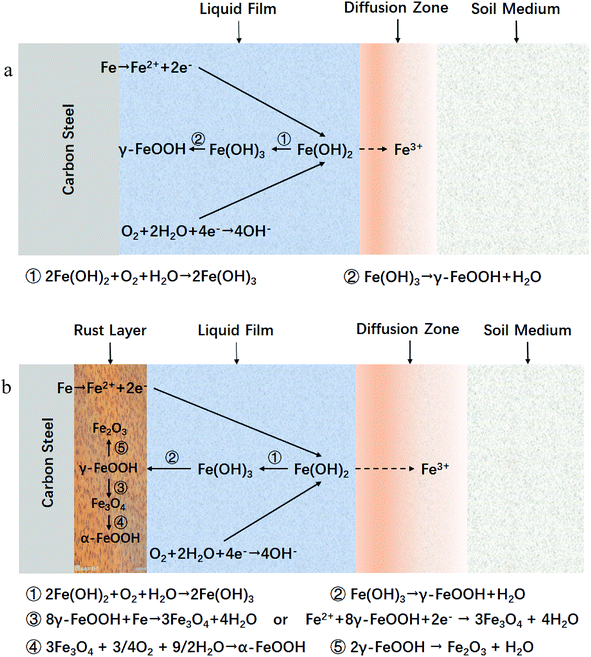 | ||
| Fig. 9 Corrosion products and the iron ion diffusion models of carbon steel, (a) the initial stage in corrosion processes and (b) development stage associated with the supplement of oxygen. | ||
4. Conclusions
(1) The formation of the corrosion products was determined by the cation diffusion coefficient, which furthermore affected the corrosion processes of the carbon steel.(2) The corrosion products in the three different environments were different. The analyses of the corrosion products indicated that the corrosion products in kaolin were mainly α-FeOOH and α-Fe2O3; however, in agar gel, they were γ-FeOOH. From the analysis of morphology, the corrosion products in agar gel were densest, which offered a protective effect to the carbon steel, and the protection was stronger than that of the “petal-like” corrosion products in kaolin medium;
(3) The SKP analysis of Q235 carbon steel in a simulated soil environment indicated that the changes in potential of the cross section at each interface could clearly reflect the beginning of the corrosion processes in the soil environment. And the variation and distribution of the potential value in the kaolin zone reflected the state of diffusion of the metal ions. As time passed, the diffusion zone and rust layer became obviously wider.
Conflicts of interest
There are no conflicts to declare.Acknowledgements
This work was supported by the National Key Research and Development Program of China (Grant No. 2017YFB0304602), the National Basic Research Program of China (973 Program, No. 2014CB643300), the National Natural Science Foundation of China (No. 51271032), and the National Environment Corrosion Platform (NECP).References
- Z. Wang, X. U. Chun and X. Dong, Chin. J. Chem. Eng., 2008, 16, 99 Search PubMed.
- S. Handley-Sidhu, N. D. Bryan, P. J. Worsfold, D. J. Vaughan and F. R. Livens, Chemosphere, 2009, 77, 1434 CrossRef CAS PubMed.
- S. Tang, X. Wang, S. Liu, H. Yang, Y. F. Xie and X. Yang, Chemosphere, 2017, 178, 119 CrossRef CAS PubMed.
- X. Li, D. Zhang, Z. Liu, Z. Li, C. Du and C. Dong, Nature, 2015, 527, 441 CrossRef CAS PubMed.
- B. Hou, X. Li, X. Ma, C. Du, D. Zhang, M. Zheng, W. Xu, D. Lu and F. Ma, Npj Materials Degradation, 2017, 1, 4 CrossRef.
- X. H. Nie, X. G. Li, C. W. Du, Y. Z. Huang and H. Du, J. Raman Spectrosc., 2009, 40, 76 CrossRef CAS.
- F. Xie, D. Wang, C. X. Yu, Y. Zhang and M. Wu, Int. J. Electrochem. Sci., 2017, 12, 9565 CrossRef CAS.
- P. J. Han, R. Z. Xie, N. M. Lin and B. He, Int. J. Electrochem. Sci., 2016, 11, 9491 CrossRef CAS.
- J. Skopp and D. McCallister, Soil Sci. Soc. Am. J., 2016, 11, 617 Search PubMed.
- Y. H. Huang and T. C. Zhang, Water Res., 2005, 39, 1751 CrossRef CAS PubMed.
- S. J. Oh, D. C. Cook and H. E. Townsend, Hyperfine Interact., 1998, 112, 59 CrossRef CAS.
- X. Zhang, S. Yang, W. Zhang, H. Guo and X. He, Corros. Sci., 2014, 82, 165 CrossRef CAS.
- P. Colomban, S. Cherifi and G. Desper, J. Raman Spectrosc., 2008, 39, 881 CrossRef CAS.
- K. Xiao, C. F. Dong, X. G. Li and F. W. J. Wang, J. Iron Steel Res. Int., 2008, 15, 428 Search PubMed.
- E. E. Oguzie, I. B. Agochukwu and A. I. Onuchukw, Mater. Chem. Phys., 2006, 84, 1 CrossRef.
- W. Wu, X. Chen, H. Hou, B. Liu and X. Li, Appl. Surf. Sci., 2018, 436, 80 CrossRef CAS.
- D. Holthusen, A. A. Brandt, J. M. Reichert and R. Horn, Soil Tillage Res., 2018, 117, 113 CrossRef.
- K. S. Lim, N. Yahaya, N. M. Noor, S. N. F. M. M. Tahir and J. K. Paik, Ships Offshore Struc., 2017, 12, 991 CrossRef.
- S. Wang, C. Du, X. Li, Z. Liu, M. Zhu and D. Zhang, Prog. Nat. Sci.: Mater. Int., 2015, 25, 242 CrossRef CAS.
- X. Zhang, K. Xiao, C. F. Dong, J. S. Wu, X. G. Li and Y. Z. Huang, Eng. Failure Anal., 2011, 18, 1981 CrossRef CAS.
- K. Xiao, X. Zhang, C. F. Dong, D. Wei, C. Wang and X. G. Li, J. Wuhan Univ. Technol., 2012, 27, 27 CrossRef CAS.
- R. M. Cornell and U. Schwertmann, The iron oxides: structure, properties, reactions, occurrences and uses, Wiley-VCH, Weinheim, 2003 Search PubMed.
- W.-C. Reak, T. Kang, H.-T. Shon and Y. T. Kho, Electrochim. Acta, 2001, 46, 2321 CrossRef.
- K. Hoffmann and M. Stratmann, Corros. Sci., 1993, 34, 1625 CrossRef CAS.
- M. Stratmann, Corros. Sci., 1987, 27, 869 CrossRef CAS.
- T. Ujihara, K. Fujiwara, G. Sazaki and N. Usami, J. Cryst. Growth, 2002, 241, 387 CrossRef CAS.
- J. Vedelago, A. Quiroga and M. Valenta, Radiat. Eff. Defects Solids, 2014, 169, 845 CrossRef CAS.
- U. R. Evans, Corros. Sci., 1969, 9, 8131 CrossRef.
- U. R. Evans and C. A. Taylor, J. Corros. Sci. Eng., 1972, 12, 227 CrossRef CAS.
Footnote |
| † Electronic supplementary information (ESI) available. See DOI: 10.1039/c8ra08032a |
| This journal is © The Royal Society of Chemistry 2018 |

