DOI:
10.1039/C8RA08008A
(Review Article)
RSC Adv., 2018,
8, 42233-42245
In situ fabrication of a direct Z-scheme photocatalyst by immobilizing CdS quantum dots in the channels of graphene-hybridized and supported mesoporous titanium nanocrystals for high photocatalytic performance under visible light†
Received
27th September 2018
, Accepted 23rd November 2018
First published on 18th December 2018
Abstract
We report the considerable advantages of direct Z-scheme photocatalysts by immobilizing high-quality CdS quantum dots (QDs) in the channels of graphene-hybridized and supported mesoporous titania (GMT) nanocrystals (CdS@GMT/GR) under facile hydrothermal conditions. The photocatalysts have been characterized by XRD, PL, XPS, SEM, DRS, TEM, EIS, and N2 adsorption. CdS QDs primarily serve as photosensitizers with a unique pore-embedded structure for the effective utilization of the light source. This direct Z-scheme CdS@GMT/GR exhibits higher photocatalytic activity than CdS/GR, GMT/GR, or CdS@MT. In addition, the rate constant of CdS@GMT/GR-2 is approximately twice the sum of those of CdS@MT and GMT/GR, because GR played the role of hole-transporting and collection layer as well as the hybridization level formation in terms of hybridizing MT and serving as a support. Therefore, the GR content tunes the energy band, affects the surface area, and controls the interfacial hole transfer and collection rate of the direct Z-scheme system. Furthermore, CdS@GMT/GR retains its high performance in repeated photocatalytic processes. This can be attributed to the fact that GR prevents QDs from photocorrosion by means of the hole-transporting and collection effect. A possible reaction mechanism is proposed. This work provides a promising strategy for the construction of highly efficient visible-light-driven photocatalysts to reduce the growing menace of environmental pollution.
1. Introduction
Over the past two decades, considerable efforts have been expended in developing efficient and stable semiconductors for photocatalysis under solar irradiation to reduce the growing menace of environmental pollution.1–7 Among sensitized solar materials, quantum dots (QDs) have gained particular interest to serve as photosensitizers due to their combined advantages of low cost, mechanical flexibility, solution processability, bandgap tunability, suitability for large-surface-area film fabrication, and designability.4–7 Due to these benefits, QD-sensitized solar catalysts (QDSSCs) have attracted widespread attention. A plethora of architectures for QDSSCs employing inorganic QDs, such as CdS,8 CdSe,9 PbS,10 InP,11 PbSe,12 and InAs,13 adsorbed onto wide-bandgap semiconducting oxides like ZnO, TiO2, and SnO2, have hitherto been proposed, and their applicability to visible-light harvesting has been investigated. Among QD materials, CdS has been one of the most representative materials as a stable and efficient photoabsorber because its optical bandgap can be readily tuned from 0.3 to 1.6 eV and its response in the near-infrared region makes CdS QDs suitable for a wide range of applications.8,14,15 Meanwhile, TiO2 has been recognized as one of the most promising semiconductors due to its unique properties, such as strong oxidation ability, biological and chemical inertness, low cost, etc.1,2 Several groups have reported the use of CdS QDs as stable and efficient photoabsorbers in TiO2-based heterojunction systems.16,17 However, in traditional heterojunction systems, there remains a disadvantage in which the oxidation and reduction abilities derived from photoinduced holes and electrons, respectively, are weakened after charge transfer.18 However, in a Z-scheme system, the strong redox potential of photogenerated charge carriers can also be retained.19–21 However, the photocatalytic ability of Z-scheme photocatalysts is also limited by the fast recombination of the photoinduced electron–hole pairs, and enormous efforts have been made to overcome this issue. One approach to alleviate the problem of poor electron transport and charge separation in the crystal and/or on the surface of Z-scheme photocatalysts involves the tethering of graphene (GR) to a semiconducting oxide couple.22,23 Some previous reports on GR-based Z-scheme photocatalysts,24–27 such as metal sulfides/GR/CoOx-loaded BiVO4,24 TiO2/CdSe QDs/functionalized graphene oxide (GO) nanosheets,25 TiO2 nanotube array/GR/CdS QDs,26 and a CdS/reduced GO/TiO2 core–shell nanostructure,27 have successfully demonstrated the role of GR in enhancing charge transport and transfer. Despite several reports on TiO2, CdS QDs, and GR composites in Z-scheme systems, GR was selected as a solid electron mediator for promoting electron transport and to serve as an electron sink without a direct Z-scheme.26,27 It is well known that a third-generation Z-scheme photocatalytic system, namely, the direct Z-scheme photocatalyst, has more advantages than the previous two generations.21,28 However, to the best of our knowledge, the fabrication of a CdS@GMT/GR direct Z-scheme photocatalyst with QDs confined in the channels of GMT, with GR as a hole-transporting and collection layer in addition to hybridizing MT and serving as a support, has not hitherto been reported. Meanwhile, the application of Z-scheme photocatalytic systems in the photocatalytic degradation of pollutants has not yet received widespread attention.
2. Experimental section
2.1. Materials
Butyl titanate, hydrochloric acid (HCl), 1-hexadecyl-3-methyl imidazolium bromide (C20H39N2Br, >98%) ionic liquid (IL), sodium sulfide (Na2S), cadmium nitrate (Cd(NO3)2), golden orange II (GOII), and terephthalic acid (TA) were purchased from Jishou Chemical Glass Instrument Co., Ltd., as analytically pure reagents. GO and deionized water were prepared in the laboratory.
2.2. Synthesis
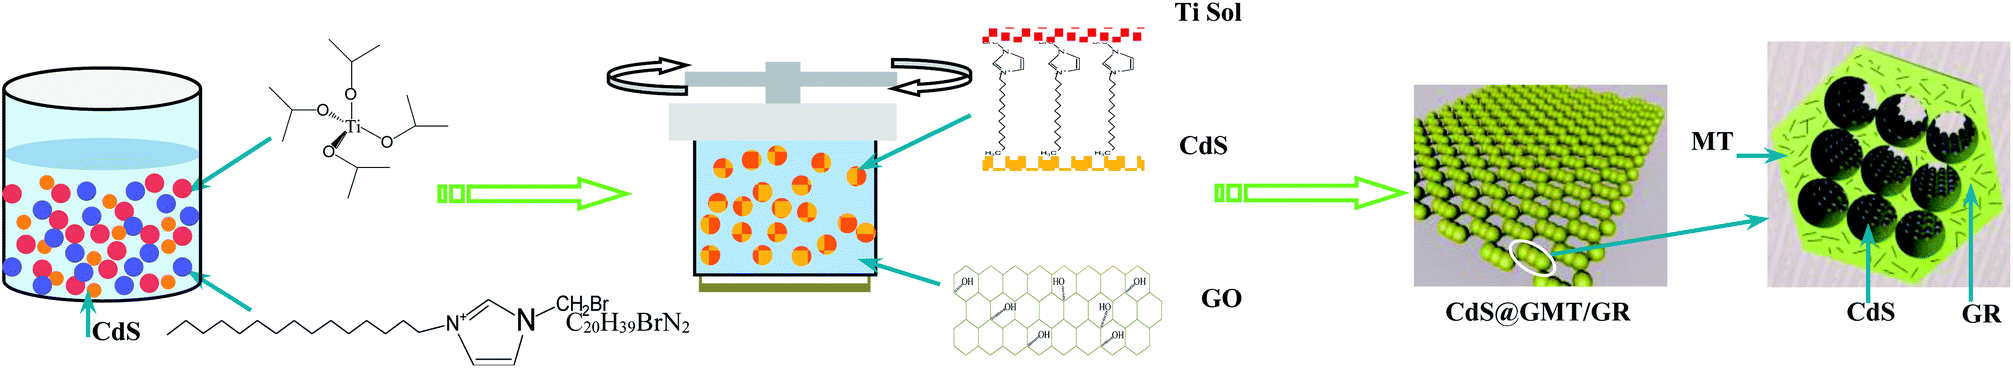
Preparation of the direct Z-scheme CdS@GMT/GR photocatalyst is shown in Scheme 1.
 |
| | Scheme 1 Synthesis of a direct Z-scheme CdS@GMT/GR photocatalyst. | |
Synthesis of CdS QDs and their modification with IL (IL-CdS). CdS QDs were synthesized by an ion precipitation method.11 In a typical synthesis process, Na2S and Cd(NO3)2 were each dispersed in water at 0.01 mol L−1; then, the respective solutions were adjusted to pH 2.0 with HCl. After stirring for more than 30 min at room temperature, the Cd(NO3)2 solution was further stirred at 100 °C by immersing the flask in an oil bath. Thereafter, the Na2S solution was added dropwise to the Cd(NO3)2 solution with stirring over a period of 30 min. After cooling to room temperature, the product was purified by repeated precipitation and centrifugation with ethanol and deionized water. Finally, the obtained powder was dried at 60 °C overnight. Then, 1-hexadecyl-3-methyl imidazolium bromide (C20H39BrN2) IL is dissolved in water at a concentration of 10 g L−1. Further, the prepared CdS QD water solution was mixed in a 1![[thin space (1/6-em)]](https://www.rsc.org/images/entities/char_2009.gif) :1 weight ratio and placed in a rectangular glass cell, and the mixture was gently stirred at 0 °C in an ice-water bath to form IL-CdS.
:1 weight ratio and placed in a rectangular glass cell, and the mixture was gently stirred at 0 °C in an ice-water bath to form IL-CdS.
Synthesis of CdS@MT. Titanium sol was prepared by the same method as reported earlier.2 Subsequently, the requisite amount of the prepared IL-CdS solution was added dropwise to the stirred titanium sol to form a Ti-coated IL-CdS sol. The mixture was then transferred to a 50 ml Teflon-lined stainless steel autoclave and subjected to solvothermal reaction at 180 °C for 12 h. The product was then cooled to room temperature, separated by centrifugation, and washed three times with acetone and once with absolute ethanol. It was then dried in an electric oven at 80 °C for 12 h and calcined at 400 °C in air for 1 h, yielding CdS@MT nanocomposites with QD weight ratios of 2%.
Synthesis of GO, CdS@GMT/GR, GMT/GR, and CdS/GR. GO was synthesized from natural graphite powder by a modified Hummers method.29,30 A certain amount of GO was dispersed in deionized water (30 ml) and stirred for 1 h to obtain a uniform suspension. The Ti-coated IL-CdS sol, with the same CdS content as CdS@MT (2%), was then added to the suspension, and stirring was continued for a further 0.5 h. The obtained mixture was transferred to a 50 ml Teflon-lined autoclave and maintained at 180 °C for 12 h. Following the same steps as those for the CdS@MT synthesis, a series of CdS@GMT/GR samples with theoretical 90 wt%, 85 wt%, and 80 wt% GR were obtained, denoted as CdS@GMT/GR-1, CdS@GMT/GR-2, and CdS@GMT/GR-3, respectively. The synthesis methods for GMT/GR and CdS/GR were the same as that for CdS@GMT/GR, and the ratios of GMT to GR in GMT/GR and of CdS to GR in CdS/GR were also the same as that in CdS@GMT/GR.
2.3. Characterization
Wide-angle X-ray diffraction (WAXRD) and small-angle X-ray scattering (SAXS) patterns were obtained on a Bruker D2 Phaser diffractometer using Cu-Kα radiation (λ = 1.5418 Å) and a Nanostar U SAXS system (Bruker, Germany) using Cu-Kα radiation (40 kV, 35 mA), respectively. SEM images were obtained with the Hitachi S3400N (Japan) instrument. High-resolution transmission electron microscopy/selected-area electron diffraction (HRTEM/SAED) was performed on a JEOL JEM2100 (Japan) instrument. X-ray photoelectron spectroscopy (XPS) analysis was carried out on a Thermo Fisher Scientific VG Multilab 2000 X (US) instrument. Ultraviolet/visible (UV-vis) diffuse-reflectance spectra (DRS) were recorded on a spectrophotometer (Agilent, Inc., Cary 5000, US). Photoluminescence (PL) spectra were measured on a spectrometer (Edinburgh FLS980, UK). Raman spectra were obtained from a Thermo Fisher Scientific DXR2xi (US) instrument. EIS experiments were conducted from 0.1 Hz to 100 kHz in order to investigate the internal resistance and capacity of the electrode material. Brunauer–Emmett–Teller (BET) technique was used to determine the surface area and pore size distribution by recording nitrogen adsorption–desorption isotherms (ASAP2010, Micromeritics Co., US) at 77 K.
2.4. Photocatalytic measurements
The photocatalytic activities of the prepared photocatalysts were examined through the decomposition of GOII under visible-light irradiation (a 300 W high-pressure Hg lamp with a UV filter). In a typical photocatalytic reaction, GOII (10 mg) was dissolved in deionized water (20 ml) containing 1 g l−1 catalyst. The photocatalytic process and reactor were described in an earlier report.2
2.5. Analysis of hydroxyl radicals
Hydroxyl radicals (·OH) were detected by the PL method using TA as a probe molecule. In a typical procedure, 10 mg of the respective photocatalyst was dispersed in 10 ml of an aqueous solution of 1.5 × 10⁻⁴ M TA and 2 × 10⁻³ M NaOH. The photocatalytic reactor was described in an earlier report.2
3. Results and discussion
3.1. Morphology and structural characterization
The XRD patterns are shown in Fig. 1. Fig. 1a shows three diffraction peaks at 26.5, 44.0, and 52.1°, which are in good agreement with the main (111) reflection and two weaker (220) and (311) reflections of the standard cubic CdS (JCPDS: 80-0019), confirming the crystalline phase of the QDs in CdS/GR.31 In addition, the XRD patterns also reveal that the principal peaks, consistent with the crystalline phases of (101), (004), (200), (105), and (211), were found for both the CdS@GMT/GR-2 and GMT/GR nanocomposites, indicating that the obtained samples primarily consisted of the anatase phase. Meanwhile, there are no the peaks corresponding to CdS for CdS@GMT/GR-2. This phenomenon may be attributed to the small amount of CdS, Cd2+ in place of Ti4+ of the anatase crystal structure, and both peaks overlap for CdS (111) and anatase (101) located at 2θ = 26.5°.32 The average crystallite sizes of anatase and QDs, calculated from the main diffraction peaks of anatase (101) and CdS (002) using Scherrer's equation, are listed in Table 1. The crystallite sizes of 19.6 and 17.2 nm were calculated for GMT in the CdS@GMT/GR-2 and GMT/GR nanocomposites, respectively. These results reveal that the incorporation of CdS QDs could effectively promote crystallite growth. All the CdS@GMT/GR samples had almost the same crystallite sizes (about 19.6 nm for anatase; 5.5 nm for QDs), indicating that the amount of GR has no obvious influence on the crystallite size, as revealed by the TEM results shown in Fig. 4 (vide infra). The SAXS measurements of the obtained samples are shown in Fig. 1b. Pure MT showed one intense diffraction peak at 2θ ≈ 0.55° due to the removal of the organic group from the IL template (ESI 1†), indicating that a well-organized mesostructure had been formed. CdS@GMT/GR-2 still produced a (100) peak, indicating that the well-organized mesostructure was preserved during the embedding of QDs and the hybridization with GR, although it was broadened, suggesting some degradation of this mesostructure. No SAXS diffraction peak was detectable for TiO2 nanoparticles (TN) prepared by the same method, but without the IL template. The SAXS results demonstrate that the current approach for introducing GR and CdS QDs into MT is effective, with at least the partial preservation of mesoporosity.
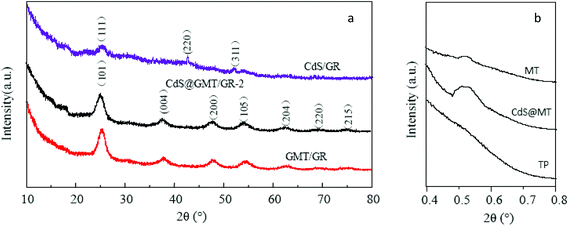 |
| | Fig. 1 WAXRD patterns (a) and SAXS patterns (b) of the obtained samples. | |
Table 1 Average crystal size and elemental content of the obtained samples
| Samples |
Average crystal sizea (nm) |
Element contentb (%) |
| anatase |
QDs |
Ti |
C |
Cd |
S |
O |
| Average crystal size calculated from the Scherrer's equation. Elemental content (%) represents the ratio Ai/∑Ai (Ai is the area of each peak) obtained by EDS. |
| MT |
17.7 |
— |
32.7 |
1.5 |
— |
— |
65.8 |
| GMT/GR |
17.2 |
— |
4.3 |
87.1 |
— |
— |
8.6 |
| CdS/GR |
— |
9.1 |
— |
92.8 |
3.0 |
3.2 |
1.0 |
| CdS@GMT/GR-2 |
19.6 |
8.5 |
11.2 |
44.1 |
3.2 |
3.3 |
38.2 |
| CdS@GMT/GR-1 |
19.7 |
8.4 |
10.3 |
47.7 |
2.9 |
3.1 |
36.0 |
| CdS@GMT/GR-3 |
19.4 |
8.5 |
12.7 |
40.0 |
3.9 |
4.1 |
40.3 |
As shown in Fig. 2, the three samples exhibit four prominent Raman bands at ca. 140, 393, 513, and 633 cm−1, corresponding to the Eg, B1g, B1g + A1g, and Eg modes, respectively.33,34
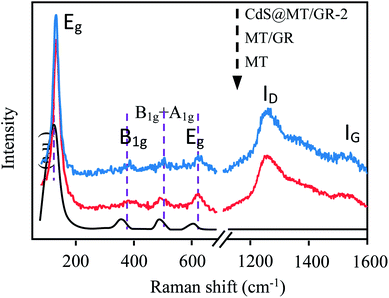 |
| | Fig. 2 Raman spectra of the obtained samples. | |
These bands can be attributed to the typical anatase phase of MT.33,34 Therefore, the Raman spectra are consistent with the XRD results shown in Fig. 1. Moreover, besides the predominant MT features, two prominent D (1282 cm−1) and G (1566 cm−1) peaks are observed for the GMT/GR and CdS@GMT/GR-2 samples, attributable to the breathing mode of the k-point phonons of the A1g symmetry and E2g phonons of sp2 C atoms, respectively.33,35 When compared with the intensity ratio (ID/IG) of bare GO nanosheets (0.81) (ESI 2†), the ID/IG ratios for the GR in GMT/GR and CdS@GMT/GR-2 were evaluated to be about 1.33 and 1.57, respectively. The increase in ID/IG may be attributed to the reduction and restoration of the sp2 network of GO after the hydrothermal reduction process.33,36 Interestingly, ID/IG for CdS@GMT/GR was found to be greater than that for GMT/GR, confirming the facile regeneration of the conjugated network in the former. Moreover, the four prominent peaks of the Eg, B1g, B1g + A1g, and Eg modes for the GMT component in GR-based samples shifted to higher frequencies when compared with those for bare MT due to the phonon confinement effect between TiO2 and GR.37 No obvious Raman peak of CdS phase was seen in CdS@GMT/GR due to its quantum size effect and its confinement in the channels of MT. However, the presence of CdS could be verified by TEM and XPS measurements.
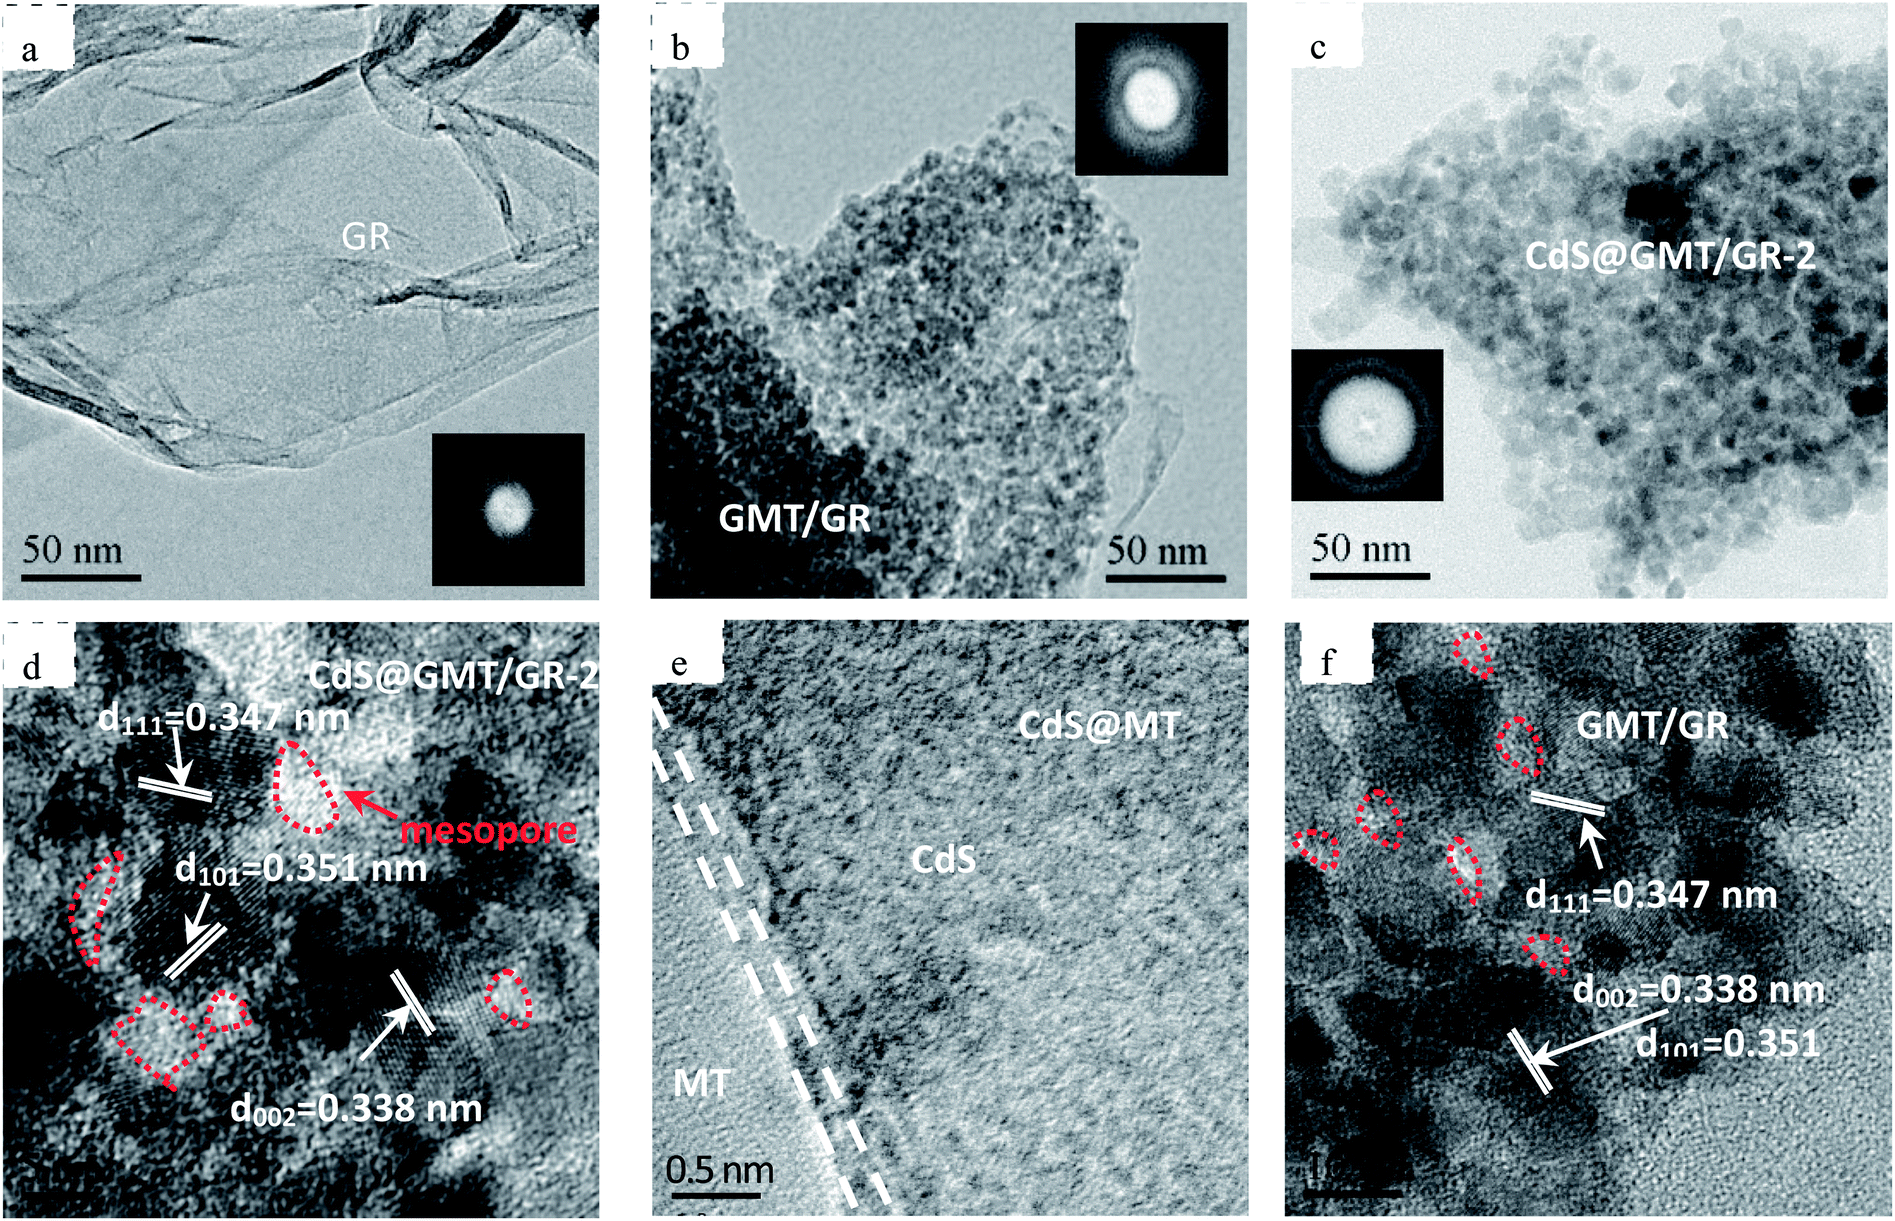
As shown in Fig. 3a, the nanoparticles were evenly spread on the GR surface in CdS@GMT/GR-2. From Fig. 3b, it is evident that there was no apparent difference in the morphology between pure GR and CdS@GMT/GR-2. The formation of the CdS@GMT nanoparticle phase had a marginal impact on the morphology of GR. Moreover, elemental mapping was carried out to determine the elemental distribution. As shown in the lower panels of Fig. 3, C, Cd, S, Ti, and O were observed to be present in the testing area with even distribution, indicating that CdS and GMT nanoparticles uniformly covered the GR. In addition, it is obvious that the densities of Ti and O were greater than those of Cd and S, in accordance with their contents analyzed by EDS (ESI 3†), as listed in Table 1. Fig. 4a shows a low-magnification image of the GR, showing it to be entangled with wrinkles and folds on its surface and edges. The overlapping GR produced crisscross lattice fringes, and the electron diffraction pattern exhibited a dim ball, indicating poor crystalline quality. An image of the GMT/GR also revealed layers of crinkled GR, and the size of the GMT on the GR was estimated to be 17.2 nm (Fig. 4b). CdS@GMT/GR-2 retains the layered structure of GR, and exhibits a smaller size (ca. 19 nm) than that of CdS@MT (ca. 22 nm) (ESI 4†), which is in good agreement with the XRD analyses (see Table 1). The electron diffraction patterns of both GR-supported samples (insets in Fig. 4b and c) reveal that the degree of crystallinity of the GR nanosheets was increased by coating on MT, and CdS@GMT/GR-2 showed bright arrays, confirming the high crystallinity of GR nanosheets. In some regions, distinctive lattice spacings from MT with a periodicity of 0.347 nm (JCPDS: 89-4921) and a fringe separation of 0.351 nm are consistent with the face-centered cubic lattice of CdS (JCPDS: 65-2870). Meanwhile, GR with dark fringes at 0.338 nm was separated from CdS embedded in the GMT and the latter was anchored on GR nanosheets (Fig. 4d). The direct confinement of QDs in the channels of MT can be attributed to the effects of the IL template and navigation (ESI 1†). The pore-embedded structure, being similar to a core–shell structure, showed high light-harvesting efficiency, resulting in a significantly enhanced visible-light photocatalytic performance.38,39 Further evidence affirming the attachment of QDs to MT was obtained in the form of a clear interface, as shown in Fig. 4e, wherein the bright and dark fringes originate from MT and CdS, respectively. The change in the contrast of the lattice fringes at the boundary of the two moieties is due to the molecular-level linking between them. To further investigate the effects of CdS QDs on the structure and morphology of CdS@GMT/GR, the interaction between the components of GMT/GR is shown in Fig. 4f for comparison. The GMT is heterogeneously flanked by GR nanosheets, and the GR is also grafted onto the MT lattice. There is no obvious difference in the contrast for GMT/GR, which suggests no effect of QDs on the structure of GMT or interaction between MT and GR.
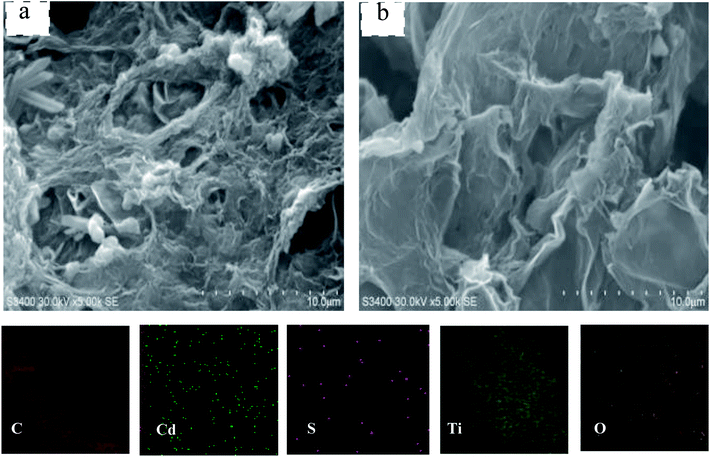 |
| | Fig. 3 SEM of the CdS@GMT/GR-2 (a) and pure GR (b). | |
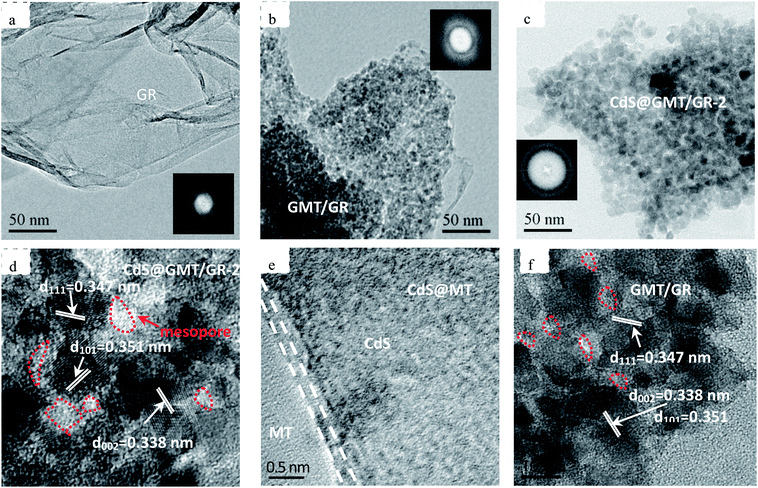 |
| | Fig. 4 TEM with SAED of GR (a), GMT/GR (b), and CdS@GMT/GR-2 (c). HRTEM of CdS@GMT/GR-2 (d), CdS@MT (e), and GMT/GR (f). | |
3.2. Optical absorption and chemical properties
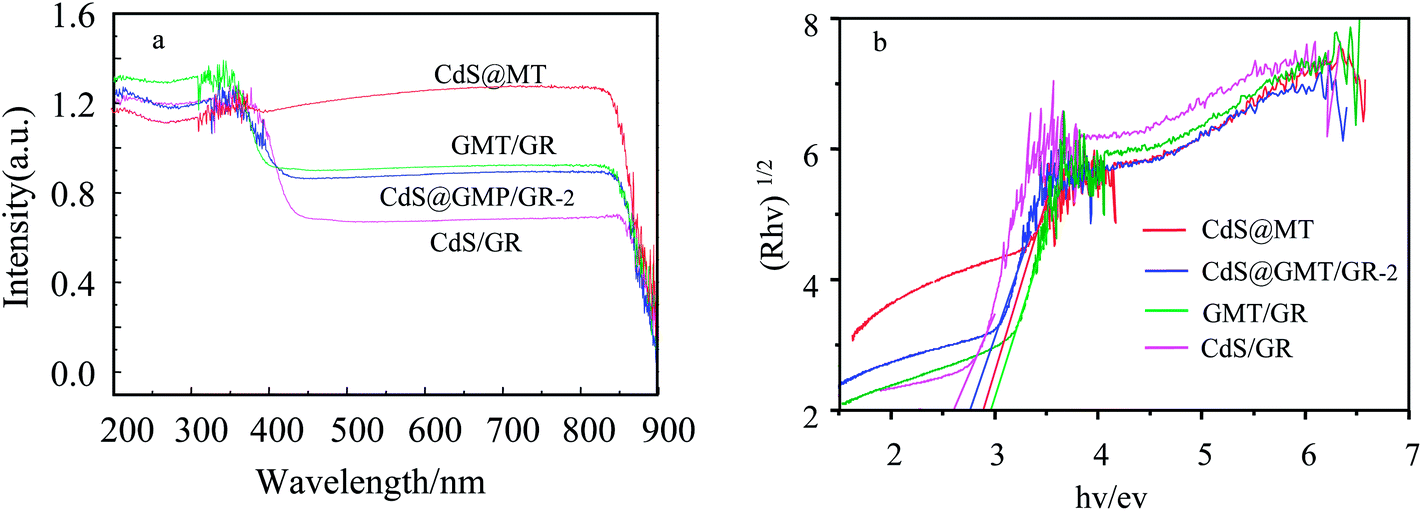
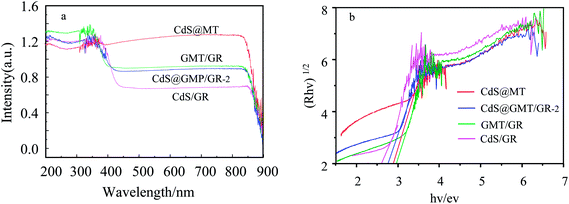
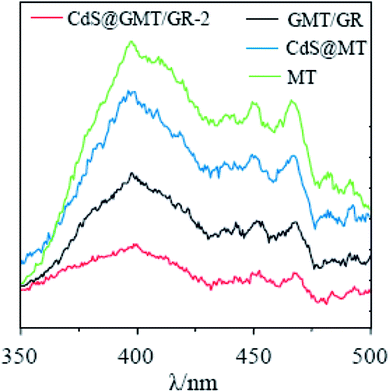
As shown in Fig. 5a, the absorption of MT (ESI 5†) was red-shifted by 27 nm following the incorporation of GR, indicating the interaction between TiO2 and GR to form GMT.40–42 As compared to the UV-vis spectrum of CdS QDs (ESI 5†), CdS/GR shows strong absorbance in the visible-light region due to GR acting as an electron collector/transporter and a light harvester. Owing to the sensitizing effect of CdS on GMT/GR and MT, a new optical absorption edge appears, which is characteristic of QDs. Moreover, when compared with those of CdS@MT, CdS/GR, and GMT/GR, the characteristic absorption edge of CdS@GMT/GR-2 is red-shifted, which can mainly be attributed to synergistic effects among the three different components. The bandgap energies of the samples can be estimated from the plots in Fig. 5b by the Kubelka–Munk function (F(R∞) = (1 − R)2/(2R), where R is the reflectance).31 The bandgap energies (Eg) of CdS@MT, CdS/GR, and GMT/GR were determined as ca. 2.90, 2.60, and 2.95 eV, respectively, which suggests a light-responsive transition from the UV to the visible-light region. CdS@GMT/GR showed a narrower bandgap energy in the range 2.65 to 2.69 eV when compared with GMT/RG or CdS@MT (Table 2). In addition, along with the GR content the visible-light absorption intensity of CdS@GMT/GR also increased (ESI 6†), although the amount of GR has a marginal impact on the bandgap energy. As shown in Fig. 6, for the MT hybridized with GR, both the PL peaks of GMT/GR clearly decrease; therefore, the recombination of the photogenerated electron–hole pairs is restricted.43 When the MT is embedded with CdS, the PL peaks of CdS@MT also decrease because hole transfer from the valence band (VB) of TiO2 to that of CdS restricts this recombination.32,44 The PL intensity of CdS@GMT/GR-2 is lower than those of CdS@MT and GMP/GR, which can be mainly attributed to the large contact interface between the CdS confined in the channels of GMT anchored on GR. This can considerably accelerate the migration of charge carriers across the interface between the GMT and CdS QDs. In addition, CdS@GMT/GR-2 shows the lowest PL intensity among these composites because GR has a shielding effect on visible light, while also promoting charge separation (ESI 7†).
 |
| | Fig. 5 DRS spectra (a) and corresponding binding energy (b) of the obtained samples. | |
Table 2 Selected properties of the obtained samples
| Samples |
BGEa (eV) |
O 1s contentb (%) |
BETc (m2 g−1) |
Average pore sized (nm) |
Rate constante (×103 min−1) |
| O–Ti |
O–H |
| BGE represents bandgap energies estimated by UV-vis measurement. Content (%) represents the ratio Ai/∑Ai (Ai is the area of each peak) measured by XPS. BET surface area calculated from the linear part of the BET plot. BJH desorption average pore diameter. Rate constant calculated from the first-order kinetics. |
| MT |
3.17 |
91 |
9 |
136 |
3.05 |
— |
| GMT/GR |
2.95 |
77 |
23 |
213 |
3.48 |
2.1 |
| CdS@GMT/GR-2 |
2.67 |
75 |
25 |
179 |
3.39 |
12.9 |
| CdS@GMT/GR-1 |
2.65 |
69 |
31 |
200 |
3.24 |
8.3 |
| CdS@GMT/GR-3 |
2.69 |
79 |
21 |
167 |
3.42 |
6.5 |
| CdS@MT |
2.90 |
90 |
10 |
127 |
3.17 |
4.2 |
 |
| | Fig. 6 Photoluminescence (PL) spectra of the obtained samples. | |
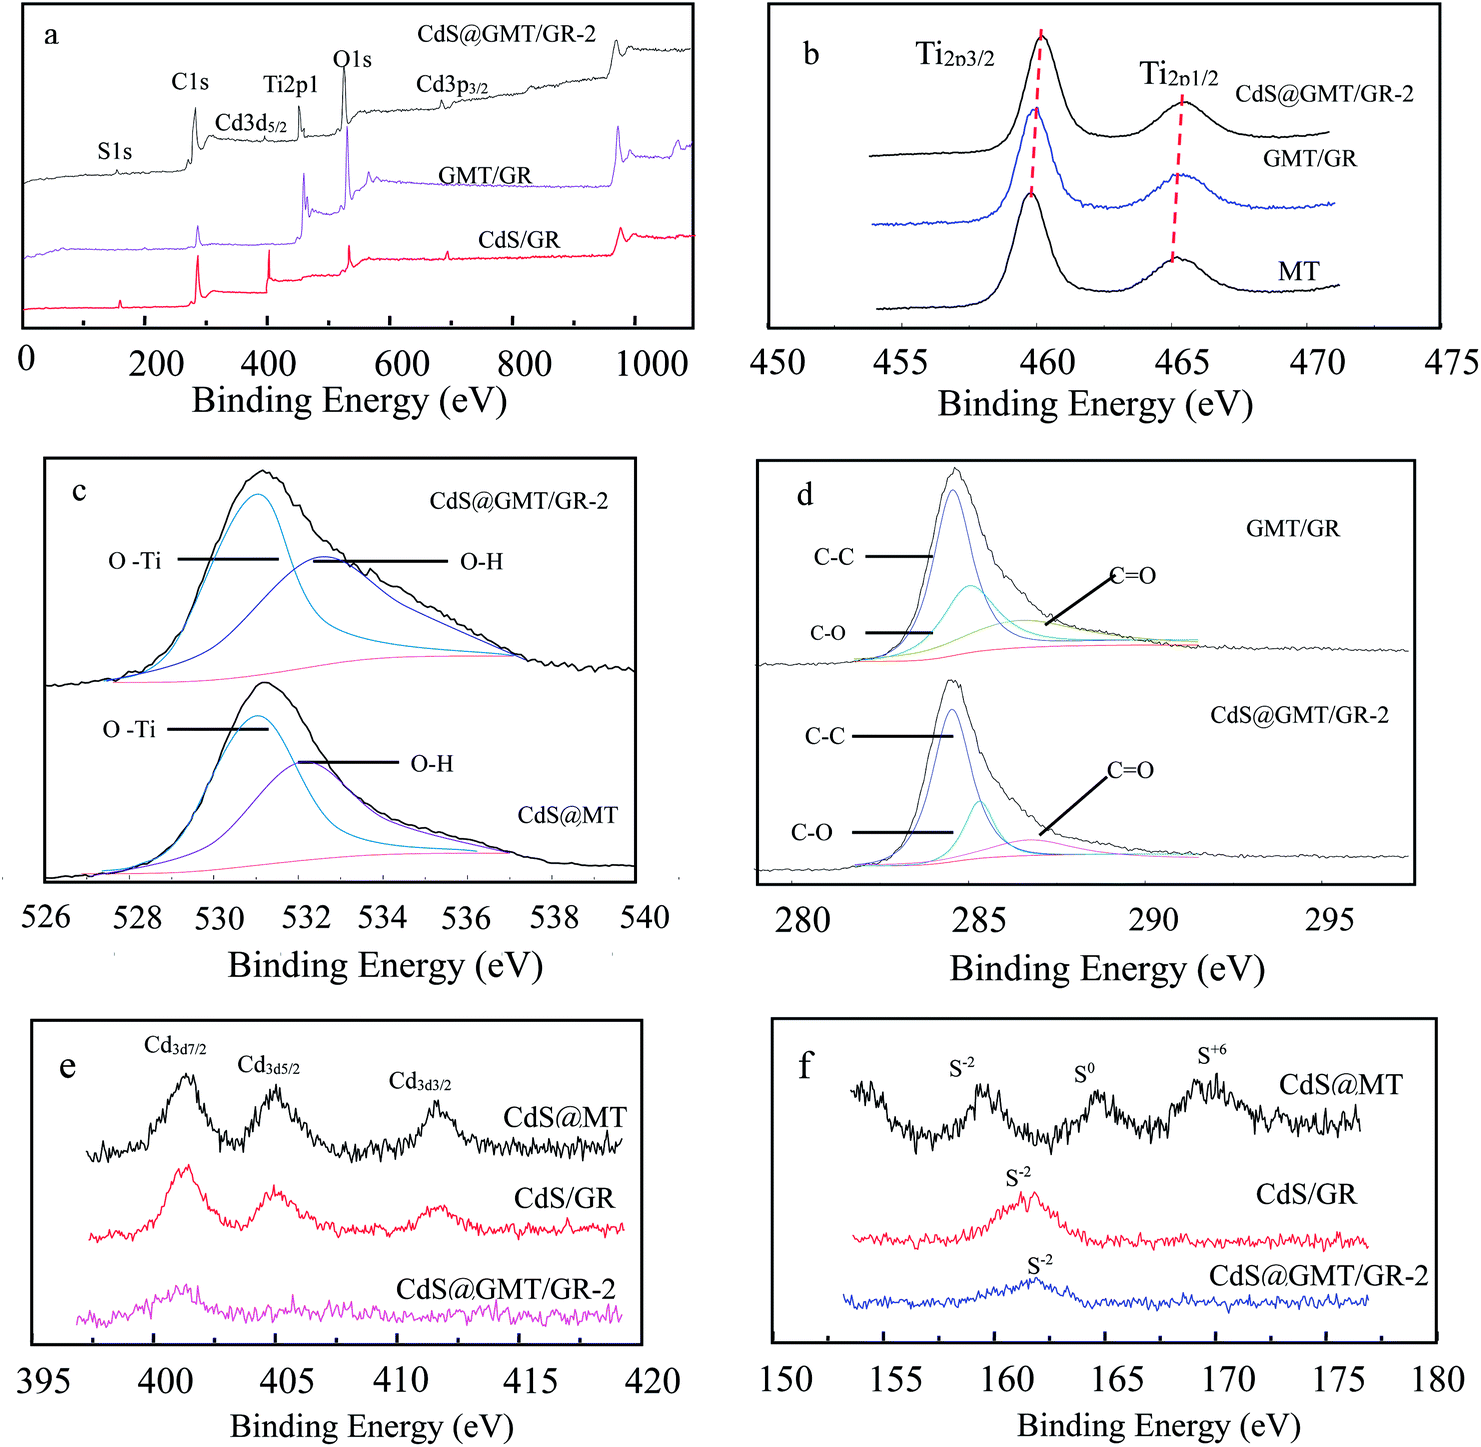
The chemical compositions and valences of the samples were studied by XPS analysis, as shown in Fig. 7. The full spectra of CdS/GR, GMT/GR, and CdS@GMT/GR-2 are shown in Fig. 7a, featuring the expected peaks of C, Ti, S, O, and Cd. Fig. 7b shows the fine spectrum of Ti 2p, in which it can be seen that Ti 2p of MT displays two typical values of TiO2 at 459.5 and 465.3 eV corresponding to the binding energies of Ti 2p3/2 and Ti 2p1/2, respectively.33,45,46 In the GR-based sample spectrum, the Ti 2p peaks indicate higher binding energies due to the chemical interaction between MT and GR sheets, leading to facilitated charge separation.47,48 These results suggest that GR plays the roles of both hole-transporting and collection layer and the MT-hybridization source.49,50 Correspondingly, CdS@MT shows a Ti 2p binding energy without a positive shift (ESI 8†). As shown in Fig. 7c, the obtained O 1s spectrum features two chemical states for oxygen, corresponding to Ti–O bonds (Eb = 531.4 eV) and hydroxyl groups (Eb = 532.5 eV).45 XPS curve-fitting results are also listed in Table 1. The OH content of the GR-based composites was higher than those of MT and CdS@MT, indicating that the water molecule adsorption on the GMT and CdS@GMT surface increased in the presence of the large-surface-area GR. This increase in surface OH content could enhance the photocatalytic activity due to its combining with surface-trapped holes to form ·OH radicals.21 The OH concentration obviously decreased with decreasing GR content due to the decrease in GR-based composite surface area (Table 2). As indicated in Fig. 7d, the XPS spectrum of C 1s in GMT/GR could be deconvoluted into three peaks at 284.5, 286.6, and 288.2 eV, attributable to sp2-bonded carbon (C–C), carbon–oxygen single bonds (C–O), and carbonyl groups (C![[double bond, length as m-dash]](https://www.rsc.org/images/entities/char_e001.gif) O). In contrast, in the XPS spectrum of C 1s in CdS@GMT/GR-2, the peak attributed to sp2-bonded carbon became predominant and those due to C–O and CO groups considerably decreased, indicating the removal of most oxygen functional groups and the regeneration of the conjugated network by hydrazine reduction. Fig. 7e shows the XPS spectra of Cd 3d7/2, Cd 3d5/2, and Cd 3d3/2. The corresponding binding energies are 401.5, 405.2, and 411.9 eV, indicating that Cd exists in the form of Cd2+ in CdS/GR.51,52 The spin orbital photoelectron peaks of S2− (2p3/2 and 2p1/2), S0 (2p1/2), and S6+ (2p1/2) for CdS/GR in Fig. 7f correspond to binding energies of 161.6 eV (S2−), 162.7 eV (S2−), 163.6 eV (S0), and 164.7 eV (S6+), respectively. These may be attributed to the photocorrosion processes of CdS in the presence and absence of H2O and O2 described by eqn (1) and (2), respectively:53,54
O). In contrast, in the XPS spectrum of C 1s in CdS@GMT/GR-2, the peak attributed to sp2-bonded carbon became predominant and those due to C–O and CO groups considerably decreased, indicating the removal of most oxygen functional groups and the regeneration of the conjugated network by hydrazine reduction. Fig. 7e shows the XPS spectra of Cd 3d7/2, Cd 3d5/2, and Cd 3d3/2. The corresponding binding energies are 401.5, 405.2, and 411.9 eV, indicating that Cd exists in the form of Cd2+ in CdS/GR.51,52 The spin orbital photoelectron peaks of S2− (2p3/2 and 2p1/2), S0 (2p1/2), and S6+ (2p1/2) for CdS/GR in Fig. 7f correspond to binding energies of 161.6 eV (S2−), 162.7 eV (S2−), 163.6 eV (S0), and 164.7 eV (S6+), respectively. These may be attributed to the photocorrosion processes of CdS in the presence and absence of H2O and O2 described by eqn (1) and (2), respectively:53,54
| | |
CdS (solid) + 4h+ (liquid) + H2O + O2 (gas) → Cd2+ (liquid) + SO42− (liquid) + 4H+ (liquid)
| (1) |
| | |
CdS (solid) + 2h+ (liquid) → Cd2+ (liquid) + S (solid)
| (2) |
where h
+ represents the photogenerated holes of CdS.
 |
| | Fig. 7 Surface XPS spectra of the samples (a) and the enlarged spectra of Ti 2p (b), C 1s (c), O 1s (d), Cd 3d (e), and S 2p (f). | |
Hence, the photocorrosion resistance of CdS is considerably improved by GR. Interestingly, the GR content also affected the antiphotocorrosion performance of CdS (ESI 9†), which is consistent with an earlier report.54
3.3. Photocatalytic activity
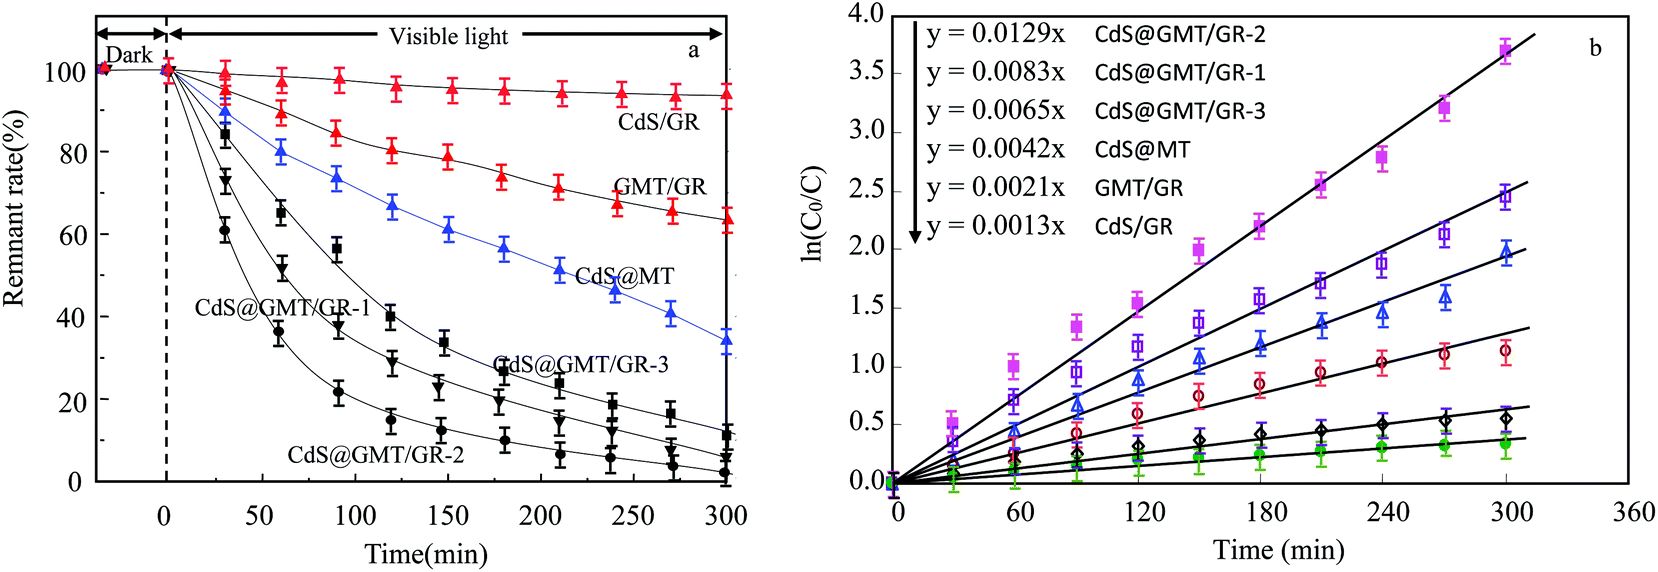
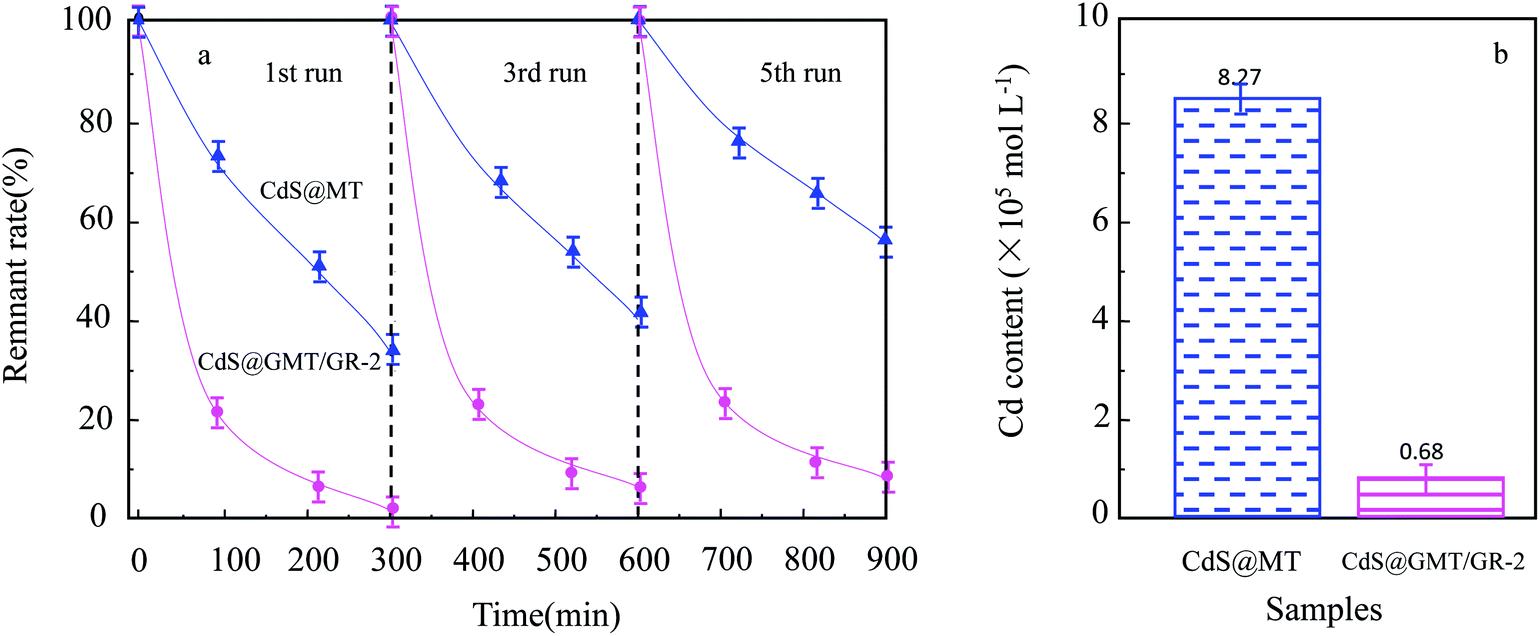
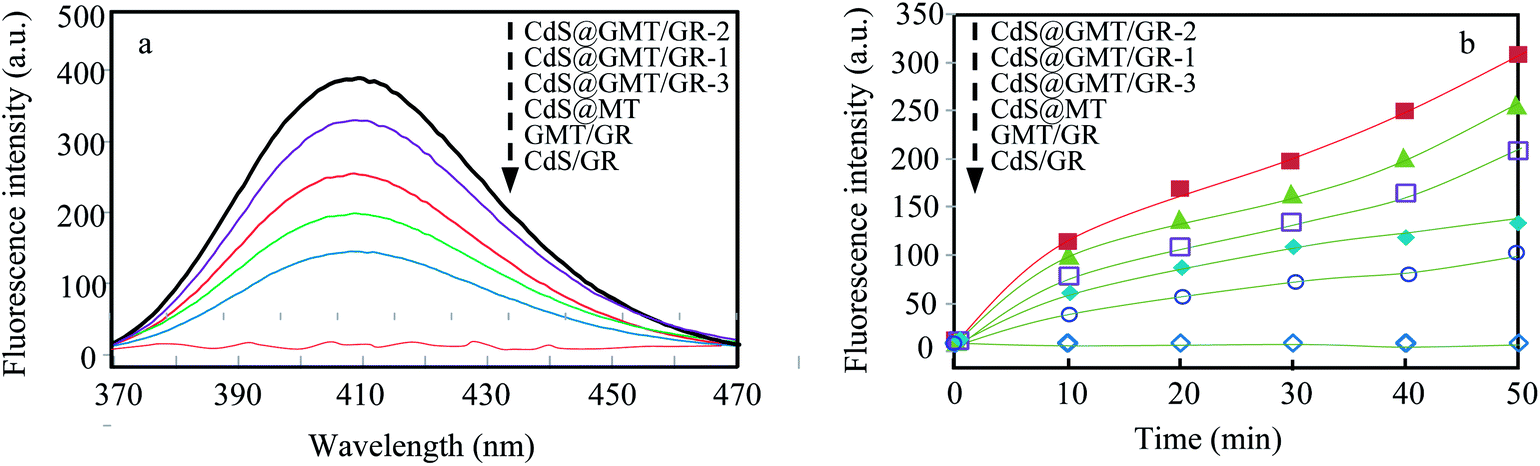
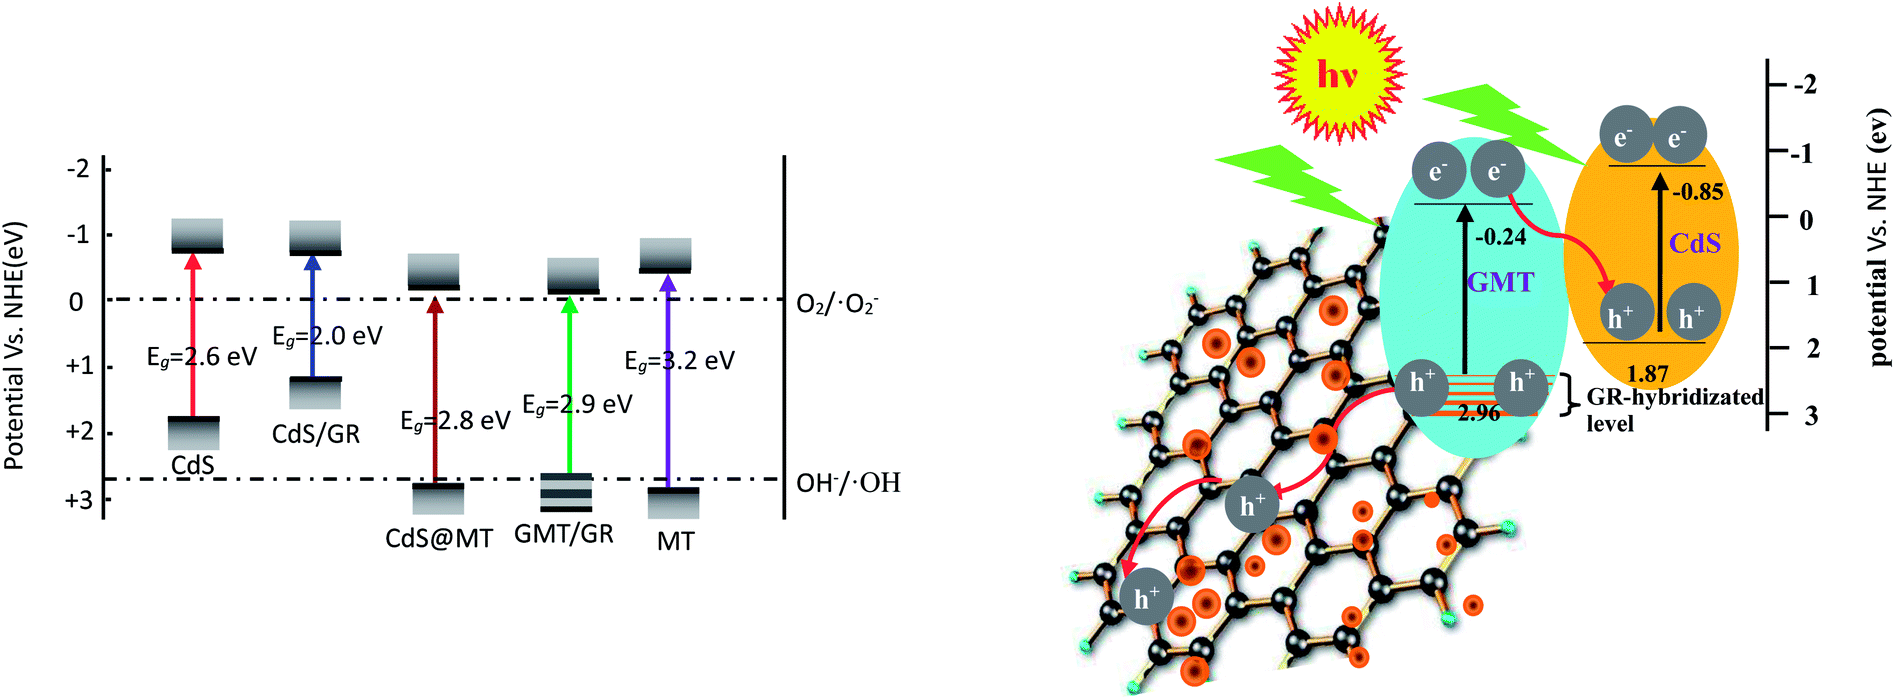
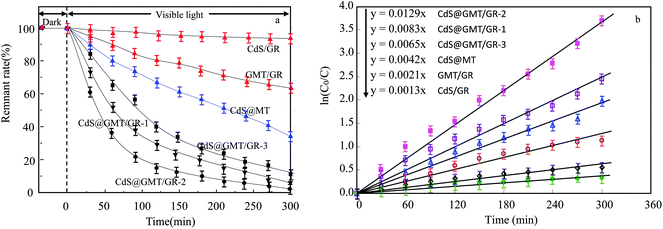
As shown in Fig. 8a, it was observed that the concentrations of GOII remained unchanged for all the samples without light irradiation. In addition, pure light exhibited a negligible effect on GOII degradation, verifying that the decomposition of GOII was triggered by photocatalytic reactions. CdS@MT and MT/GR showed some activity toward GOII decomposition and CdS@GMT/GR showed high photocatalytic activity, implying that the combination of GR and CdS QDs could synergistically enhance the photocatalytic performance. Moreover, the photocatalytic activity of CdS@GMT/GR was found to be highly dependent on the amount of incorporated GR. With increasing GR content, the photocatalytic activity of CdS@GMT/GR was firstly enhanced and then decreased. CdS@GMT/GR-2 showed the highest degree of GOII decomposition of 94%, which may be attributed to the shielding effect of GR on the active sites of CdS@GMT and the promotion of charge separation. The photocatalytic reaction rate described by linear fitting of quasi-first-order kinetics is shown in Fig. 8b. Evidently, the catalytic rate constant of CdS@GMT/GR-2 is approximately twice the sum of those of CdS@MT and GMT/GR. This can mainly be attributed to the synergistic effects of several factors, including the composite of a GR-hybridized anatase phase with a mesoporous structure, embedded QDs with good crystallinity, and highly conductive GR with a large surface area. Moreover, CdS@GMT/GR showed better activity retention (Fig. 9a) than CdS@MT after repeated use, because the residual concentration of Cd (Fig. 9b) in the reaction solution using CdS@GMT/GR was about twelve-fold lower than that when using CdS@MT. The photocorrosion of CdS can release Cd2+ ions into the solution. Hence, the present results demonstrate enhanced chemical stability and improved photostability of CdS@GMT/GR due to GR serving as a hole-transporting and collection layer, restricting the photocorrosion of CdS.33 The stable XRD pattern (ESI 10†), XPS survey spectrum (ESI 11†), and valence state of Cd (ESI 12†) also prove the chemical stability of CdS@GMT/GR in the photocatalytic process. To understand the photocatalytic mechanism and to investigate the active species involved in the photocatalytic process, hydroxyl radicals (·OH) were detected on the surface of visible-light-illuminated samples by the PL method using TA as the probe molecule. Fig. 10a shows the PL spectral changes observed in a 5 × 10⁻⁴ M basic solution of TA (excitation: 315 nm). No PL signal was observed upon the irradiation of the CdS/GR sample, indicating that no ·OH radicals were produced. In the cases of the CdS@GMT/GR-2, CdS@GMT/GR-1, CdS@GMT/GR-3, CdS@MT, and GMT/GR samples, gradual decreases in PL intensities at about 425 nm were observed after an irradiation time of 50 min. Moreover, except for CdS/GR, the PL signal with all the samples increased with increasing irradiation time (Fig. 10b), reflecting the production of ·OH radicals. The above results can be readily explained by the locations of the VB edges (Ev) of CdS/GR, CdS@MT, GMT/GR, and CdS@GMT/GR, and the normal potential of the OH−/·OH couple (Scheme 2a). Their potentials are 1.87 and 2.7 V versus NHE, respectively, which suggests that the photogenerated holes on the surfaces of all the samples can react with OH−/H2O to form ·OH, except for CdS and its GR composites. On the basis of the above results and discussion, the photocatalytic mechanism of CdS@GMT/GR is proposed and schematically illustrated in Scheme 2b. The conduction band (CB) and VB positions of bulk CdS are ca. −0.85 and 1.87 eV, respectively.26 Its VB position is more negative than the standard redox potential of OH−/·OH, which suggests that the holes photoinduced on the VB of QDs are incapable of oxidizing OH− to ·OH radicals. On the other hand, GR hybridization would introduce an intermediate bandgap state close to anatase VB and extend light absorption into a longer wavelength region.37 Therefore, under visible-light irradiation, electrons can be promoted from the GR-hybridized level to the CB of MT to transfer to the VB of CdS, while the photoinduced holes tend to remain in the VB of GMT. This results in an efficient spatial separation of the photoinduced charge carriers. Electrons stored in the CB of CdS are then trapped by O2 in air near the surface of CdS to form reactive superoxide radical ions (−·O2), while the holes in the VB of GMT transfer to the surface of GR to react with adsorbed water molecules (or surface hydroxyl groups) to form hydroxyl radicals (·OH). Finally, GOII is oxidized by these highly active ·OH radical species to form carbon dioxide and water. The above hydroxyl radical experiments further validate the direct CdS@GMT/GR Z-scheme photocatalytic mechanism. First, if GMT and CdS were to form a conventional heterojunction without the Z-scheme structure, then, under visible-light irradiation, the photoinduced holes would tend to transfer from the VB of GMT to the VB of CdS, while electrons would transfer from the CB of CdS to the CB of GMT. Although this would result in an efficient spatial separation of the photoinduced charge carriers, the holes in the VB of CdS could not react with the adsorbed water molecules (or surface hydroxyl groups) to form hydroxyl radicals (·OH) due to the VB position of CdS being higher than the potential of the H2O/·OH couple. This would result in CdS@GMT/GR having a lower oxidizing ability and photocatalytic activity. Therefore, CdS@GMT/GR forms a direct Z-scheme structure according to the above photocatalytic activity and hydroxyl radical experiments. On the contrary, if CdS@MT were to form a Z-scheme structure, photogenerated electrons could transfer to the surface of CdS from MT only under UV irradiation with hν ≥ Eg (MT). However, photogenerated holes would be accumulated on the MT and could not transfer to the external support, i.e., GR, to contact OH−, H2O, and GOII. Hence, MT would become a recombination center for the photogenerated electrons and holes. Moreover, the accumulated holes would lead to severe photocorrosion of QDs (XPS analysis). Therefore, the photocatalytic mechanism of CdS@MT sample cannot be mainly interpreted in terms of a direct Z-scheme structure, at variance with a previous report.52 In addition, an excessively high content of GR would tend to exert a negative influence on the corresponding photocatalytic activity.55,56 Once the content of GR exceeds a certain level, the GMT surface will be completely covered by GR. The intensity of light impinging on the surface of the GMT will be decreased due to the shielding effect of the GR, thereby leading to the production of fewer photogenerated electrons and holes in the GMT and poor photocatalytic activity. Hence, CdS@GMT/GR-2 shows high oxidation performance for GOII decomposition under visible light.
 |
| | Fig. 8 Photocatalytic activities (a) and linear fittings of the pseudo-first-order kinetics in degrading the GOII solution (b) by different catalysts under visible-light irradiation. | |
 |
| | Fig. 9 Photocatalytic performance stability (a) and residue concentration of Cd element in the reaction GOII solution by different catalysts under visible-light irradiation (b). | |
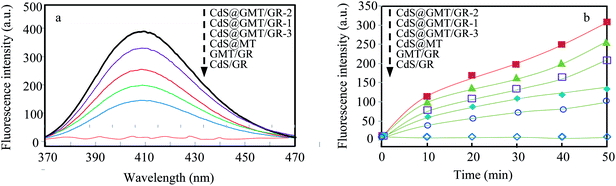 |
| | Fig. 10 PL spectral changes for the different samples at 50 min (a) and comparison of PL intensity at 425 nm against irradiation time for the different samples (b). | |
 |
| | Scheme 2 Illustrating band positions of different samples together with OH−/·OH and O2/O2− redox potentials (a) and proposed mechanism diagram of the enhancement of the photocatalytic activity of the direct Z-scheme CdS@GMT/GR (b). | |
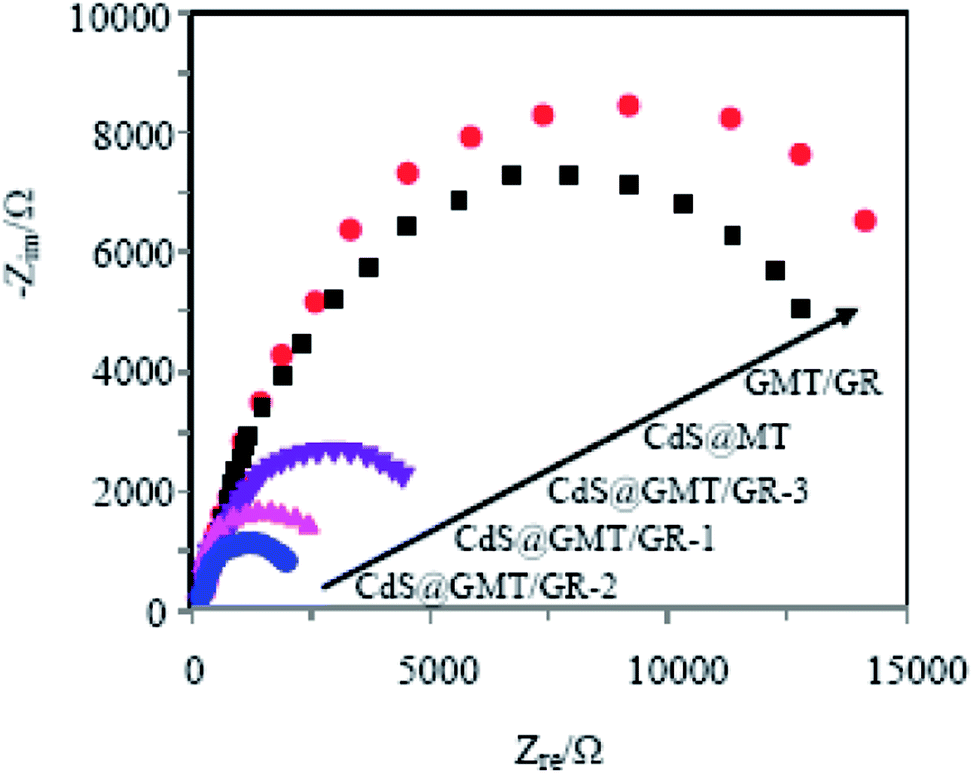
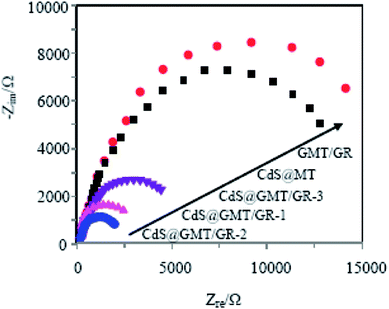
To further verify the improvement of charge-transfer efficiency in CdS@GMT/GR, electrochemical impedance spectroscopy (EIS) of the obtained samples was also determined. As shown in Fig. 11, the diameter of the semicircular arc of the GR-based sample was much smaller than those of the MT/GR and CdS@MT samples. CdS@GMT/GR-2 had the smallest radius of the arc in the EIS pattern among all the samples. In general, a smaller semicircle arc in the high-frequency region indicates faster interfacial charge transfer and more effective separation of the photogenerated electron–hole pairs.26,43,57 Therefore, the above photoelectrochemical activity results suggest that a remarkable enhancement of the charge-transport properties of CdS@GMT/GR could contribute toward the suppression of charge recombination and improving the photocatalytic performance.
 |
| | Fig. 11 EIS of the obtained sample electrodes. | |
4. Conclusions
In summary, direct Z-scheme CdS@GMT/GR photocatalysts have been successfully fabricated by a facile hydrothermal method. The as-prepared CdS@GMT/GR photocatalysts exhibit high photocatalytic activity for GOII degradation under visible-light irradiation. This can be mainly attributed to the following facts. GR plays an important role in enhancing the photocatalytic activity, acting as a hole-transporting and collection layer in the Z-scheme system, and remarkably promoting the separation and transfer of the photogenerated electron–hole pairs. Meanwhile, GR hybridized with MT to form GMT through a mixing of energy levels, endowing the charge carriers of this Z-scheme system with strong redox potentials under visible light. Therefore, the GR content affects the photocatalytic activity of CdS@GMT/GR and CdS@GMT/GR-2 exhibited the highest photocatalytic performance. CdS QDs not only serve primarily as photosensitizers in the direct Z-scheme system, but the unique pore-embedded structure of CdS@GMT also effectively enhances the utilization efficiency of the light source. This work may provide a promising strategy for the construction of visible-light-driven Z-scheme photocatalysts for reducing the growing problem of environmental pollution.
Conflicts of interest
There are no conflicts to declare.
Acknowledgements
This work was sponsored by the National Science Foundation of China (21476095), the Fundamental Research Funds for National Demonstration Center for Experimental Chemistry Education (Jishou University). The valuable comments of anonymous reviewers are greatly appreciated.
References
- S. Dong, J. Feng, M. Fan, Y. Pi and L. Hu, Recent developments in heterogeneous photocatalytic water treatment using visible light-responsive photocatalysts: a review, RSC Adv., 2015, 19, 14610–14630 RSC.
- Y. J. Li, X. M. Zhou, W. Chen, L. Y. Li, M. X. Zen, S. D. Qin and S. G. Sun, Photodecolorization of Rhodamine B on tungsten-doped TiO2/activated carbon under visible-light irradiation, J. Hazard. Mater., 2012, 25, 227–228 Search PubMed.
- H. L. Sun, H. Y. Yip, Z. F. Jiang, L. Q. Ye, I. M. C. Lo and P. K. Wong, Facile synthesis of oxygen defective yolk–shell BiO2−x for visible-light-driven photocatalytic inactivation of Escherichia coli, J. Mater. Chem. A, 2018, 12, 4997–5005 RSC.
- L. Y. Chang, R. R. Lunt, P. R. Brown, V. Bulović and M. G. Bawendi, Low-temperature solution-processed solar cells based on PbS colloidal quantum dot/CdS heterojunctions, Nano Lett., 2013, 13, 994–999 CrossRef CAS PubMed.
- C. H. M. Chuang, P. R. Brown, V. Bulović and M. G. Bawendi, Improved performance and stability in quantum dot solar cells through band alignment engineering, Nat. Mater., 2014, 13, 796–801 CrossRef CAS PubMed.
- R. L. Z. Hoye, B. Ehrler, M. L. Böhm, D. Muñoz-Rojas, R. M. Altamimi, A. Y. Alyamani, Y. Vaynzof, A. Sadhanala, G. Ercolano, N. C. Greenham, R. H. Friend, J. L. MacManus-Driscoll and K. P. Musselman, Improved open-circuit voltage in ZnO–PbSe quantum dot solar cells by understanding and reducing losses arising from the ZnO conduction band tail, Adv. Energy Mater., 2014, 4, 1301544–1301552 CrossRef PubMed.
- L. Etgar, P. Gao, P. Qin, M. Graetzel and M. K. Nazeeruddin, A hybrid lead iodide perovskite and lead sulfide QD heterojunction solar cell to obtain a panchromatic response, J. Mater. Chem. A, 2014, 2, 11586–11590 RSC.
- P. Zhou, Y. Xie, J. Fang, Y. Ling, C. Yu, X. Liu, Y. Dai, Y. Qin and D. Zhou, CdS quantum dots confined in mesoporous TiO2 with exceptional photocatalytic performance for degradation of organic pollutants, Chemosphere, 2017, 178, 1–10 CrossRef CAS PubMed.
- P. Wang, X. Li, J. L. Fang, D. Z. Li, J. Chen, X. Y. Zhang, Y. Shao and Y. H. He, A facile synthesis of CdSe quantum dots-decorated anatase TiO2 with exposed {001} facets and its superior photocatalytic activity, Appl. Catal., B, 2016, 181, 838–847 CrossRef CAS.
- X. F. Shi, X. Y. Xia, G. W. Cu, N. Deng, Y. Q. Zhao, L. H. Zhuo and B. Tang, Multiple exciton generation application of PbS quantum dots in ZnO@PbS/graphene oxide for enhanced photocatalytic activity, Appl. Catal., B, 2015, 163, 123–128 CrossRef CAS.
- G. Zoltán, K. Zoltán and K. Ákos, Visible light activation photocatalytic performance of PbSe quantum dot sensitized TiO2 Nanowires, Appl. Catal., B, 2015, 179, 583–588 CrossRef.
- J. H. Jo, M. S. Kim, C. Y. Han, E. P. Jang, Y. R. Do and H. Yang, Effective surface passivation of multi-shelled InP quantum dots through a simple complexing with titanium species, Appl. Surf. Sci., 2018, 428, 906–911 CrossRef CAS.
- P. R. Yu, K. Zhu, A. G. Norman, S. Ferrere, A. J. Frank and A. J. Nozik, Nanocrystalline TiO2 solar cells sensitized with InAs quantum dots, J. Phys. Chem. B, 2006, 50, 25451–25454 CrossRef PubMed.
- D. Kandi, S. Marth and K. M. Parid, Quantum dots as enhancer in photocatalytic hydrogen evolution: A review, Int. J. Hydrogen Energy, 2017, 15, 9467–9481 CrossRef.
- H. K. Jun, M. A. Careem and A. K. Arof, Quantum dot-sensitized solar cells—perspective and recent developments: A review of Cd chalcogenide quantum dots as sensitizers, Renewable Sustainable Energy Rev., 2013, 22, 148–167 CrossRef CAS.
- Z. Jiao, M. Tsutomu, Z. Li, Z. M. Gunawan, N. Mamiko, M. Guijun, H. Takashi, K. Masao, I. Shigeru, S. Naoya, Y. Taro and D. Kazunari, Enhancement of solar hydrogen evolution from water by surface modification with CdS and TiO2 on porous CuInS2 photocathodes prepared by an electrodeposition–sulfurization method, Angew. Chem., 2014, 44, 12002–12006 Search PubMed.
- R. S. Srinivas, D. I. Kanak, T. C. Venkat, K. Soo-Kyoung and K. Hee-Je, The effect of TiO2 nanoflowers as a compact layer for CdS quantum-dot sensitized solar cells with improved performance, Dalton Trans., 2015, 28, 12852–12862 Search PubMed.
- L. P. Zhang and M. Jaroniec, Toward designing semiconductor-semiconductor heterojunctions for photocatalytic applications, Appl. Surf. Sci., 2018, 430, 2–17 CrossRef CAS.
- T. S. Natarajan, K. R. Thampi and R. J. Tayade, Visible light driven redox-mediator-free dual semiconductor photocatalytic systems for pollutant degradation and the ambiguity in applying Z-scheme concept, Appl. Catal., B, 2018, 227, 296–311 CrossRef CAS.
- H. Kato, Y. Sasaki, N. Shirakur and A. Kudo, Synthesis of highly active rhodium-doped SrTiO3 powders in Z-scheme systems for visible-light-driven photocatalytic overall water splitting, J. Mater. Chem. A, 2013, 39, 12327–12333 RSC.
- J. X. Low, C. J. Jiang, B. Cheng, S. Wageh, A. A. Al-Ghamdi and J. G. Yu, A Review of Direct Z-Scheme Photocatalysts, Small Methods, 2017, 5, 170–180 Search PubMed.
- A. Iwase, Y. H. Ng, Y. Ishiguro, A. Kudo and R. Amal, Reduced graphene oxide as a solid-state electron mediator in Z-scheme photocatalytic water splitting under visible light, J. Am. Chem. Soc., 2011, 29, 11054–11057 CrossRef PubMed.
- X. K. Zeng, Z. Y. Wang, G. Wang, T. R. Gengenbach, D. T. McCarthy, A. Deletic, J. G. Yu and X. W. Zhang, Highly dispersed TiO2 nanocrystals and WO3 nanorods on reduced graphene oxide: Z-scheme photocatalysis system for accelerated photocatalytic water disinfection, Appl. Catal., B, 2017, 218, 163–173 CrossRef CAS.
- A. Iwase, S. Yoshino, T. Takayama, Y. H. Ng, R. Amal and A. Kudo, Water Splitting and CO2 reduction under visible light irradiation using Z-scheme systems consisting of metal sulfides, CoOx-Loaded BiVO4, and a reduced graphene oxide electron mediator, J. Am. Chem. Soc., 2016, 32, 10260–10264 CrossRef PubMed.
- N. Remya, D. Melepurath and K. S. Avanish, Nanoscale connectivity in a TiO2/CdSe quantum dots/functionalized graphene oxide nanosheets/Au nanoparticles composite for enhanced photoelectrochemical solar cell performance, Phys. Chem. Chem. Phys., 2014, 14, 767–778 Search PubMed.
- J. J. Xian, D. Z. Li, J. Chen, X. F. Li, M. He, Y. Shao, L. H. Yu and J. L. Fang, TiO2 nanotube array-graphene-CdS quantum dots composite film in Z-scheme with enhanced photoactivity and photostability, ACS Appl. Mater. Interfaces, 2014, 6, 13157–13166 CrossRef CAS PubMed.
- L. B. Kuai, Y. Zhou, W. G. Tu, P. Li, H. J. Li, Q. F. Xu, L. Q. Tang, X. Y. Wang, M. Xiao and Z. G. Zou, Rational construction of a CdS/reduced graphene oxide/TiO2 core–shell nanostructure as an all-solid-state Z-scheme system for CO2 photoreduction into solar fuels, RSC Adv., 2015, 107, 88409–88413 RSC.
- G. Yu, S. H. Wang, J. X. Low and W. Xiao, Enhanced photocatalytic performance of direct Z-scheme g-C3N4-TiO2 photocatalysts for the decomposition of formaldehyde In air, Phys. Chem. Chem. Phys., 2013, 15, 16883–16890 RSC.
- R. Muzyka, M. Kwoka, Ł. Smędowski, N. Díez and G. Gryglewicz, Oxidation of graphite by different modified Hummers methods, Carbon, 2017, 117, 488 CrossRef.
- S. Na. Alam, N. Sharma and L. Kumar, Synthesis of Graphene Oxide (GO) by Modified Hummers Method and Its Thermal Reduction to Obtain Reduced Graphene Oxide (rGO), Graphene, 2017, 6, 1–18 CrossRef CAS.
- F. Rahmawati, Optical properties and photocatalytic activity of CdS-TiO2/graphite composite, Sci. Eng. Compos. Mater., 2017, 24, 253–260 CAS.
- P. P. Zhou, Y. Xie, J. Fang, Y. Ling, C. L. Yu, X. M. Liu, Y. H. Dai, Y. C. Qin and D. Zhou, CdS quantum dots confined in mesoporous TiO2 with exceptional photocatalytic performance for degradation of organic pollutants, Chemosphere, 2017, 178, 1–10 CrossRef CAS PubMed.
- C. Y. Zhai, M. S. Zhu, Y. T. Lu, F. F. Ren, C. Q. Wang, Y. K. Du and P. Yang, Reduced graphene oxide modified highly ordered TiO2 nanotube arrays photoelectrode with enhanced photoelectrocatalytic performance under visible-light irradiation, Phys. Chem. Chem. Phys., 2014, 16, 14800–14807 RSC.
- P. Song, X. Zhang, M. Sun, X. Cui and Y. Lin, Graphene oxide modified TiO2 nanotube arrays: enhanced visible light photoelectrochemical properties, Nanoscale, 2012, 5, 1800–1804 RSC.
- F. Tuinstra and J. L. Koenig, Raman Spectrum of Graphite, J. Chem. Phys., 1970, 53, 1126–1130 CrossRef CAS.
- M. Zhu, Z. Li, B. Xiao, Y. Lu, Y. Du, P. Yang and X. Wang, Surfactant assistance in improvement of photocatalytic hydrogen production with the porphyrin noncovalently functionalized graphene nanocomposite, ACS Appl. Mater. Interfaces, 2013, 5, 1732–1740 CrossRef CAS PubMed.
- L. Shen, X. Zhang, H. Li, C. Yuan and G. Cao, Design and tailoring of a three-dimensional TiO2−graphene−carbon nanotube nanocomposite for fast lithium storage, J. Phys. Chem. Lett., 2011, 2, 3096–3101 CrossRef CAS.
- C. Liu, Y. J. Li, P. Xu, M. Li and M. X. Zen, Carbon nanotube embedded mesoporous titania pore-hole inorganic hybrid materials with high thermal stability, improved crystallinity and visible-light driven photocatalytic performance, Microporous Mesoporous Mater., 2014, 195, 319–329 CrossRef CAS.
- Y. J. Zou, J. W. Shi, D. D. Ma, Z. Y. Fan, C. M. Niu and L. Z. Wang, Fabrication of g-C3N4/Au/C-TiO2 hollow structure as visible-light-driven Z-scheme photocatalyst with enhanced photocatalytic H2 evolution, ChemCatChem, 2017, 19, 3752–3761 CrossRef.
- P. N. Zhu, A. S. Nair, S. P. Peng, S. Y. Yang and R. Seeram, Facile fabrication of TiO2−graphene composite with enhanced photovoltaic and photocatalytic properties by electrospinning, ACS Appl. Mater. Interfaces, 2012, 4, 581–585 CrossRef CAS PubMed.
- Y. Zhang, C. X. Wang, Z. M. Yuan, L. Y. Zhang and L. W. Yin, Reduced graphene oxide wrapped mesoporous hierarchical TiO2-CdS as a photoanode for high-performance dye-sensitized solar cells, Eur. J. Inorg. Chem., 2017, 16, 2281–2288 CrossRef.
- K. Ma, O. Yehezkeli, D. W. Domaille, H. H. Funke and J. N. Cha, Enhanced hydrogen production from DNA-Assembled Z-Scheme TiO2–CdS Photocatalyst Systems, Angew. Chem., Int. Ed., 2015, 54, 11490–11494 CrossRef CAS PubMed.
- N. Zhang, Y. H. Zhang, X. Y. Pan, M. Q. Yang and Y. J. Xu, Constructing ternary CdS−Graphene−TiO2 hybrids on the flatland of graphene oxide with enhanced visible-light photoactivity for selective transformation, J. Phys. Chem. C, 2012, 116, 18023–18031 CrossRef CAS.
- H. N. Kim, T. W. Kim, I. Y. Kim and S. H. Wang, Cocatalyst-free photocatalysts for efficient visible-light-induced H2 production: porous assemblies of CdS quantum dots and layered titanate nanosheets, Adv. Funct. Mater., 20111, 16, 3111–3118 Search PubMed.
- Z. Zheng, B. Huang and J. Lu, Hydrogenated
titania: synergy of surface modification and morphology improvement for enhanced photocatalytic activity, Chem. Commun., 2012, 48, 5733–5735 RSC.
- X. Lu, G. Wang and T. Zhai, Hydrogenated TiO2 nanotube arrays for supercapacitors, Nano Lett., 2012, 12, 1690–1699 CrossRef CAS PubMed.
- M. Zhu, P. Chen and M. Liu, Graphene oxide enwrapped Ag/AgX (X = Br, Cl) nanocomposite as a highly efficient visible-light plasmonic photocatalyst, ACS Nano, 2011, 5, 4529–4537 CrossRef CAS PubMed.
- M. Zhu, P. Chen and M. Liu, Ag/AgBr/graphene oxide nanocomposite synthesized via oil/water and water/oil Microemulsions: A comparison of sunlight energized plasmonic photocatalytic activity, Langmuir, 2018, 28, 3385–3397 CrossRef PubMed.
- M. Yang, N. Zhang and Y. Xu, Surfactant assistance in improvement of photocatalytic hydrogen production with the porphyrin noncovalently functionalized graphene nanocomposite, ACS Appl. Mater. Interfaces, 2013, 5, 1156–1172 CrossRef CAS PubMed.
- H. Zhang, X. Lv, Y. Li, Y. Wang and J. Li, P25-graphene composite as a high performance photocatalyst, ACS Nano, 2010, 4, 380–391 CrossRef CAS PubMed.
- R. G. M. Johan, G. B. Yunier, L. M. R. Maria, B. P. Marcelo, L. P. Jefferson, C. A. Luciano, M. A. Carlos, G. F. D. Denis, F. S. Antonio and M. Giovanna, Effects of the large distribution of CdS quantum dot sizes on the charge transfer interactions into TiO2 nanotubes for photocatalytic hydrogen generation, Nanotechnology, 2016, 27(28), 285401 CrossRef PubMed.
- A. Y. Meng, B. C. Zhu, B. Zhong, L. Y. Zhang and B. Cheng, Direct Z-scheme TiO2/CdS hierarchical photocatalyst for enhanced photocatalytic H2-production activity, Appl. Surf. Sci., 2017, 422, 518–527 CrossRef CAS.
- D. Meissner, R. Memming and B. Kastening, Photoelectrochemistry of cadmium sulfide. 1. reanalysis of photocorrosion and flat-band potential, J. Phys. Chem., 1988, 92, 3476–3483 CrossRef CAS.
- M. Y. Wang, L. J. Cai, Y. Wang, F. C. Zhou, K. Xu, X. M. Tao and Y. Chai, Graphene-draped semiconductors for enhanced photocorrosion resistance and photocatalytic properties, J. Am. Chem. Soc., 2017, 139, 4144–4151 CrossRef CAS PubMed.
- X. F. Yang, J. L. Qin, Y. Li, R. X. Zhang and H. Tang, Graphene-spindle shaped TiO2 mesocrystal composites: facile synthesis and enhanced visible light photocatalytic performance, J. Hazard. Mater., 2013, 261, 342–350 CrossRef CAS PubMed.
- G. Žerjav, M. S. Arshad, P. Djinović, I. Junkar, J. Kovač, J. Zavašnik and A. Pintar, Improved electron-hole separation and migration in anatase TiO2 nanorod/reduced graphene oxide composites and their influence on photocatalytic performance, Nanoscale, 2017, 13, 4578–4592 RSC.
- S. Y. Chae, P. Sudhagar, A. Fujishima, Y. J. Wang and O. S. Joo, Improved photoelectrochemical water oxidation kinetics using a TiO2 nanorod array photoanode decorated with graphene oxide in a neutral pH solution, Phys. Chem. Chem. Phys., 2015, 12, 7714–7719 RSC.
Footnote |
| † Electronic supplementary information (ESI) available. See DOI: 10.1039/c8ra08008a |
|
| This journal is © The Royal Society of Chemistry 2018 |
Click here to see how this site uses Cookies. View our privacy policy here. 
 Open Access Article
 This Open Access Article is licensed under a Creative Commons Attribution-Non Commercial 3.0 Unported Licence
 *,
Feitai Chen and
Zhenying Han
*,
Feitai Chen and
Zhenying Han