 Open Access Article
Experimental study on fluidization behaviors of walnut shell in a fluidized bed assisted by sand particles
Xing Wu ,
Yaxiang Li,
Xiefei Zhu,
Lingrui Huang and
Xifeng Zhu*
Department of Thermal Science and Energy Engineering, University of Science and Technology of China, 96 Jinzhai Road, Hefei, Anhui 230026, P. R. China. E-mail: xfzhu@ustc.edu.cn; Tel: +86 551 63600040
First published on 3rd December 2018
Abstract
The fluidization behaviors and their differences for walnut shell (WS) assisted by different-sized sands at various blending proportions were investigated experimentally in a cold visual fluidized bed at ambient temperature and pressure. Through analyzing the fluidization characteristic curves, it was found that the WS/sand mixtures were clearly characterized by stratified fluidization during the fluidization process, presenting a velocity interval rather than a threshold for transition from fixed to fluidized bed. Sand-3, as the fluidizing medium, showed better performance for WS fluidization in terms of the relative difference between initial (Umf,i) and final fluidization velocity (Umf,f) as well as the average fluidization rate (Rf). Furthermore, the regularity and mechanism of mixing and segregation of WS/sand mixtures in two fluidized regions (semi and completed) are discussed in detail based on the flow pattern diagram, the axial and radial distribution of the components, as well as the mixing index.
Introduction
Fast pyrolysis of biomass has been acknowledged to be a promising approach to efficiently converting raw biomass into high-energy-density bio-oil and combustible gases, in the absence of oxygen.1–3 Throughout the pyrolysis conversion process, the pyrolysis reactor, as the site of reaction, is the core of the technology chain; its type and operation conditions directly control the reaction conditions and further determine the yield and quality of the products and the effectiveness of the entire pyrolysis process. To date, several reactor configurations have been developed for biomass pyrolysis, including the bubbling fluidized bed,4 circulating and transported beds,5 rotating cone, entrained flow, ablative and vacuum reactors,6 screw and augur reactor,1 and microwave pyrolysis.7 Among them, the fluidized bed has achieved some obvious successes and demonstrated a promising industrial application for biomass pyrolysis due to its simple structure, continuous feed and removal of solids, excellent heat and mass transfer rates, suitability for large-scale operations, etc.8 Unfortunately, there are still some issues with the open design and operations that mainly relate to the mixing and separation of heterogeneous phases as well as the contact efficiency of multiphase in fluidized beds.9In fluidized beds for biomass pyrolysis, apart from biomass raw materials, sand is commonly employed as fluidization medium and heat carrier to promote the fluidization quality and heat transfer in the bed.10 However, the marked differences in density and surface characteristics between biomass and sand particles produce some new complexities in the hydrodynamics of the bed.11 The complex heterogeneous bed material composition associated with mixing and separation directly affects the hydrodynamic behaviors and chemical reactions in the reactor. Fu et al. experimentally studied the segregation behavior of lignite particles with various compositions in a vibrated gas-fluidized bed.12 It was reported that the content of 2 ± 0.5 mm lignite particles determined the particle fluidization and size-based segregation, and it also had a certain effect on density-based segregation induced by the differences in ash content of the lignite particles. Girimonte et al. emphasized that the fluidization behavior mainly depended on the bed properties and operating conditions, and it is essentially determined by the gas–solid drag force and solid–solid interactions.13
Extensive studies have been conducted on the fluidization of binary systems with the same particle size but different densities, or vice versa, indicating that two types of particles in the bed appear as a stratified flow, with a non-uniform particle distribution along the axial and radial directions.9,14–16 He et al. claimed that the relatively larger (or heavier) particles, termed jetsam, tended to be deposited at the bottom of the bed, while the smaller (or lighter) particles, termed flotsam, were easily floated on the upper layer of the bed, which is detrimental for heat transfer and chemical reactions in the bed and even leads to the failure of fluidization.17 Girimonte et al. proposed a model to predict the fluidization velocities and axial concentration profiles of binary mixtures, differing in either density or size, by inferring an equilibrium relationship between the fixed and the fluidized region of the bed during defluidization.13 Moreover, Dong et al. found that the characteristics and the degree of separation of two-component mixtures with different densities or/and sizes mainly depended on their density difference rather than the effect of particle size.18 However, suitable ratios of small/heavy sub-bituminous coal powder and large/light hybrid poplar wood show good mixing behavior.19 Starting from the force balance on one particle, the competition of mechanisms in mixtures in which the components' size difference effect counteracts that of density difference was contemplated. But so far, few studies on the mixing and separation behavior of binary mixtures consisting of small/heavy particles and large/light particles have been reported.
In addition, gas velocity, as the motive force of bed fluidization, also has a crucial influence on the evolution and final extent of mixing and segregation of multi-component particles. Hwang et al. studied the mixing and segregation characteristics of rice straw and standard sand particles in a cylindrical bubbling fluidized bed, finding that the mixing index was increased with the increase of U/Umf; the U/Umf = 1.23 was recommended as the operating gas velocity of fast pyrolysis, where the mixing index was 0.90.20 Clarke et al. revealed that the mixture of 0.507 mm sawdust and 0.322 mm glass spheres could be completely mixed during fluidization, but the mixture of 0.507 mm sawdust and 0.516 mm glass spheres was partially or completely mixed depending on gas velocity in the fluidized bed.21 The axial mixing and segregation of fuel was studied by Köhler et al. in a magnetic particle tracking system, who concluded that the axial fuel mixing was enhanced, and three regimes, including flotsam, transition, and fully developed mixing regime, were presented in succession as the fluidization velocity increased.22 It is confirmed that there is a competition between two trends of mixing and separation in a multi-component fluidized bed depending upon the gas velocity. According to the two-phase theory, as the operating gas velocity exceeds the minimum fluidization velocity, a portion of “excess” gas passes through the bed as bubbles, in which the upward flow of bubbles would agitate the entire bed and intensify the mixing of components. Better mixing of particles could be obtained by increasing fluidizing velocity in a bubbling fluidized bed.23 However, this is only true up to the optimum gas velocity range. Once the gas velocity is above the upper limit, larger bubbles dominate over the interfacial area and move up faster, thereby shortening the residence time and reducing the gas hold up and heat transfer. Furthermore, very high velocity is associated with particle wash-out from the reactor, especially when the biomass particles are worn by sand.24 Therefore, further understanding the biomass fluidization dynamics in terms of bed characteristics and mixing/separation is critical to successfully operating the fluidized bed for biomass pyrolysis.
In this work, the walnut shell (WS), as a high-potential biomass energy source, was selected as biomass material,25 and its fluidization behaviors when assisted by different-sized sands at various blending proportions were studied to provide clear insight into the gas and solid hydrodynamics of WS/sand mixtures in a cold visual fluidized bed. The fluidization characteristic curves of each bed material were compared and analyzed, and the relative difference between Umf,i and Umf,f as well as the average fluidization rate (Rf) were employed to quantitatively evaluate the fluidization quality. Furthermore, emphasis was laid on the evolution of mixing and segregation pattern with the increase of gas velocity. The law and mechanism of mixing and segregation of WS/sand mixture in two fluidized regions (semi and completed) are discussed in detail based on the flow pattern diagram, the axial and radial distribution of the components, as well as the mixing index.
Experimental
Experimental system
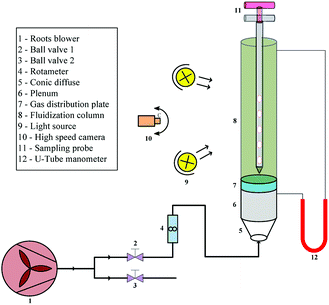
A cold visual fluidized bed experimental system used in this study is shown in Fig. 1; it is mainly composed by two sections: structure and measurement. The fluidization column is made of a plexiglass tube 2000 mm in height and 140 mm in internal diameter, to realize visual observation and record the flow pattern. The gas distributor, with 31 caps well-distributed in rings for a total open area of 3.02%, is located at the bottom of the column, and a layer of metal mesh is secured to the top of the distributor to prevent particles from leaking out of the air distributor. The bottom of the distributor consists of a plenum with a height of 400 mm, a cone-shaped diffuser tube with an angle of 45°, and air supply pipes with internal diameters of 40 mm.The carrier gas required for fluidization was supplied by a HBCRS-65 Roots blower, whose flow rate was monitored by a rotameter and adjusted by ball valve 1. The pressure drop across the bed was measured by a U-tube manometer whose two ends were connected to the top of the column and bottom of the distributor, respectively. A high-speed camera was used to record the evolution of fluidization in different operating conditions. The stratified sampling probe used for collecting bed materials during fluidization was composed by three parts made of stainless steel: the double-tube with five concentric sampling cavities to collect material in the bed, the outer tube to control the sampler opening and closing, and two rods helping to handle the sampler in the bed.
Materials
Walnut shell (WS) obtained from Anhui province in China was selected as a representative of biomass materials. Prior to use, it was ground and sieved to particle sizes between 20 and 40 mesh (a typical size range for biomass pyrolysis in industrial reactors) for fluidization experiments in this work. Sand samples with sizes of 20 to 40 mesh, 40 to 60 mesh, and 60 to 80 mesh were sieved and selected as the fluidization media to study the effect of the sand size on the fluidization of biomass/sand mixture, and then determine the optimal addition amount of sand for biomass fluidization. To avoid the effects of moisture on density, surface properties and inter-particle fluid bridge forces, all the materials were dried at 105 °C for 24 h. The physical properties of WS and sands are given in Table 1.| Material | Mesh | Average diameter (mm) | Bulk density (kg m−3) | Particle density (kg m−3) | Porosity | Geldart classification |
|---|---|---|---|---|---|---|
| Walnut shell | 20–40 | 0.64 | 525 | 842 | 0.37 | B |
| Sand-1 | 20–40 | 0.64 | 1353 | 2573 | 0.47 | B |
| Sand-2 | 40–60 | 0.37 | 1295 | 2501 | 0.48 | B |
| Sand-3 | 60–80 | 0.23 | 1203 | 2436 | 0.51 | B |
A series of well-mixed WS/sand binary mixtures with different blending proportions were prepared as bed materials by mechanical mixing method, and detailed properties of mixtures are given in Table 2.
| Components | Volume ratio | Mass ratio | Size ratio | Bulk density ratio |
|---|---|---|---|---|
| WS/sand-1 | 3![[thin space (1/6-em)]](https://www.rsc.org/images/entities/char_2009.gif) : :![[thin space (1/6-em)]](https://www.rsc.org/images/entities/char_2009.gif) 1 1 |
1![[thin space (1/6-em)]](https://www.rsc.org/images/entities/char_2009.gif) : :![[thin space (1/6-em)]](https://www.rsc.org/images/entities/char_2009.gif) 0.86 0.86 |
1![[thin space (1/6-em)]](https://www.rsc.org/images/entities/char_2009.gif) : :![[thin space (1/6-em)]](https://www.rsc.org/images/entities/char_2009.gif) 1 1 |
1![[thin space (1/6-em)]](https://www.rsc.org/images/entities/char_2009.gif) : :![[thin space (1/6-em)]](https://www.rsc.org/images/entities/char_2009.gif) 2.58 2.58 |
2![[thin space (1/6-em)]](https://www.rsc.org/images/entities/char_2009.gif) : :![[thin space (1/6-em)]](https://www.rsc.org/images/entities/char_2009.gif) 1 1 |
1![[thin space (1/6-em)]](https://www.rsc.org/images/entities/char_2009.gif) : :![[thin space (1/6-em)]](https://www.rsc.org/images/entities/char_2009.gif) 1.29 1.29 |
|||
1![[thin space (1/6-em)]](https://www.rsc.org/images/entities/char_2009.gif) : :![[thin space (1/6-em)]](https://www.rsc.org/images/entities/char_2009.gif) 1 1 |
1![[thin space (1/6-em)]](https://www.rsc.org/images/entities/char_2009.gif) : :![[thin space (1/6-em)]](https://www.rsc.org/images/entities/char_2009.gif) 2.58 2.58 |
|||
1![[thin space (1/6-em)]](https://www.rsc.org/images/entities/char_2009.gif) : :![[thin space (1/6-em)]](https://www.rsc.org/images/entities/char_2009.gif) 2 2 |
1![[thin space (1/6-em)]](https://www.rsc.org/images/entities/char_2009.gif) : :![[thin space (1/6-em)]](https://www.rsc.org/images/entities/char_2009.gif) 5.16 5.16 |
|||
1![[thin space (1/6-em)]](https://www.rsc.org/images/entities/char_2009.gif) : :![[thin space (1/6-em)]](https://www.rsc.org/images/entities/char_2009.gif) 3 3 |
1![[thin space (1/6-em)]](https://www.rsc.org/images/entities/char_2009.gif) : :![[thin space (1/6-em)]](https://www.rsc.org/images/entities/char_2009.gif) 7.74 7.74 |
|||
| WS/sand-2 | 3![[thin space (1/6-em)]](https://www.rsc.org/images/entities/char_2009.gif) : :![[thin space (1/6-em)]](https://www.rsc.org/images/entities/char_2009.gif) 1 1 |
1![[thin space (1/6-em)]](https://www.rsc.org/images/entities/char_2009.gif) : :![[thin space (1/6-em)]](https://www.rsc.org/images/entities/char_2009.gif) 0.82 0.82 |
1![[thin space (1/6-em)]](https://www.rsc.org/images/entities/char_2009.gif) : :![[thin space (1/6-em)]](https://www.rsc.org/images/entities/char_2009.gif) 0.58 0.58 |
1![[thin space (1/6-em)]](https://www.rsc.org/images/entities/char_2009.gif) : :![[thin space (1/6-em)]](https://www.rsc.org/images/entities/char_2009.gif) 2.47 2.47 |
2![[thin space (1/6-em)]](https://www.rsc.org/images/entities/char_2009.gif) : :![[thin space (1/6-em)]](https://www.rsc.org/images/entities/char_2009.gif) 1 1 |
1![[thin space (1/6-em)]](https://www.rsc.org/images/entities/char_2009.gif) : :![[thin space (1/6-em)]](https://www.rsc.org/images/entities/char_2009.gif) 1.24 1.24 |
|||
1![[thin space (1/6-em)]](https://www.rsc.org/images/entities/char_2009.gif) : :![[thin space (1/6-em)]](https://www.rsc.org/images/entities/char_2009.gif) 1 1 |
1![[thin space (1/6-em)]](https://www.rsc.org/images/entities/char_2009.gif) : :![[thin space (1/6-em)]](https://www.rsc.org/images/entities/char_2009.gif) 2.47 2.47 |
|||
1![[thin space (1/6-em)]](https://www.rsc.org/images/entities/char_2009.gif) : :![[thin space (1/6-em)]](https://www.rsc.org/images/entities/char_2009.gif) 2 2 |
1![[thin space (1/6-em)]](https://www.rsc.org/images/entities/char_2009.gif) : :![[thin space (1/6-em)]](https://www.rsc.org/images/entities/char_2009.gif) 4.94 4.94 |
|||
1![[thin space (1/6-em)]](https://www.rsc.org/images/entities/char_2009.gif) : :![[thin space (1/6-em)]](https://www.rsc.org/images/entities/char_2009.gif) 3 3 |
1![[thin space (1/6-em)]](https://www.rsc.org/images/entities/char_2009.gif) : :![[thin space (1/6-em)]](https://www.rsc.org/images/entities/char_2009.gif) 7.41 7.41 |
|||
| WS/sand-3 | 3![[thin space (1/6-em)]](https://www.rsc.org/images/entities/char_2009.gif) : :![[thin space (1/6-em)]](https://www.rsc.org/images/entities/char_2009.gif) 1 1 |
1![[thin space (1/6-em)]](https://www.rsc.org/images/entities/char_2009.gif) : :![[thin space (1/6-em)]](https://www.rsc.org/images/entities/char_2009.gif) 0.76 0.76 |
1![[thin space (1/6-em)]](https://www.rsc.org/images/entities/char_2009.gif) : :![[thin space (1/6-em)]](https://www.rsc.org/images/entities/char_2009.gif) 0.36 0.36 |
1![[thin space (1/6-em)]](https://www.rsc.org/images/entities/char_2009.gif) : :![[thin space (1/6-em)]](https://www.rsc.org/images/entities/char_2009.gif) 2.29 2.29 |
2![[thin space (1/6-em)]](https://www.rsc.org/images/entities/char_2009.gif) : :![[thin space (1/6-em)]](https://www.rsc.org/images/entities/char_2009.gif) 1 1 |
1![[thin space (1/6-em)]](https://www.rsc.org/images/entities/char_2009.gif) : :![[thin space (1/6-em)]](https://www.rsc.org/images/entities/char_2009.gif) 1.15 1.15 |
|||
1![[thin space (1/6-em)]](https://www.rsc.org/images/entities/char_2009.gif) : :![[thin space (1/6-em)]](https://www.rsc.org/images/entities/char_2009.gif) 1 1 |
1![[thin space (1/6-em)]](https://www.rsc.org/images/entities/char_2009.gif) : :![[thin space (1/6-em)]](https://www.rsc.org/images/entities/char_2009.gif) 2.29 2.29 |
|||
1![[thin space (1/6-em)]](https://www.rsc.org/images/entities/char_2009.gif) : :![[thin space (1/6-em)]](https://www.rsc.org/images/entities/char_2009.gif) 2 2 |
1![[thin space (1/6-em)]](https://www.rsc.org/images/entities/char_2009.gif) : :![[thin space (1/6-em)]](https://www.rsc.org/images/entities/char_2009.gif) 4.58 4.58 |
|||
1![[thin space (1/6-em)]](https://www.rsc.org/images/entities/char_2009.gif) : :![[thin space (1/6-em)]](https://www.rsc.org/images/entities/char_2009.gif) 3 3 |
1![[thin space (1/6-em)]](https://www.rsc.org/images/entities/char_2009.gif) : :![[thin space (1/6-em)]](https://www.rsc.org/images/entities/char_2009.gif) 6.87 6.87 |
Experimental procedures and methods
All the experiments were conducted at atmospheric pressure and room temperature. First, the pressure drop across the gas distributor (ΔP0) was determined at each flow rate when the fluidized bed was empty, and the value was then used to correct pressure drop measurements for the fluidized bed with bed materials.Subsequently, the well-mixed bed materials prepared in the previous section were slowly added to the desired initial height of 140 mm (=1D) in all experiments.11 The fluidization experiments were conducted under two processes (descending and ascending): (1) sufficient carrier gas was pumped to fluidize the bed as much as possible, and then the flow rate was decreased to zero gradually after reaching operational stability. Simultaneously, the corresponding total pressure drop (ΔPtot) was recorded at each flow rate, and the pressure drop across the fluidized bed (ΔP) could be calculated as follows:
| ΔP = ΔPtot − ΔP0 | (1) |
Samples of various axial and radial positions of the bed were collected by a sampling probe at several specific gas velocities for subsequent analysis; the sampler rods were turned to close the holes before use and inserted into a certain position, then sampler holes were opened when the flow state was stable in the bed and, after a minute, were closed and taken out. (2) The carrier gas was slowly introduced into the bed from small to large to observe and record the evolution of the bed layer.
Results and discussion
Fluidization characteristic curves
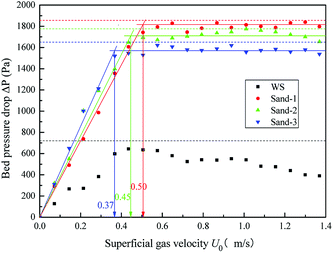
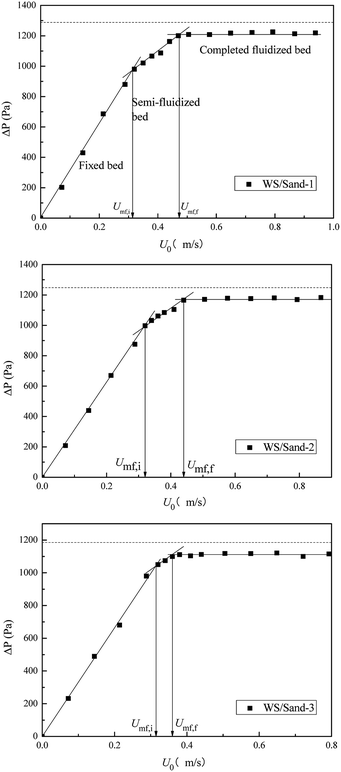
The fluidization characteristic curves (the relationship between bed pressure drop and superficial gas velocity) of WS and the three types of sands (alone) are shown in Fig. 2. The minimum fluidizing velocity Umf was determined by the intersection of the rising straight line (fixed bed) and the horizontal plateau (well-fluidized bed).26 The dashed baselines on the figure indicate the weight of bed materials per cross-section. All three curves of sands presented a distinctly piecewise linear characteristic, with an obvious minimum fluidization point, and the corresponding Umf values are shown in Fig. 2 and Table 2. The pressure drop in the fluidized region was stable and close to the bed weight of each cross-section at various gas velocities, which indicated that the three sands all had high-quality fluidization behavior with good bubbling properties. Compared with the fluidization behaviors of sands, the transition from fixed to fluidization regime of WS was not clear with gas velocity increase, showing a narrow fluidization range and poor fluidization quality. Similar phenomena were also described by Fang et al. in the fluidization of rice husk alone.27 Visually, there were obvious channels and dead zones in the bed throughout the fluidization range, and some walnut shell particles adhered to the bed wall. This may be related to the ubiquitous irregular shape and surface burr of the biomass particles. Analogously, Reina et al. found the agglomeration phenomenon of sawdust in their fluidization studies and speculated that it was due to the interweaving of unattached fibers to form a web retaining other finer particles.28To improve the fluidization quality of WS, three types of sands were mixed with WS as a medium for WS fluidization. In Fig. 3, three fluidization characteristic curves of WS/sand mixtures obtained by defluidization method displayed obvious horizontal segments, indicating that the WS achieved fluidization under a suitable gas velocity range with the help of the sands. Noteworthily, unlike the fluidization characteristics of one-component particles such as sand, each curve of the WS/sand mixtures could be divided into three segments: fixed bed, semi-fluidized bed and completely fluidized bed. The transition from fixed to fluidization regime of WS/sand mixtures was not a point but an interval, and the two ends of the interval corresponded to the initial fluidization velocity Umf,i and final fluidization velocity Umf,f, respectively. Similar experimental result has been found in the research of Formisani et al. using regular particles as mixture components.29 The three fluidization curves of WS/sand mixtures all had their own transition intervals from fixed bed to fluidized bed, but the ranges of transition intervals were significantly different. Compared with sand-1/WS and sand-2/WS, the transition interval range of sand-3/WS was significantly narrower. This may be due to the fact that the difference in the particle size between the sand-3 and WS just compensates for the effect of density difference to a certain extent, making the fluidization of the entire mixture more uniform.
In the fluidization curves of WS/sand mixtures, Umf,i was determined by the first experimental point deviating from the fixed bed curve, which is related to the minimum fluidization velocity of biomass particles with lower density than sand particles, and Umf,f is the point when the bed pressure drop reached the extreme value and all the particles inside the bed were fluidized. The characteristic of transition from fixed to fluidization regime of WS/sand mixtures revealed that the binary mixture particles exhibited a stratified fluidization behavior within this gas velocity range. One component was carried upwards by air or bubbles, while the other component settled downwards to fill the voids, and finally, the mixture in the bed was separated. Thus, the relative difference between Umf,i and Umf,f can be regarded as an indicator of mixing and segregation, which is calculated as follows:
| ES (%) = 100(Umf,f − Umf,i)/Umf,i | (2) |
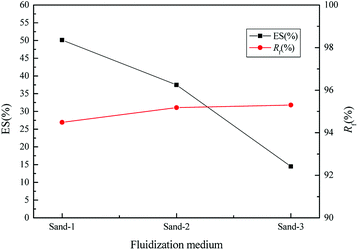
The smaller difference means better fluidization quality, while the larger difference indicates that the binary mixture tends to be separated more easily. Meanwhile, the average fluidization index Rf, the ratio of the mean pressure drop in the fluidized horizontal section to the bed weight, was introduced to quantitatively evaluate the fluidization quality.
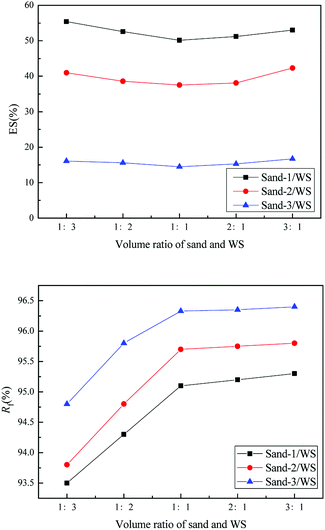
As shown in Fig. 4, the WS mixed with sand-3 had a larger Rf and smaller ES than that mixed with sand-1 or sand-2, meaning that using sand-3 as fluidization medium was more conducive to improving the fluidization quality of WS and avoiding the separation of components. Furthermore, as displayed in Fig. 5, with increasing sand blending amount, the ES decreased first and then increased, while the Rf increased first and then tended to be stable. Therefore, to improve the fluidization quality of the WS, it was recommended to blend 50% of sand-3 in the fluidization process.
Mixing and segregation mechanism
In this part, the evolution of flow regime in the bed recorded by a high-speed camera under different conditions was analyzed to reveal the mixing and segregation mechanism of WS/sand mixture. Moreover, the characteristic concentration of WS, Xi, was employed to describe the distribution status of components in the bed, defined as:
 | (3) |
 | (4) |
 | (5) |
Mixing and segregation in semi-fluidized region
Fig. 6 shows the snapshots of mixing and segregation of WS/sand-3 mixture at low gas velocity, ranging from Umf,i to Umf,f. From the initial fluidization, with the increase of gas velocity, the bed in the ideal fluidization state expanded gradually with a clear and flat surface, and the particles uniformly dispersed in the fluid, allowing sufficient contact and reaction opportunities between the particles and the fluid. Nevertheless, the actual fluidization behaviors of WS/sand-3 at different gas velocities (Umf,i ∼ Umf,f) in Fig. 6 showed that the bed layer did not expand uniformly when the gas velocity was greater than Umf,i, and the excess gas passed through the bed in the form of bubbles, which was in accordance with the theory of gas two-phase distribution in the fluidized bed. As shown in Fig. 6(a), when the gas velocity was close to Umf,i, WS and sand particles in the bed vibrated up and down while the upper bed of particles prior to fluidization and the bed surface showed a certain expansion and fluctuation. Specifically, some of WS particles floated to the bed surface, but no bubbles were observed here. This slight separation phenomenon could be attributed to percolation effect or buoyancy force.31 Due to the looseness of the particle packing, the vibration of the bed in the initial fluidized state allowed the small sand particles to fall down, causing the larger WS particles to be elevated. Besides, WS particles submerged into the sand bed would be subjected to an upward force known as buoyancy force due to the action of macroscopic pressure gradient in the bed.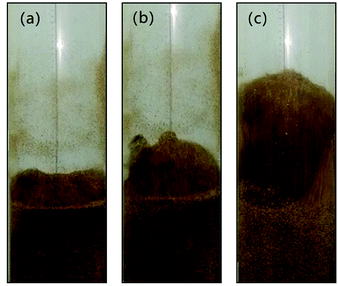 | ||
Fig. 6 Flow patterns of the binary mixture (WS![[thin space (1/6-em)]](https://www.rsc.org/images/entities/char_2009.gif) : :![[thin space (1/6-em)]](https://www.rsc.org/images/entities/char_2009.gif) sand-3 = 1 sand-3 = 1![[thin space (1/6-em)]](https://www.rsc.org/images/entities/char_2009.gif) : :![[thin space (1/6-em)]](https://www.rsc.org/images/entities/char_2009.gif) 1) observed at different gas velocities, (U − Umf,i)/(Umf,f − Umf,i): (a) 0.2; (b) 0.5; (c) 0.8. 1) observed at different gas velocities, (U − Umf,i)/(Umf,f − Umf,i): (a) 0.2; (b) 0.5; (c) 0.8. | ||
Once the dimensionless gas velocity (U − Umf,i)/(Umf,f − Umf,i) approached 0.5 as shown in Fig. 6(b), bubbles commenced on the upper part of the gas distributor and then rose rapidly through the bed, which obviously enhanced the fluidization of the local region. The particles in the bed exhibited a circulating motion under the action of bubbles. As bubbles rose, the front of bubbles lifted up the upper particles, and the bubble wake also sucked up some particles to bed surface. Subsequently, when the bubbles burst on the bed surface, the particles they carried were thrown up and then settled down. Meanwhile, the local cavities formed by the rising bubbles were filled with particles around them. It is important to note that the particles with different properties exhibited different flowing distances, thus forming a separation. As the gas velocity increased to near final fluidization velocity, the number and size of bubbles dramatically increased, and a more obvious separation phenomenon can be observed in Fig. 6(c).
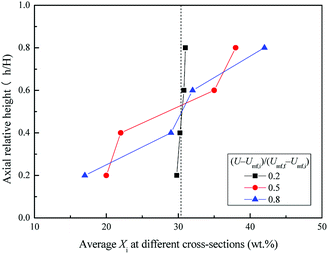
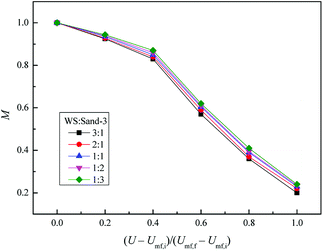
Fig. 7 and 8 show the axial and radial distribution of WS mass fraction at different gas velocities in the semi-fluidized region. With the increase of gas velocity, the initial well-mixed binary system gradually exhibited the separation behavior along the axial and radial direction. In detail, the WS particles gradually floated upward to bed surface along the axial direction, and the sand particles sunk to the bottom. At the lower layer, the mass fraction of WS was low in the center and high in the side wall along the radial direction, whereas it showed an opposite trend at the upper layer. With the increase of gas velocity shown in Fig. 9, the changes of M at different blending ratios were not significant and showed similar tendencies of decreasing slowly at first and then decreasing sharply. The global separation phenomenon in the posterior segment of the M-curve was mainly attributed to bubble growth, movement, coalescence and breakup.
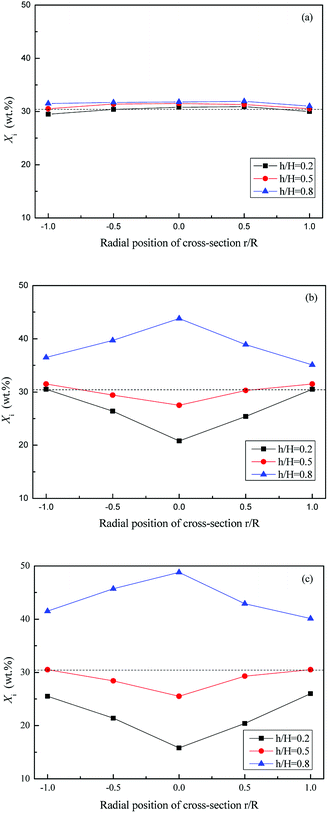 | ||
| Fig. 8 Radial distribution of Xi at different gas velocities in semi-fluidized region, (U − Umf,i)/(Umf,f − Umf,i): (a) 0.2; (b) 0.5; (c) 0.8. | ||
Mixing and segregation in the completely fluidized region
Fig. 10 shows the snapshots of mixing and segregation of WS/sand-3 mixture at high gas velocity ranging from Umf,f to 5Umf,f. As shown in Fig. 10(a), when the gas velocity was Umf,f, the distinct global segregation state can be observed in the whole bed. The upper part of the bed exhibited an intense fluidized state, while sand particles were deposited in the lower part and vibrated up and down as a dense phase. It can be clearly found that as the gas velocity approached 2Umf,f, a large number of bubbles burst in the bed, composed by the bottom growth zone, middle aggregation zone and top eruption zone along the axial direction, and sand particles at the bed bottom were gradually entrained by the bubbles' wake to move upward, which greatly intensified the circulation of the bed particles. This tendency became even more pronounced when the gas velocity was further increased to 3Umf,f as shown in Fig. 10(c). In particular, once the gas velocity exceeded 3Umf,f as shown in Fig. 10(d) and (e), the whole bed was better expanded and tended to be uniform, and no channels were observed. This is because the increasing gas velocity causes a larger gas drag force for both sand and biomass.31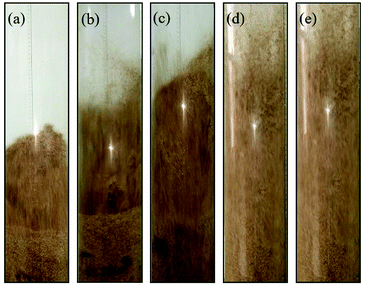 | ||
Fig. 10 Flow patterns of the binary mixture (WS![[thin space (1/6-em)]](https://www.rsc.org/images/entities/char_2009.gif) : :![[thin space (1/6-em)]](https://www.rsc.org/images/entities/char_2009.gif) sand-3 = 1 sand-3 = 1![[thin space (1/6-em)]](https://www.rsc.org/images/entities/char_2009.gif) : :![[thin space (1/6-em)]](https://www.rsc.org/images/entities/char_2009.gif) 1) observed at different gas velocities. (a) U/Umf,f = 1; (b) U/Umf,f = 2; (c) U/Umf,f = 3; (d) U/Umf,f = 4; (e) U/Umf,f = 5. 1) observed at different gas velocities. (a) U/Umf,f = 1; (b) U/Umf,f = 2; (c) U/Umf,f = 3; (d) U/Umf,f = 4; (e) U/Umf,f = 5. | ||
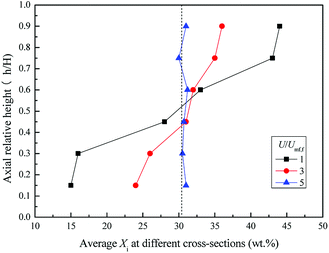
Fig. 11 and 12 depict the axial and radial distribution of the WS mass fraction at different gas velocities in the completed fluidized region. Contrary to the semi-fluidized region, the WS and sand particles that were separated globally at the end of the semi-fluidized region were gradually mixed again with the increase of gas velocity. As a function of operation conditions, mixing and separation behaviors occurred simultaneously and competed with each other in the process of fluidization of the mixture bed material. It was found that gas velocity is a key factor affecting the competition between mixing and segregation. For a certain gas velocity, the two behaviors reached a dynamic equilibrium, forming a relatively stable distribution of WS and sand particles in the bed. As the gas velocity increased, the excess gas led to vigorous air bubbles agitating the entire bed, and the mixing process gradually became the dominant position, eventually forming a completely mixed state, as shown in Fig. 10(d).
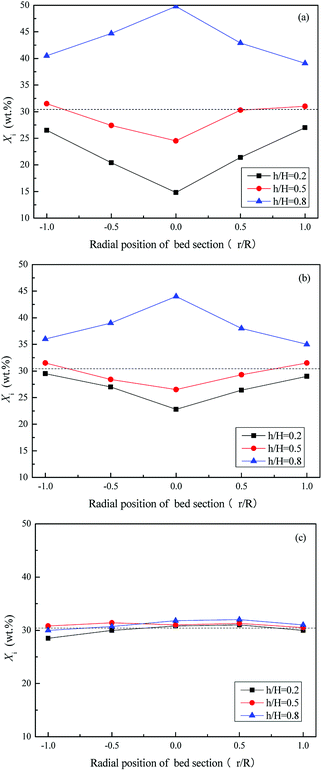 | ||
| Fig. 12 Radial distribution of Xi at different gas velocities in the completely fluidized region. (a) U/Umf,f = 1; (b) U/Umf,f = 3; (c) U/Umf,f = 5. | ||
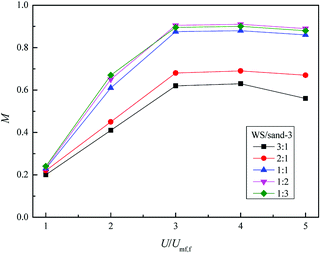
Fig. 13 depicts the relationship between M and the dimensionless gas velocity U/Umf,f at different blending ratios. With the increase of gas velocity, the change trend of M increased sharply at first, then tended to be a stable value, and finally decreased slightly since the excessive gas velocity entrained biomass particles to freeboard, causing the segregation again as shown in the upper area of Fig. 10(e). For WS/sand-3 binary mixtures, the operating gas velocity should be controlled in the range of 3–4 U/Umf,f to obtain a better mixing quality.
In addition, the inherent characteristics of the bed mixture, especially the volume ratio of biomass and fluidizing medium, also had a direct effect on the mixing performance of the bed. Initially, the M of WS/sand-3 system increased obviously with the increase of sand-3 addition ratio. When the volume fraction reached 1![[thin space (1/6-em)]](https://www.rsc.org/images/entities/char_2009.gif) :
:![[thin space (1/6-em)]](https://www.rsc.org/images/entities/char_2009.gif) 1, the binary system showed a good mixing state in the range of 3–4 U/Umf,f, M = 0.9; subsequent further increases in the amount of addition had few effects on the mixing quality.
1, the binary system showed a good mixing state in the range of 3–4 U/Umf,f, M = 0.9; subsequent further increases in the amount of addition had few effects on the mixing quality.
Conclusions
The fluidization behaviors of walnut shell assisted by different-sized sands at different blending ratios were investigated experimentally using a cold visual fluidized bed in this study. Different from the fluidization characteristics of one-component particles, WS/sand mixtures showed a transition interval rather than a threshold from fixed to fluidized bed, but the range of transition interval was significantly different. Compared with sand-1/WS and sand-2/WS, the transition interval range of sand-3/WS was significantly narrower and had a larger Rf and smaller ES, which meant that the blend with sand-3 as fluidizing medium was more conducive to improving the fluidization quality of the WS. In addition, gas velocity and sand-3 addition amount both had a crucial influence on the mixing and segregation of the WS/sand-3 binary system. With the increase of gas velocity, the initial well-mixed material gradually exhibited segregation behavior along the axial and radial direction in the semi-fluidized region. Further increasing the gas velocity, the global segregated WS and sand particles formed at the end of the semi-fluidized region were gradually mixed again in the completely fluidized region. For WS/sand-3 binary mixtures, the operating gas velocity should be controlled in the range of 3–4 U/Umf,f, and the volume fraction of the sand-3 blend should be above 50% to obtain a better mixing quality.Conflicts of interest
There are no conflicts to declare.Acknowledgements
The authors are grateful for the National Natural Science Foundation of China (51676179).References
- S. Aramideh, Q. Xiong, S.-C. Kong and R. C. Brown, Fuel, 2015, 156, 234–242 CrossRef CAS
.
- K. Li, C. Zhu, L. Zhang and X. Zhu, Bioresour. Technol., 2016, 209, 142–147 CrossRef CAS PubMed
.
- D. Chen, Y. Li, K. Cen, M. Luo, H. Li and B. Lu, Bioresour. Technol., 2016, 218, 780–788 CrossRef CAS PubMed
.
- N. Dong, K. Luo and Q. Wang, Fuel Process. Technol., 2017, 161, 199–203 CrossRef CAS
.
- K. Duanguppama, N. Suwapaet and A. Pattiya, J. Anal. Appl. Pyrolysis, 2016, 118, 63–74 CrossRef CAS
.
- P. Roy and G. Dias, Renewable Sustainable Energy Rev., 2017, 77, 59–69 CrossRef CAS
.
- P. C. Tarves, C. A. Mullen and A. A. Boateng, ACS Sustainable Chem. Eng., 2016, 4, 930–936 CrossRef CAS
.
- Y.-J. Zhang, J.-J. Wang, X.-P. Gu, L.-F. Feng and B. Wu, Chem. Eng. Res. Des., 2016, 111, 353–361 CrossRef CAS
.
- P. Salatino and R. Solimene, Powder Technol., 2017, 316, 29–40 CrossRef CAS
.
- Q. Xue, D. Dalluge, T. J. Heindel, R. O. Fox and R. C. Brown, Fuel, 2012, 97, 757–769 CrossRef CAS
.
- X. Wu, K. Li, F. Song and X. Zhu, BioResources, 2017, 12, 3546–3559 CAS
.
- Z. Fu, Y. Zhao, X. Yang and C. Duan, Sep. Sci. Technol., 2017, 52, 2017–2028 CrossRef CAS
.
- R. Girimonte, B. Formisani and V. Vivacqua, Chem. Eng. J., 2018, 335, 63–73 CrossRef CAS
.
- M. Kiani, M. R. Rahimi, S. H. Hosseini and G. Ahmadi, Particuology, 2017, 32, 132–140 CrossRef CAS
.
- E. Cano-Pleite, F. Hernández-Jiménez, A. Acosta-Iborra, T. Tsuji and C. R. Müller, Powder Technol., 2017, 316, 101–110 CrossRef CAS
.
- J. Chladek, C. K. Jayarathna, B. M. Moldestad and L.-A. Tokheim, Chem. Eng. Sci., 2018, 177, 151–162 CrossRef CAS
.
- J. He, M. Tan, Y. Zhao, C. Duan, Y. He and Z. Luo, J. Taiwan Inst. Chem. Eng., 2016, 61, 223–233 CrossRef CAS
.
- N. H. Dong, W. S. Liu, X. Y. Shen and Q. Wang, J. Biobased Mater. Bioenergy, 2017, 11, 89–100 CrossRef CAS
.
- B. Estejab, G. C. Nyendu, F. Agblevor and F. Battaglia, Chem. Eng. Res. Des., 2017, 120, 1–14 CrossRef CAS
.
- J. G. Hwang, H. S. Choi and J. H. Kwon, J. Mater. Cycles Waste Manage., 2015, 18, 771–780 CrossRef
.
- K. L. Clarke, T. Pugsley and G. A. Hill, Chem. Eng. Sci., 2005, 60, 6909–6918 CrossRef CAS
.
- A. Köhler, A. Rasch, D. Pallarès and F. Johnsson, Powder Technol., 2017, 316, 492–499 CrossRef
.
- F. P. Di Maio, A. Di Renzo and V. Vivacqua, Chem. Eng. Sci., 2013, 97, 139–151 CrossRef CAS
.
- J. Jaafari, A. Mesdaghinia, R. Nabizadeh, M. Hoseini and A. H. Mahvi, J. Environ. Health
Sci. Eng., 2014, 12, 139 CrossRef PubMed
.
- H. Yuan and R. Liu, J. Therm. Anal. Calorim., 2007, 89, 983–986 CrossRef CAS
.
- D. Gauthier, S. Zerguerras and G. Flamant, Chem. Eng. J., 1999, 74, 181–196 CrossRef CAS
.
- M. Fang, L. Yang, G. Chen, Z. Shi, Z. Luo and K. Cen, Fuel Process. Technol., 2004, 85, 1273–1282 CrossRef CAS
.
- J. Reina, E. Velo and L. Puigjaner, Powder Technol., 2000, 111, 245–251 CrossRef CAS
.
- B. Formisani, R. Girimonte and V. Vivacqua, Powder Technol., 2014, 266, 228–235 CrossRef CAS
.
- Y. Shao, W. Zhong and A. Yu, Powder Technol., 2016, 304, 73–80 CrossRef CAS
.
- Y. Zhang, B. Jin and W. Zhong, Chem. Eng. Process., 2009, 48, 745–754 CrossRef CAS
.
| This journal is © The Royal Society of Chemistry 2018 |

