
 Open Access Article
 This Open Access Article is licensed under a Creative Commons Attribution-Non Commercial 3.0 Unported Licence
Conversion of levulinic acid to γ-valerolactone over Ru/Al2O3–TiO2 catalyst under mild conditions
Ruifeng Wangab,
Lungang Chenb,
Xinghua Zhang *b,
Qi Zhangb,
Yuping Lib,
Chenguang Wangb and
Longlong Mab
*b,
Qi Zhangb,
Yuping Lib,
Chenguang Wangb and
Longlong Mab
aNano Science and Technology Institute, University of Science and Technology of China, Suzhou 215123, P. R. China
bGuangzhou Institute of Energy Conversion, Chinese Academy of Sciences, Guangzhou 510640, P.R. China. E-mail: zhangxh@ms.giec.ac.cn; Fax: +86 20 8705 7789; Tel: +86 20 8705 7790
First published on 7th December 2018
Abstract
Novel catalytic material with high catalytic activity and hydrothermal stability plays a key role in the efficient conversion of levulinic acid (LA) to γ-valerolactone (GVL) in water. In this study, mixed oxides Al2O3–TiO2, Al2O3–MoO3 and Al2O3–Co3O4 were synthesized by co-precipitation using aqueous solution of NaOH as precipitant. Ru catalysts supported on mixed oxides were prepared by impregnation method and their catalytic performances were tested in the hydrogenation of LA to GVL on a fixed bed reactor. The physicochemical properties of the catalysts were characterized by XRD, H2-TPR, NH3-TPD, and BET techniques. The TiO2 component significantly affected the acidity of the catalyst, and thus its catalytic activity for the GVL yield was affected. The desired product GVL with a yield of about 97% was obtained over the Ru/Al2O3–TiO2 catalyst under mild conditions (WHSV = 1.8 h−1, T = 80 °C). Moreover, the catalyst Ru/Al2O3–TiO2 exhibited excellent thermal stability in the test period of time.
Introduction
γ-Valerolactone (GVL), a versatile platform compound with high stability and low toxicity, can be used as fuel and viable intermediate for production of chemicals and solvents.1,2 It had been proposed to be one of the top 12 platform chemicals by the US Department of Energy.3 Moreover, GVL has been perceived as a potential replacement for ethanol in gasoline–ethanol blends because of their better lubricity, higher boiling points and low solubility in water.4 GVL can be produced from levulinic acid (LA) by hydrogenation and subsequent cyclization,5 and LA can be directly produced from lignocellulosic biomass via a simple hydrolysis process with pristine protonic acids.6,7 Therefore, it is an attractive route to produce GVL from LA economically.In the past years, extensive research had been conducted on the catalytic conversion of LA to GVL.5,8 Selective hydrogenation of LA to GVL was found to be an efficient method. Typically, base metal catalysts, such as Cu, Ni and Co, often show lower catalytic activity and relatively high temperature is required.9 To improve the catalytic activity, base metal catalysts modified by noble metal were explored. Results demonstrated that hydrogenation of LA to GVL can be achieved over the bi-metallic catalysts supported on neutral supports like active carbon, TiO2, ZrO2 and acid support like γ-Al2O3 at the temperature of 180–250 °C.10–13 It can be seen that high temperature is required in the conversion of LA to GVL over the base metal catalyst, which inevitably incur an energy cost for viable applications.
Fortunately, the conversion of LA to GVL can also be catalysed efficiently by noble metal catalysts under mild condition because of their excellent catalytic activity for hydrogenation.14–16 It had been reported that GVL yields are more than 90% over the catalysts of Ru, Pt and Pd at 90 °C.17,18 Sudhakar et al.19 had reported that hydroxyapatite (HAP)-supported Ru catalyst exhibited 99% yield of GVL from LA by hydrogenation at 70 °C and 0.5 MPa H2 pressure. However, LA conversion decreased to below 90% when the Ru/HAP was repeatedly used for 5 times. It is found that about 47% of Ru were leached into solution when Ru/Al2O3 was used as catalyst in the conversion of LA to GVL.18 Deteriorated hydrothermal stability of the catalyst has become a bottleneck restricting the production of GVL from LA. To improve the hydrothermal stability of catalyst, hydrogenation catalysts supported on water-tolerant materials, such as carbon20 and silica,21 had been tested. However, these catalysts had a low yield and selectivity for GVL. Chia et al.22 developed a new conversion method for the production of GVL from alkyl levulinates over ZrO2 catalysts. Rapid deactivation of the catalyst was also observed during a 100 h period. Arguably, more studies are required to develop a novel catalyst with longer service life.
The mixed oxides are usually attractive for the improvement of catalytic performance.23 To develop a novel material with high catalytic activity and hydrothermal stability, mixed oxides Al2O3–TiO2, Al2O3–Co3O4 and Al2O3–MoO3 were prepared in this study, and were used as carrier for Ru-based catalyst. Also, the catalytic activity was tested in the conversion of LA to GVL in water. It was found that Ru/Al2O3–TiO2 catalyst is capable of the efficient synthesis of GVL from LA in a continuous fixed bed reactor under mild condition. TiO2 is pristine material with excellent hydrothermal stability.23 The screening investigations have indicated that Ru/TiO2 catalyst can offer catalytic activity in the conversion of LA to GVL.24 For comparison purposes, the pure oxide TiO2 and Al2O3 were also used as carrier for Ru-based catalyst and were tested in the conversion of LA to GVL.
Experimental
Materials and catalyst preparation
Mixed oxides Al2O3–TiO2, Al2O3–Co3O4 and Al2O3–MoO3 were prepared based on the following methods.Al2O3–MoO3: solutions of (NH4)6Mo7O24 and Al (NO3)3 were mixed. With continuous stirring, sodium hydroxide solution was added into the mixed solution at 70 °C until the pH of the solution reached an approximate value of 8. The obtained precipitate was filtered and washed with distilled water. Then the obtained solid was dried at 80 °C for 12 h and calcined at 500 °C for 5 h, by which the complex oxide Al2O3–MoO3 (mole ratio of Al![[thin space (1/6-em)]](https://www.rsc.org/images/entities/char_2009.gif) :Mo = 1:1) was prepared and was designated as Al–Mo.
:Mo = 1:1) was prepared and was designated as Al–Mo.
Similar to that of Al2O3–MoO3, complex oxide Al2O3–Co3O4 (mole ratio of Al:Co = 1:1) was prepared using Al(NO3)3·9H2O and Co(NO3)2·6H2O as precursor and designated as Al–Co. Al2O3–TiO2 (mole ratio of Al:Ti = 1:1) was prepared using TiCl4 and Al(NO3)3 as precursor and designated as Al–Ti.
Ru-based catalysts with 5 wt% Ru loadings were prepared by impregnation. Specifically, support was dipped into the RuCl3 solution (0.1 mol l−1), followed by treating with ultrasonic irradiation for 2 h. After impregnation for 12 h, the solution was evaporated to dryness. Then, the obtained solid was dried at 120 °C overnight and calcined at 550 °C for 4 h. For comparison, Ru catalysts supported on Al2O3 and TiO2 were also prepared and designated as Ru/Al, Ru/Ti, respectively.
The prepared catalysts were crushed, sieved through 0.83–0.38 mm mesh before use.
Chemicals used in this study are C.P. reagents and purchased from Aladdin's Reagent Company.
Catalyst characterization
Specific surface area (SBET), pore diameter and pore volume of catalysts were determined by N2 isothermal adsorption (77 K) on physical adsorption instrument (Quantachrome Corporation NOVA-2100) according to BET and BJH theoretical models. The catalyst was pretreated at 200 °C for 12 h under vacuum condition before N2 adsorption.The crystal structure of the catalysts were analyzed by X-ray diffraction radiation (X Per Pro MPD with Cu Kα (λ = 0.15406 nm) radiation, Philip). The transmission electron microscope (TEM) images of the catalysts were obtained on an instrument (JEM-2100F).
The H2-TPR (H2 temperature-programmed reduction) analysis of catalyst was conducted on a chemisorption apparatus. The catalyst samples (100 mg) were pretreated at 300 °C for 1 h under an Ar flow and subsequently cooled to 50 °C. The reduction temperature increased to 800 °C with 10 °C min−1 in the flow of reduction gas (H2 + N2, 40 ml min−1). The H2 consumption was monitored by a thermal conductivity detector (TCD).
The XPS (X-ray photoelectron spectroscopy) analysis of Ru catalyst was carried out on the instrument of Thermo Scientific ESCALAB 250Xi employing a monochromated AlKα X-ray source.
The NH3-TPD (NH3 temperature-programmed desorption) analysis was also conducted on a chemisorption apparatus equipped with a TCD detector. Before ammonia adsorption, the catalyst samples (100 mg) were in situ reduced for 2 h at 300 °C in the flow of hydrogen and purged at 100 °C for 1 h with helium. The detailed method was described in a literature.25 The catalyst was pretreated at 200 °C under vacuum (1 × 10⁻⁴ Pa) for 1 h. Pyridine was introduced in the IR cell at room temperature. Desorption was carried out at 200 °C, and the catalyst was evacuated for 10 min prior to recording the IR spectra.
Experimental procedure
The catalytic activity test was performed in a fixed-bed stainless steel tube reactor (10 mm internal diameter). This reaction system is equipped with a mass flow controller for H2 supply and a HPLC pump for the continuous injection of levulinic acid solution. The pelletized catalyst (2.0 g) was packed in the middle of the reaction tube. The catalyst was reduced in the flow of H2 (40 ml min−1) for 4 h at 360 °C. Then, the hydrogenation reaction was conducted at desired temperature. The feedstocks were the mixtures of 95 wt% H2O and 5 wt% LA. Liquid product collected every 10 h was analyzed off-line by GC (SHIMADZU GC2014 with a flame ionization detector and a column of HP (30 m × 0.25 mm × 0.25 μm)) using external standard method. The vaporization temperature was 250 °C, and the oven temperature program ranged from 50 to 250 °C at the rate of 10 °C min−1. LA conversion (XLA) and product yield (YP) were calculated based on the following formulas:
 | (1) |
 | (2) |
The gas product obtained from the hydrogenation process was analyzed on a Gas Chromatogram (Agilent 6980) with a TCD (Thermal Conductivity Detector) and a FID (Flame Ionization Detector) using the external standard method.
The concentration of Al and Ru ions remaining in the liquid samples was determined by ICP-AES (Inductively coupled plasma-atomic emission spectroscopy, IRIS Advantage 1000, Thermo Electron Corporation).
Results and discussion
Catalyst characterization
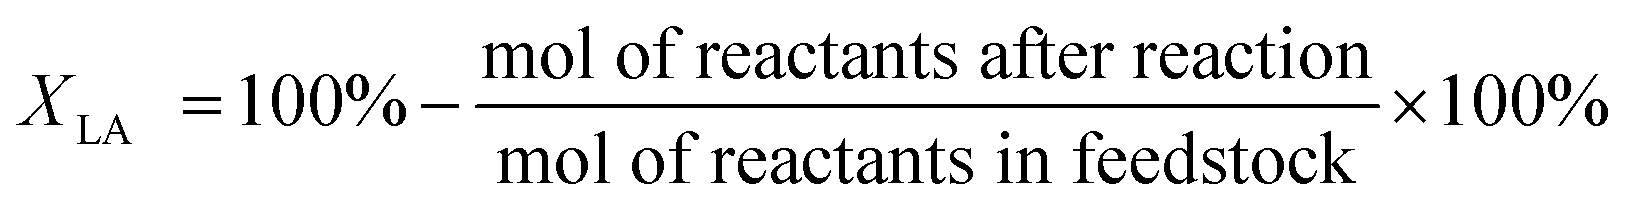
The textural properties of Ru catalysts, supported on different oxides, were summarized in Table 1 and Fig. 1. The pore size distribution of Ru catalysts supported on different mixed oxides is in the range of 2–50 nm. Compared with Ru/Al catalyst, the most probable pore diameter of the Ru catalysts supported on mixed oxides become larger. It should be noted that the surface areas and pore volumes of Ru/Al–Mo are larger than that of Ru/Al. A possible reason is that a large part of Al2O3 is dispersed on the surface of MoO3, resulting in the increase of the surface areas and pore volumes.| Catalyst | SBET (m2 g−1) | Pore volume (cm3 g−1) | Pore size (nm) |
|---|---|---|---|
| Ru/Al–Mo | 243 | 0.65 | 10.7 |
| Ru/Al–Co | 77 | 0.27 | 14 |
| Ru/Al–Ti | 98 | 0.24 | 9.8 |
| Ru/Al | 176 | 0.18 | 4.1 |
| Ru/Ti | 11 | 0.04 | 14.5 |
 | ||
| Fig. 1 Pore size distribution of different Ru catalysts. | ||
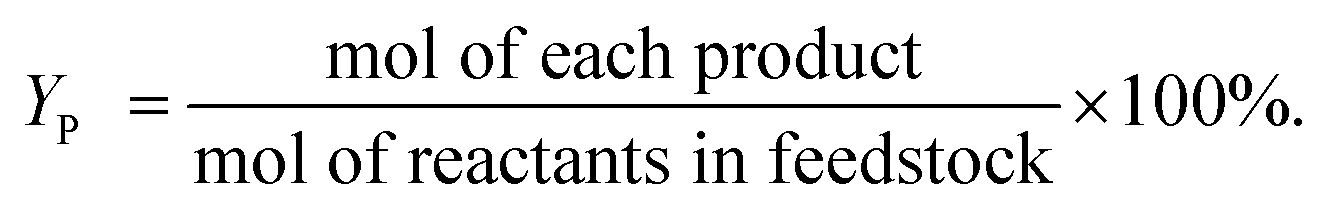
XRD patterns of samples were gathered in Fig. 2. The peaks assigned to Ru were not significant for all samples. Only one weak diffraction peak positioned at the 2θ of 38.4° was observed for all fresh catalysts, which were assigned to the (1 0 0) plane of Ru. This result suggests good dispersion of Ru metal. The size of Ru particles supported on different mixed oxides was determined by TEM. As shown in Fig. 3, most of Ru particle are in the range of approximately 2–5 nm. Especially for Ru/Al–Ti catalyst, the particle size of Ru are all in the range of 1–3 nm and the average particle size is 1.76 nm. Primo et al.24 had reported that the Ru particle with the size of about 2 nm exhibited the highest catalytic activity for hydrogenation.
 | ||
| Fig. 2 XRD patterns of different Ru-based catalysts. | ||
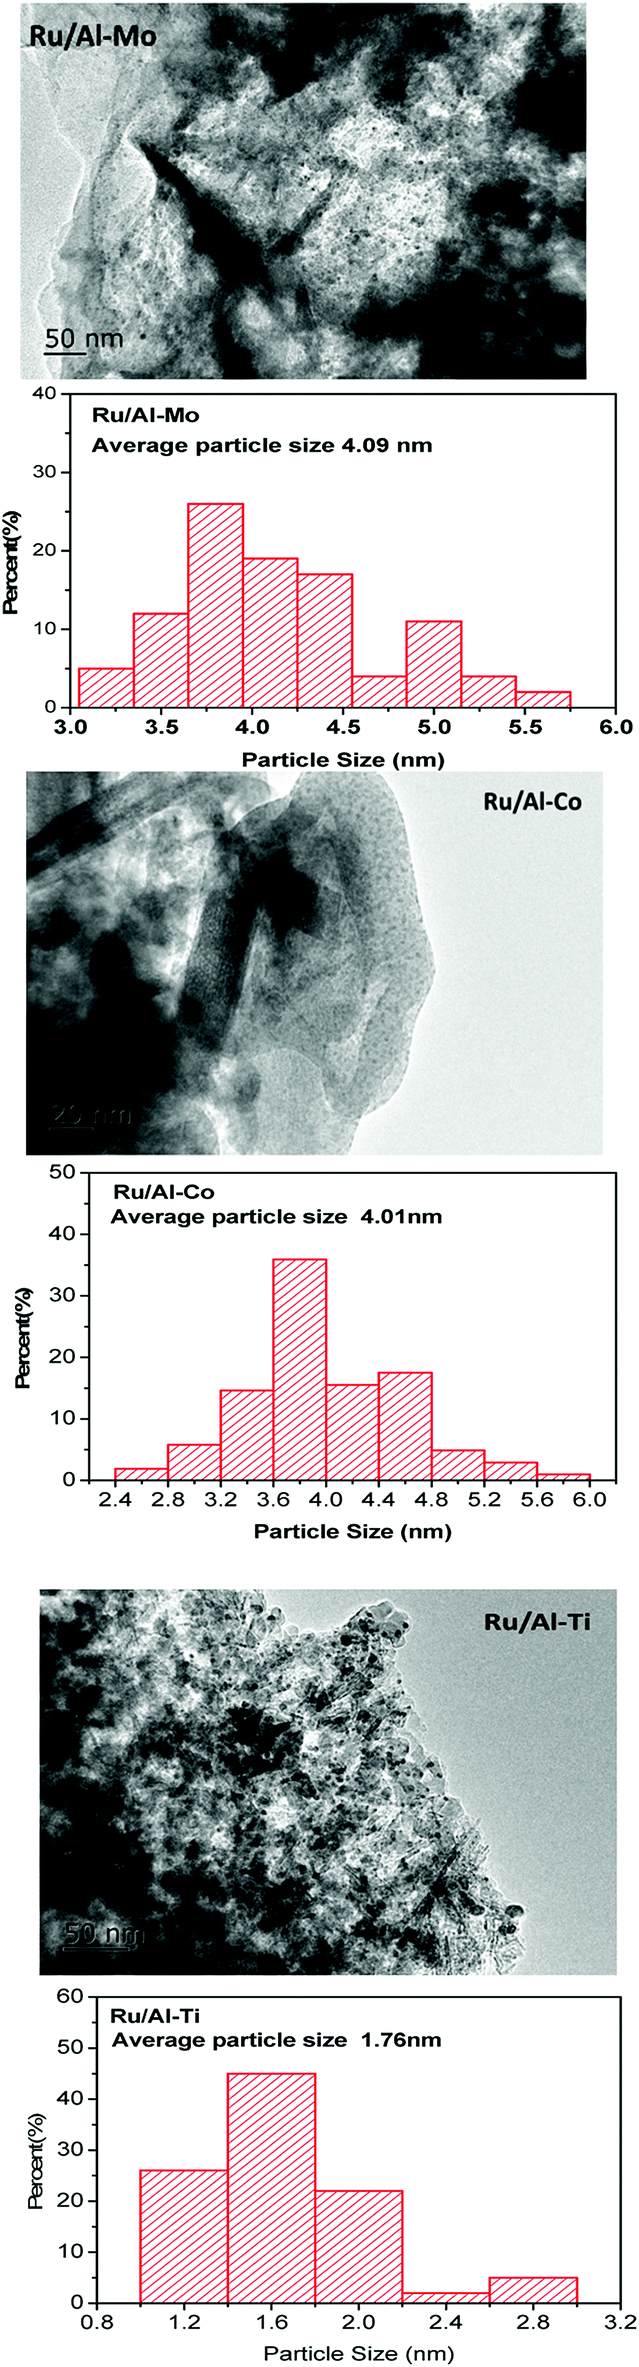 | ||
| Fig. 3 TEM images of different Ru-based catalysts and their particle size distributions. | ||
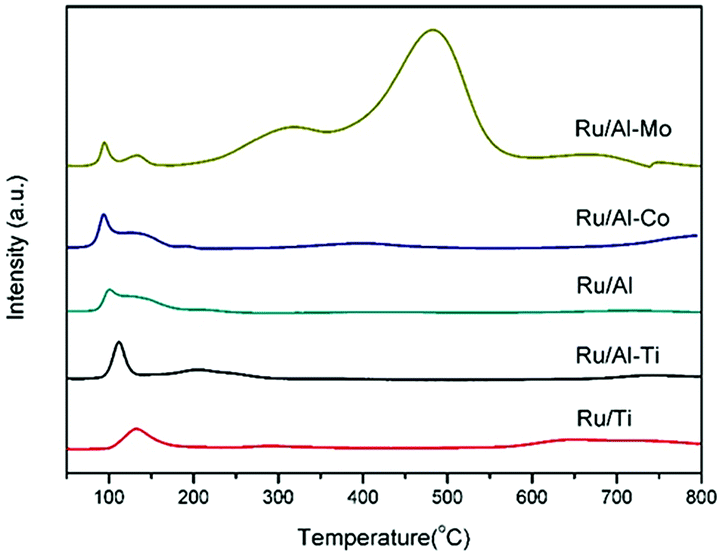
Fig. 4 gathered the H2-TPR profiles of the Ru-based catalysts. The peaks, positioned in the range of 90–250 °C, were observed for all of catalysts, which are attributed to the reduction of RuO2. The effect of support on the reduction of active metal is minor. Noticeably, two broad peaks centred at 316 °C and 485 °C were clearly observed in the profile of Ru/Al–Co catalyst. The former peak can be assigned to the reduction of Co3O4 to CoO and the latter can be attributed to the reduction of CoO to Co.26
 | ||
| Fig. 4 H2-TPR of the different Ru catalysts. | ||
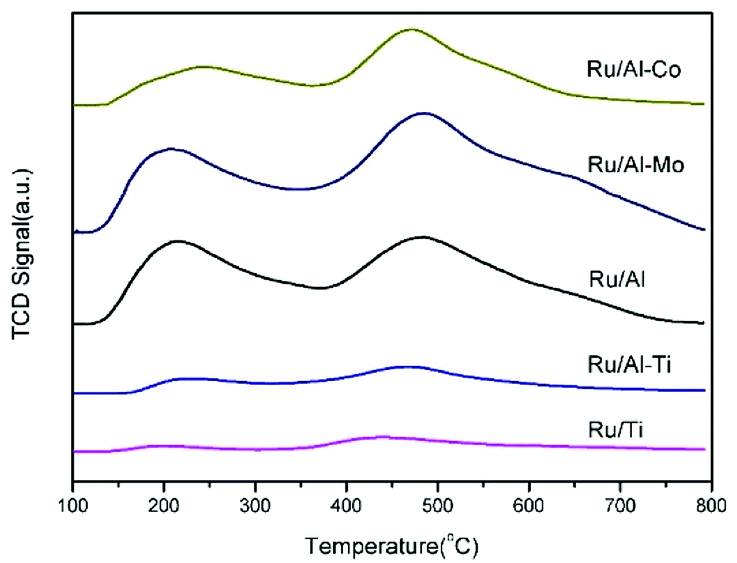
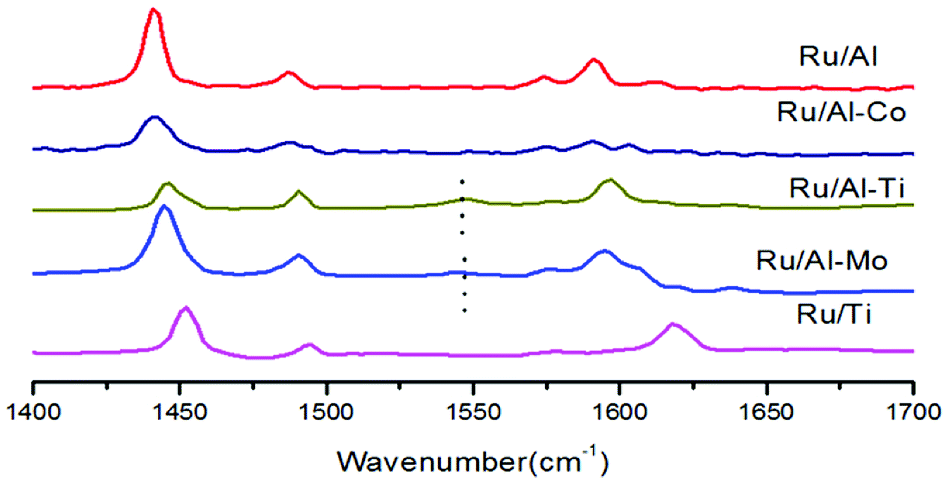
The acidity analysis of the supported Ru catalysts was carried out by NH3-TPD, and the results were presented in Fig. 5 and Table 2. Two clear peaks were observed in the desorption curves of NH3 for Ru/Al–Mo, Ru/Al–Co and Ru/Al catalysts. The first peak positioned in the range of 200–250 °C is assigned to medium acid sites, and the high-temperature desorption peak positioned in the range of 440–490 °C is assigned to strong acid sites.27 The acidity of TiO2 is very weak as expected and the amount of acid sites is little.8 It should be noted that the NH3-TPD profile of Ru/Ti–Al is rather close to that of Ru/Ti catalyst. A possible reason is that TiO2 was coated on the surface of Al2O3,28,29 leading to the less acidic sites of Ru/Ti–Al catalyst. The type of acidic sites is determined by infrared spectroscopy of pyridine adsorption. It can be found that Lewis acid sites (1450 cm−1) is dominant for all tested catalyst as shown in Fig. 6.
 | ||
| Fig. 5 NH3-TPD profiles of the different Ru catalysts. | ||
| Catalyst | 120–345 °C, mmol g−1 | 345–787 °C, mmol g−1 | Total acid sites, mmol g−1 |
|---|---|---|---|
| Ru/Al–Mo | 0.277 | 0.291 | 0.568 |
| Ru/Al–Co | 0.124 | 0.189 | 0.313 |
| Ru/Al–Ti | 0.040 | 0.063 | 0.103 |
| Ru/Al | 0.279 | 0.053 | 0.332 |
| Ru/Ti | 0.013 | 0.042 | 0.055 |
 | ||
| Fig. 6 Infrared spectra of pyridine adsorbed on Ru catalyst after evacuation at 200 °C. | ||
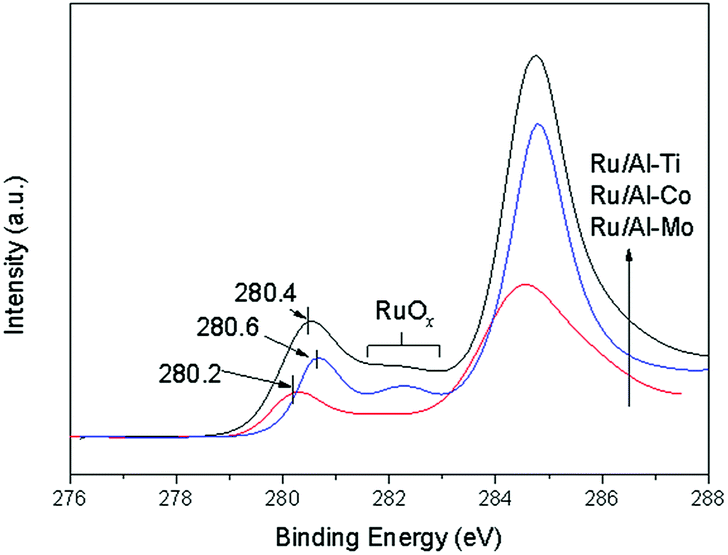
The Ru 3d XPS spectrum of Ru catalyst is presented in Fig. 7. The spectrum in the region of 283–287 eV is complex due to the overlapping of C 1s signal and Ru 3d doublet (5/2 and 3/2).30 The regions of 281.5–283 eV are assigned to RuOx, suggesting that ruthenium oxides remain at the catalyst surface even after reduction. Normally, the Ru 3d XPS spectrum should show a signal at 280.0 eV, which is attributed to Ru0.16 However, the signals of Ru0 were observed at 280.2 eV for Ru/Al–Mo, 280.4 eV for Ru/Al–Ti and 280.6 eV for Ru/Al–Co, respectively. The small shift of the BE (binding energy) may have been caused by the interaction between the metallic Ru0 and its support.31
 | ||
| Fig. 7 Ru 3d XPS spectrum of different catalyst. | ||
Catalyst testing
The hydrogenation of LA to GVL was carried out over the different Ru catalysts in an H2 flow of 40 ml min−1 and a WHSV (weight hourly space velocity) of 0.6 h−1. It is clear that the product distribution is significantly affected by catalyst and reaction temperature as shown in Fig. 8. GVL, 2-butanol and 1,4-pentanediol are the major products for the hydrogenation of LA. The lower GVL yield is observed over the Ru/Al–Co and Ru/Al–Mo catalysts in the investigated temperature range while higher GVL yield (80%) is obtained over Ru/Al–Ti catalyst at 80 °C. This difference could be attributed to the acidity of the catalyst. Generally, LA is hydrogenated into 4-hydroxy valeric acid over Ru active sites, and subsequently converted into GVL by dehydration.8,9 However, intermediate 4-hydroxy valeric acid could be converted to 2-butanol by decarboxylation, and GVL could be further converted to 1,4-pentanediol by hydrogenation as shown in Schemes 1. These side reactions are promoted by Ru catalyst with strong acidic support. As discussed in ‘NH3-TPD analysis’ section, the acidity of Ru/Al–Ti is far less than those of Ru/Al–Co and Ru/Al–Mo. So, it is plausible that the GVL yield over Ru/Al–Ti catalyst is higher than those of Ru/Al–Co and Ru/Al–Mo catalysts. In addition, side-reactions are favoured at higher temperature. There is a sudden increase of 1,4-pentanediol over Ru/Al–Co and Ru/Al–Mo catalysts at 220 °C. A possible reason is that the conversion of GVL to 1,4-pentanediol was promoted by Ru/Al–Co and Ru/Al–Mo catalysts at higher temperature. As far as Ru/Al–Ti is concerned, the yield of by-product 2-butanol is higher than that of the desired product GVL at 180 °C and 220 °C, as shown in Fig. 8. The major reason is that the decarboxylation reaction of intermediate 4-hydroxy pentanoic acid was promoted at higher temperature, leading to the increase of 2-butanol.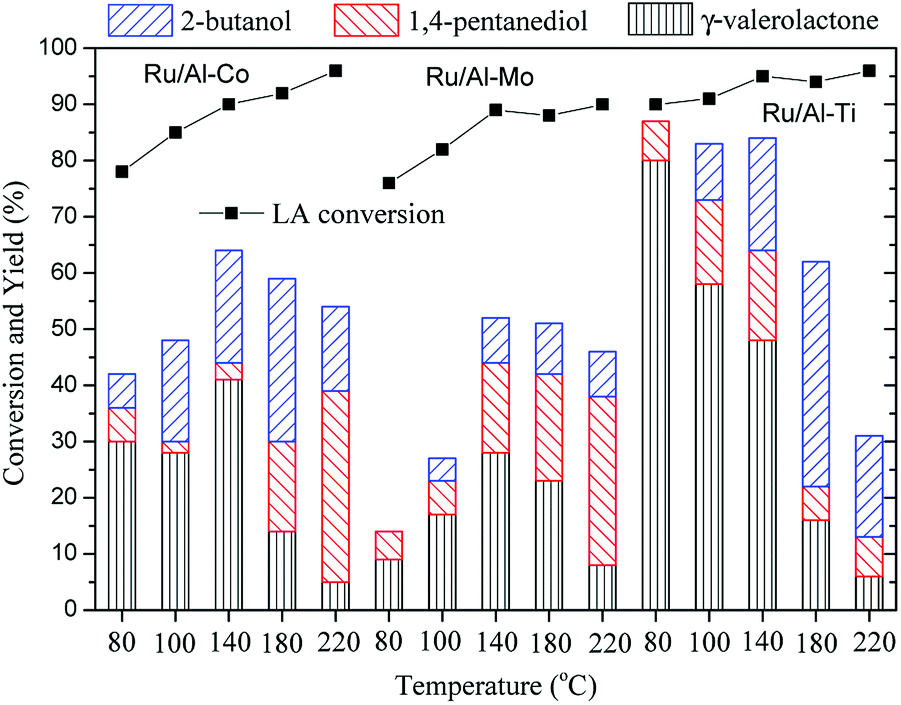 | ||
| Fig. 8 Conversion of LA to GVL over different Ru catalysts. Reaction conditions. PH2 = 4.0 MPa, H2 flow: 40 ml min−1; WHSV: 0.6 h−1. | ||
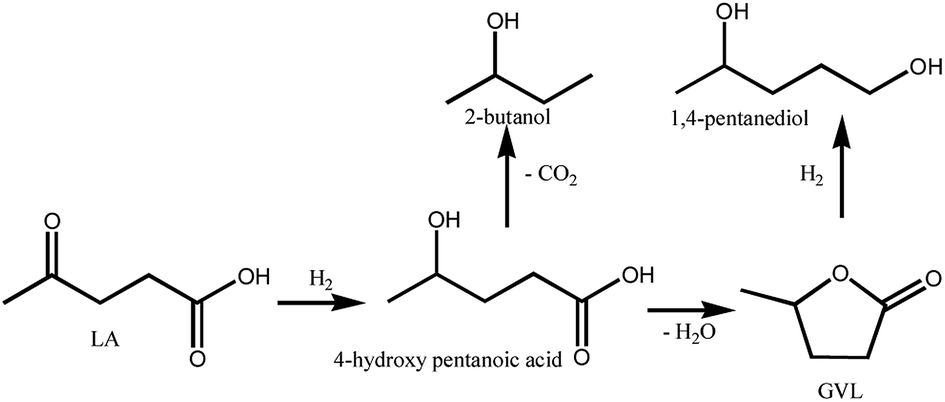 | ||
| Scheme 1 The possible reaction pathways for conversion of LA to GVL. | ||
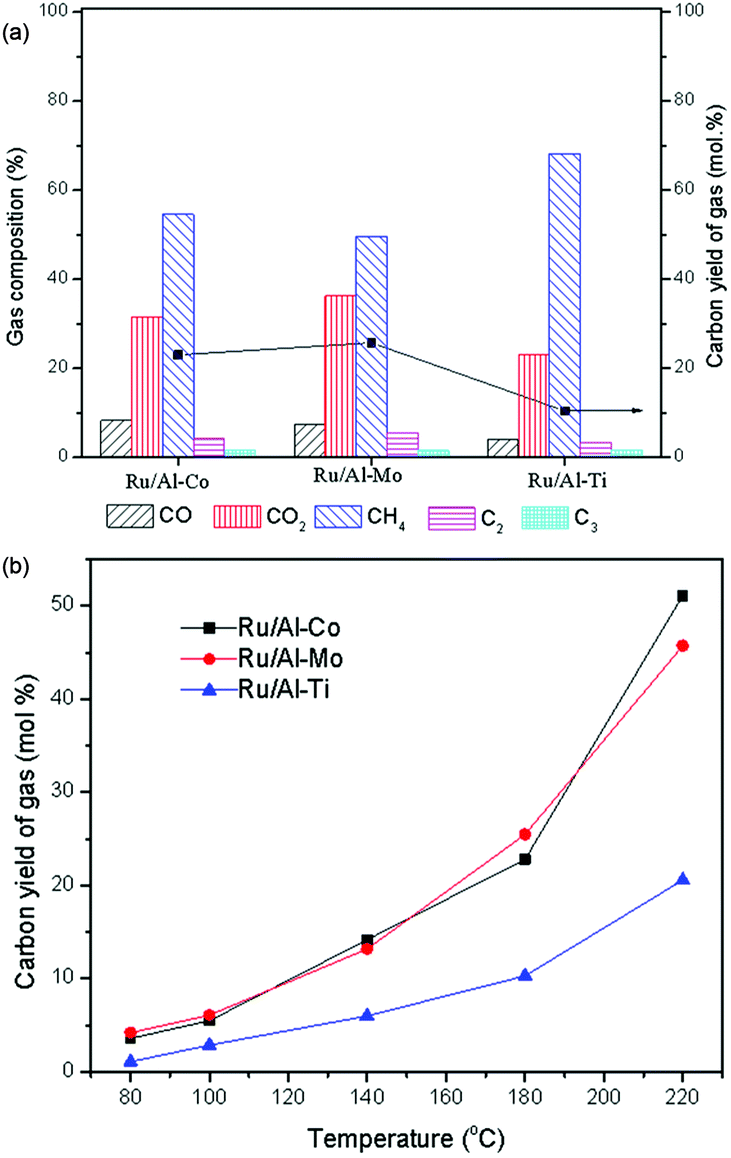
As shown in Fig. 9(a), the components of CO, CO2, CH4, C2+ were detected in the gas product. These gas products were derived from LA, GVL and intermediates via aqueous phase reforming with Ru catalyst. For example, apart from the decarboxylation,32 the formation of CO2 may also be considered to be a catalytic decomposition of the reactants to form CO, combined with the conversion of CO and H2O to produce CO2. Cleavage of C–C and C–O bonds can be completed by hydrogenolysis over Ru catalyst in the presence of H2, thereby producing the smaller hydrocarbon molecule.33 Similar reactions had been reported.34,35 Arguably, higher temperature can promote the aqueous phase reforming (Fig. 9(b)). This is the reason that LA conversion increases at higher temperature, but the product yield does not increase in synchronization, as shown in Fig. 8.
 | ||
| Fig. 9 Effects of catalysts and reaction temperature on gas compositions. Reaction conditions: (a) T = 180 °C; PH2 = 4.0 MPa, H2 flow: 40 ml min−1; WHSV = 0.6 h−1; (b) PH2 = 4.0 MPa, H2 flow: 40 ml min−1; WHSV = 0.6 h−1. | ||
To explore the effect of mixed oxides on the catalytic activity, the hydrogenation of LA over Ru catalyst supported on pure oxide was also conducted at 80 °C. As shown in Fig. 10, the GVL yields were only 41.6% and 21.8% over Ru/Al and Ru/Ti catalysts, respectively. For the Ru/Ti catalyst, the deteriorated porous and small surface area might be the root cause for the lower GVL yield of the Ru/Ti catalyst. As for the Ru/Al catalyst, it is similar to that of Ru/Al–Co and Ru/Al–Mo catalysts, the strong acidity of the catalyst results in the lower yield of desired product. On the contrary, the GVL yield drastically increased to 80% when Ru/Al–Ti was used as catalyst. This result suggests that mixed oxides have significant advantages in improving catalytic activity.
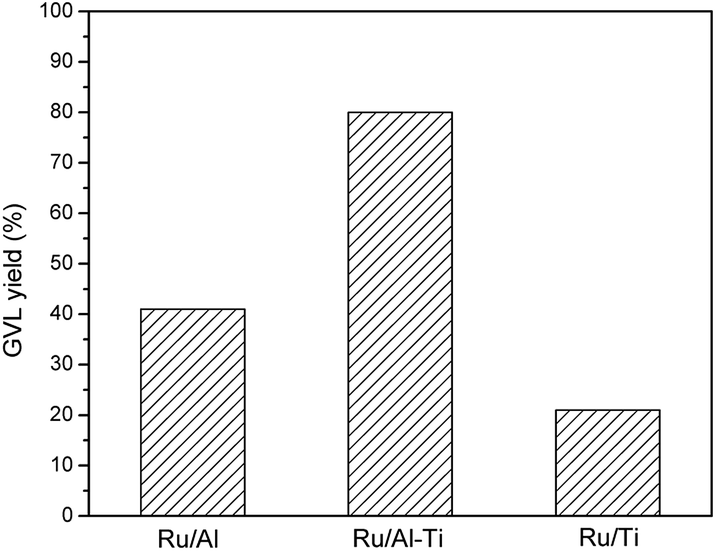 | ||
| Fig. 10 Comparison for the effect of mixed oxides and pure oxide. Reaction conditions: T = 80 °C; PH2 = 4.0 MPa; H2 flow: 40 ml min−1; WHSV = 0.6 h−1. | ||
Effect of WHSV
The effect of WHSV was also investigated at 80 °C using Ru/Al–Ti as catalyst. As shown in Fig. 11, GLV yield gradually increased in the range of 0.6–1.8 h−1. It is explained that the product GVL could be taken out instantaneously from the reactor due to the increased WHSV, avoiding the aqueous phase reforming of GVL. However, GVL yield decreased slightly when the WHSV was further increased to 2.4 h−1. Therefore, the next work for conversion of LA to GVL was carried out with a WHSV of 1.8 h−1.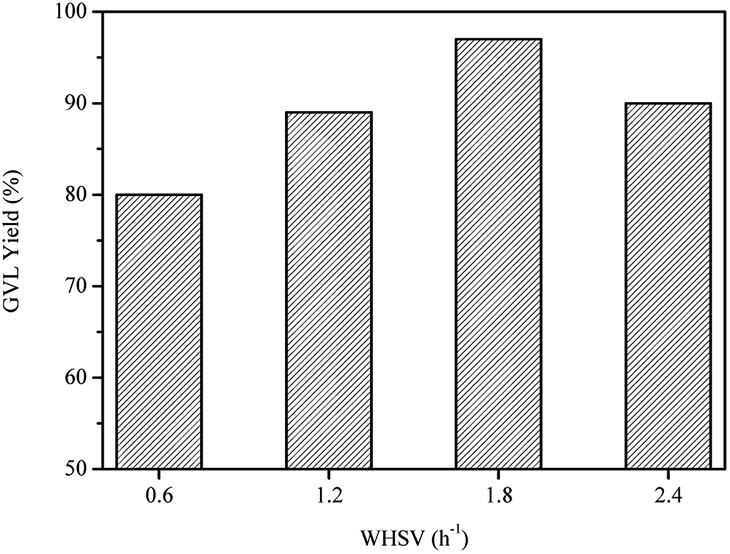 | ||
| Fig. 11 Effect of WHSV on the conversion of LA to GVL over Ru/Al–Ti catalyst. Reaction conditions: T = 80 °C; PH2 = 4.0 MPa; H2 flow: 40 ml min−1. | ||
Stability of catalyst
The stability of Ru catalysts was tested with a WHSV of 1.8 h−1 at 80 °C. As shown in Fig. 12, GVL yield is about 97% over Ru/Al–Ti catalyst and remains constant within the tested 120 h while the GVL yield is constant at about 26% over Ru/Ti catalyst. As for the Ru/Al catalyst, the GVL yield decreases gradually with the lengthened reaction time. This result suggests that Ru/Al catalyst was deactivated gradually in the reaction process. It had been reported that large amounts of Ru and Al were leached into the solution during the conversion of LA to GVL with Ru/Al2O3 catalyst, which resulted in a decrease in catalytic activity.18 In this study, we also detected the concentration of aluminium and ruthenium ions in the collected liquid samples, and the results were listed in Table 3. It is clear that the large amount of Al and Ru ions were leached from the Ru/Al catalyst. A reasonable explanation is that the alumina was corroded and leached when exposed to acid (levulinic acid) in the aqueous solution. The interaction between Ru metal and carrier disappears when the γ-Al2O3 is leached, resulting in the leaching of Ru. It is thereby plausible that large amount of Al and Ru were detected in the collected liquid sample. Fortunately, leaching of Al and Ru is negligible for Ru/Al–Ti catalyst. This result may strongly suggest that the Ru catalyst supported on Al–Ti mixed oxides possesses excellent stability under hydrothermal condition. The major contribution should be attributed to the added TiO2 component, which is a kind of acid-tolerant material. It can be inferred that TiO2 is coated on the surface of Al2O3, which prevented the contact between acid and Al2O3, reducing the leaching of Al. This inference is consistent with the previous conclusions derived from NH3-TPD analysis.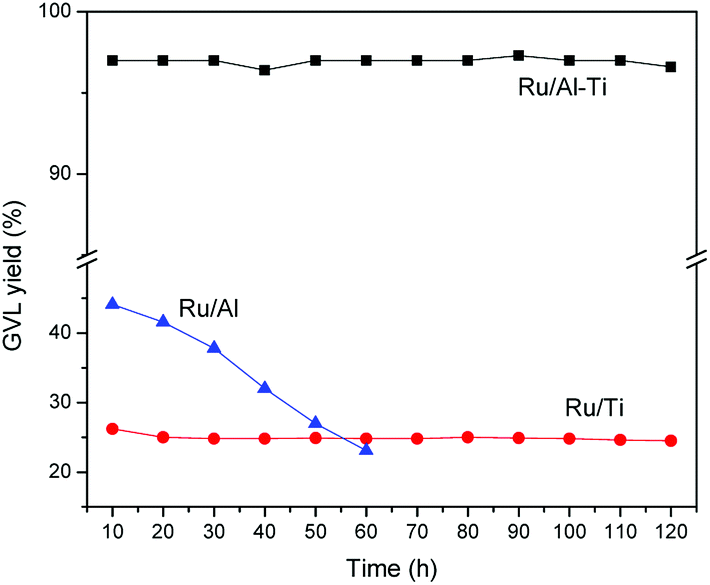 | ||
| Fig. 12 The stability test for Ru/Al–Ti catalyst. Reaction conditions: WHSV = 1.8 h−1; T = 80 °C; PH2 = 4.0 MPa; H2 flow: 40 ml min−1. | ||
| Catalyst | Time on stream (h) | Total leached Al (wt%) | Total leached Ru (wt%) |
|---|---|---|---|
| a Reaction conditions: T = 80 °C; PH2 = 4.0 MPa; H2 flow: 40 ml min−1; WHSV = 1.8 h−1. | |||
| Ru/Al | 30 | 2.1 | 35 |
| 60 | 3.6 | 44 | |
| Ru/Ti | 30 | — | 0.6 |
| 120 | — | 0.8 | |
| Ru/Al–Ti | 30 | 0.2 | 1.4 |
| 120 | 0.4 | 2.6 | |
Conclusions
Ru catalysts supported on mixed oxides Al2O3–TiO2, Al2O3–MoO3 and Al2O3–Co3O4 were studied for conversion of levulinic acid to γ-valerolactone. NH3-TPD results and catalytic behaviour revealed that the Ru metal combined with strong acidic sites of support could promote the aqueous phase reforming, resulting in the lower yield of GVL. TiO2 might be coated on the surface of Al2O3, weakening the acidity of mixed oxides Al2O3–TiO2. Therefore, Ru/Al2O3–TiO2 exhibited better catalytic activity for GVL yield than those of Ru/Al2O3–MoO3 and Ru/Al2O3–Co3O4. Moreover, Ru/Al2O3–TiO2 exhibited excellent stability under hydrothermal condition.Conflicts of interest
There are no conflicts to declare.Acknowledgements
This study was funded by the National Key Research and Development Plan (2017YFE0106600), the National Key Technology R&D Program (2015BAD15B06), the Science and Technology Planning Project of Guangdong Province (2014A01016020), the “Transformational Technologies for Clean Energy and Demonstration”, Strategic Priority Research Program of the Chinese Academy of Sciences (No. XDA 21060102) and the Youth Innovation Promotion Association CAS (No. 2015288).Notes and references
- S. G. Wettstein, D. M. Alonso, E. I. Gürbüz and J. A. Dumesic, Curr. Opin. Chem. Eng., 2012, 1, 218 CrossRef CAS
.
- J. Zhang and N. Yan, ChemCatChem, 2017, 9, 2790 CrossRef CAS
- J. J. Bozell and G. R. Petersen, Green Chem., 2010, 12, 539 RSC
- I. T. Horvath, H. Medhi, V. Fabos, L. Boda and L. T. Mika, Green Chem., 2008, 10, 238 RSC
- W. R. H. Wright and R. Palkovits, ChemSusChem, 2012, 5, 1 CrossRef
- D. W. Rackemann and W. O. S. Doherty, Biofuels, Bioprod. Biorefin., 2011, 5, 198 CrossRef CAS
- J. Tan, Q. Liu, L. Chen, T. Wang, L. Ma and G. Chen, J. Energy Chem., 2017, 26, 115 CrossRef
- W. Luo, M. Sankar, A. M. Beale, Q. He, C. J. Kiely, P. C. A. Bruijnincx and B. M. Weckhuysen, Nat. Commun., 2015, 6, 6540 CrossRef PubMed
- R. Yoshida, D. Sun, Y. Yamada, S. Sato and G. J. Hutchings, Catal. Commun., 2017, 97, 79 CrossRef CAS
- X. L. Du, L. He, S. Zhao, Y. M. Li, Y. Cao, H. Y. He and K. N. Fan, Angew. Chem., Int. Ed., 2011, 50, 7815 CrossRef CAS PubMed
- P. P. Pravin, J. M. Lee, D. W. Hwang, S. B. Halligudi, Y. K. Hwang and J. S. Chang, J. Ind. Eng. Chem., 2011, 17, 287 CrossRef
- A. M. Hengne and C. V. Rode, Green Chem., 2012, 14, 1064 RSC
- D. J. Braden, C. A. Henao, J. Heltzel, C. C. Maravelias and J. A. Dumesic, Green Chem., 2011, 13, 1755 RSC
- W. Deng, Y. Wang, S. Zhang, K. M. Gupta, M. J. Hülsey, H. Asakura, L. Liu, Y. Han, E. M. Karp, G. T. Beckham, P. J. Dyson, J. Jiang, T. Tanaka, Y. Wang and N. Yan, Proc. Natl. Acad. Sci. U. S. A., 2018, 115, 5093 CrossRef CAS
- Y. Wang, S. De and N. Yan, Chem. Commun., 2016, 52, 6210 RSC
- R. S. Suppino, R. Landers and A. J. G. Cobo, Appl. Catal., A, 2016, 525, 41 CrossRef CAS
- C. Moreno-Marrodan and P. Barbaro, Green Chem., 2014, 16, 3434 RSC
- A. S. Piskun, J. E. de Haan, E. Wilbers, H. H. van de Bovenkamp, Z. Tang and H. J. Heeres, ACS Sustainable Chem. Eng., 2016, 4, 2939 CrossRef CAS
- M. Sudhakar, M. Lakshmi Kantam, V. Swarna Jaya, R. Kishore, K. V. Ramanujachary and A. Venugopal, Catal. Commun., 2014, 50, 101 CrossRef CAS
- A. S. Amarasekara and M. A. Hasan, Catal. Commun., 2015, 60, 5 CrossRef CAS
- P. P. Upare, J. M. Lee, Y. K. Hwang, D. W. Hwang, J. H. Lee, S. B. Halligudi, J. S. Hwang and J. S. Chang, ChemSusChem, 2011, 4, 1749 CrossRef CAS PubMed
- M. Chia and J. A. Dumesic, Chem. Commun., 2011, 47, 12233 RSC
- G. Murali Dhar, B. N. Srinivas, M. S. Rana, M. Kumar and S. K. Maity, Catal. Today, 2003, 86, 45 CrossRef
- A. Primo, P. Concepcion and A. Corma, Chem. Commun., 2011, 47, 3613 RSC
- X. Zhang, T. Wang, L. Ma and C. Wu, Fuel, 2010, 89, 2697 CrossRef CAS
- T. M. Sankaranarayanan, A. Berenguer, C. Ochoa-Hernández, I. Moreno, P. Jana, J. M. Coronado, D. P. Serrano and P. Pizarro, Catal. Today, 2015, 243, 163 CrossRef CAS
- S. Pichaikaran and P. Arumugam, Green Chem., 2016, 18, 2888 RSC
- V. Rodríguez-González, R. Zanella, G. Angel and R. Gómez, J. Mol. Catal. A: Chem., 2008, 281, 93 CrossRef
- A. Adamczyk and E. Długoń, Spectrochim. Acta, Part A, 2012, 89, 11 CrossRef CAS
- J. Balcerzak, W. Redzynia and J. Tyczkowski, Appl. Surf. Sci., 2017, 426, 852 CrossRef CAS
- P. P. Upare, M. Lee, S.-K. Lee, J. W. Yoon, J. Bae, D. W. Hwang, U.-H. Lee, J.-S. Chang and Y. K. Hwang, Catal. Today, 2016, 265, 174 CrossRef CAS
- L. Chen, Y. Li, X. Zhang, Q. Zhang, T. Wang and L. Ma, Appl. Catal., A, 2014, 478, 117 CrossRef CAS
- G. W. Huber and J. A. Dumesic, Catal. Today, 2006, 111, 119 CrossRef CAS
- G. W. Huber, R. D. Cortright and J. A. Dumesic, Angew. Chem., Int. Ed., 2004, 43, 1549 CrossRef CAS PubMed
- J. N. Chheda, G. W. Huber and J. A. Dumesic, Angew. Chem., Int. Ed., 2007, 46, 7164 CrossRef CAS PubMed
| This journal is © The Royal Society of Chemistry 2018 |