 Open Access Article
Enhanced properties of Pd/CeO2-nanorods modified with alkaline-earth metals for catalytic oxidation of low-concentration methane†
Tianyu Guo‡
ab,
Xiaorong Nie‡c,
Jianping Du*bc and
Jinping Li *bd
*bd
aCollege of Environmental Science and Engineering, Taiyuan University of Technology, 030024 Shanxi, PR China
bShanxi Key Laboratory of Gas Energy Efficient and Clean Utilization, 030024 Shanxi, PR China. E-mail: dujp518@163.com; jpli211@hotmail.com
cCollege of Chemistry and Chemical Engineering, Taiyuan University of Technology, 030024 Shanxi, PR China
dResearch Institute of Special Chemicals, Taiyuan University of Technology, 030024 Shanxi, PR China
First published on 16th November 2018
Abstract
A series of Pd/CeO2-nanorods catalysts modified with alkaline-earth metals were prepared by the incipient impregnation method. Their catalytic properties in low-concentration methane oxidation were also investigated. The catalysts were characterized by X-ray diffraction, scanning electron microscopy, transmission electron microscopy and H2-temperature-programmed reduction techniques. The catalytic results show that the Ca element doped in Pd/CeO2, with optimum molar ratio of Pd to Ca of 2 and calcination temperature of 450 °C, improved the properties of the Pd-based catalyst remarkably, which is attributed to strong Pd–support interaction and high oxygen mobility. Therefore, calcium is more suitable as a promoter for enhancing the activities of the Pd/CeO2 catalyst in methane oxidation.
1. Introduction
Greenhouse effects have brought about serious environmental problems including erratic weather patterns and rising ocean temperatures.1 As we know, methane is one of the important greenhouse gases, whose global warming potential is about 20 times higher than that of carbon dioxide.2 China is a country with a large amount of production of coal and methane emission to the atmosphere in the world. Particularly, ventilation air methane (VAM) from coal mining makes a great contribution to methane emissions. However, it is still a challenge to utilize and reduce emission of the low-concentration methane effectively because of the extremely low methane concentration (0.1–1.0 vol%) and fast flow rate.3,4 At present, methane catalytic oxidation is considered as the most promising technology due to low reaction temperature, flameless combustion and low NOx and CO emissions.5 Therefore, it is also an effective technique for the utilization of VAM by developing high-activity catalysts.Pd-based catalysts have been confirmed as excellent catalysts for methane oxidation.6 Ceria (CeO2) is an efficient catalyst promoter,7 and also a support material because of its advantages. For example, CeO2 is beneficial to surface oxygen adsorption and improvement of catalyst activity due to existence of lattice oxygen and excellent ability to store and release oxygen.8 In addition to, it is also beneficial for noble metal dispersion and metal–support interface formation.9,10 Previously, we have investigated the catalytic property of Pd/CeO2-nanorods toward methane oxidation.5 However, the properties Pd/CeO2 catalyst still needs to be further improved. It is found that Ca doped in CeO2 increased the number of defects and oxygen vacancies of CeO2 fluorite structure resulting in improvement of the catalyst property.11 Therefore, it is necessary to explore the effect of alkaline-earth metal oxide on the catalytic property of Pd/CeO2-nanorods for low-concentration methane oxidation.
Herein, a series of metals (Mg, Ca, Sr and Ba)-modified Pd/CeO2-nanorods catalysts were prepared by wet incipient impregnation method. The Pd loadings, Ca contents as well as calcination temperature were also studied in detail. The catalytic properties based on XRD, TEM and H2-TPR analysis were investigated.
2. Experimental
2.1 Materials
Materials including cerium nitrate hexahydrate, magnesium nitrate, calcium nitrate, strontium nitrate and sodium hydroxide were obtained from Aladdin Industrial Corporation. Palladium dinitrate hydrate (39.5%) was from Beijing HWRK Chemical Company, Ltd. All the reagents were used without further purification. In the experiment, used gases have all high purity (99.999%).2.2 Preparation of catalysts
CeO2-nanorods (CeO2-ND) were synthesized according to the reported method.5 All catalysts were prepared by wet incipient impregnation method. Typical preparation procedures are as follows: Pd(NO3)2·6H2O and Mg(NO3)2·6H2O, Ca(NO3)2·6H2O, Sr(NO3)2·6H2O as well as Ba(NO3)2·6H2O were dissolved in distill water respectively, and then a certain amount of CeO2-nanorods were added to the above solutions. The Pd loading is 0.5 wt%. The molar ratio of Pd to M (Mg, Sr and Ba) is 2 and the ratio of Pd to Ca changed from 4 to 0.5. All samples were calcined at 450 °C. The obtained catalysts were denoted as PdM/CeO2-ND. To explore the effect of calcination temperature, PdCa/CeO2-ND with molar ratio of Pd to Ca being 2 was calcined at 350 °C, 550 °C and 650 °C, respectively. The Pd/CeO2-ND catalysts with different Pd contents (1.0 wt% and 1.5 wt%) were also prepared according to the above method.2.3 Characterization of samples
X-ray diffraction (XRD) patterns of catalysts were obtained on a Rigaku Mini Flex II bench top X-ray diffractometer using Cu-Kα radiation (γ = 0.15418 nm). Transmission electron microscopy was obtained on a JEM-2100F equipped with EDS (accelerating voltage of 200 kV). Morphologies of the samples were obtained by scanning electron microscopy (Hitachi SU8020). The H2-temperature programmed reduction (H2-TPR) was carried out on a Micromeritics AutoChemII 2920 instrument. Prior to H2-TPR measurement, 100 mg of catalyst was pretreated in Ar flow (30 mL min−1) at 200 °C for 1 h, then were cooled to 50 °C. The reduction process was conducted from 50 to 1000 °C in 10 vol% H2/Ar of 30 mL min−1. The EDX was performed on a Hitachi, SU8010 equipment. The X-ray photoelectron spectroscopy measurements were performed on an ESCALAB 250 spectrometer with a Al-Kα (1486.6 eV) as the X-ray excitation source.2.4 Catalyst evaluation
The PdM/CeO2-ND catalysts were evaluated in a fixed-bed micro-reactor (inner diameter of 6 mm) under atmospheric pressure. 150 mg of catalyst (20–40 mesh) was used. The mixtures of gases were composed of 1.0 vol% CH4 + 20 vol% O2 + 79 vol% N2, and the total flow was 40 mL min−1, thus giving a gas hourly space velocity (GHSV) of 16![[thin space (1/6-em)]](https://www.rsc.org/images/entities/char_2009.gif) 000 mL g−1 h−1. Before each test, the catalysts were activated in a N2 flow of 30 mL min−1 at 200 °C for 1 h and further reduced in a H2 flow of 30 mL min−1 at 450 °C for 2 h. Reactants and products were analyzed online by GC-6890A (ZHONGKEHUIFEN) gas chromatography equipped with a TDX-01 column and a thermal conductivity detector (TCD). Catalytic activities were evaluated by the temperatures (T10% and T90%) required for achieving methane conversions of 10% and 90%, respectively.
000 mL g−1 h−1. Before each test, the catalysts were activated in a N2 flow of 30 mL min−1 at 200 °C for 1 h and further reduced in a H2 flow of 30 mL min−1 at 450 °C for 2 h. Reactants and products were analyzed online by GC-6890A (ZHONGKEHUIFEN) gas chromatography equipped with a TDX-01 column and a thermal conductivity detector (TCD). Catalytic activities were evaluated by the temperatures (T10% and T90%) required for achieving methane conversions of 10% and 90%, respectively.
3. Results and discussion
3.1 TEM analysis of PdCa/CeO2-ND catalyst
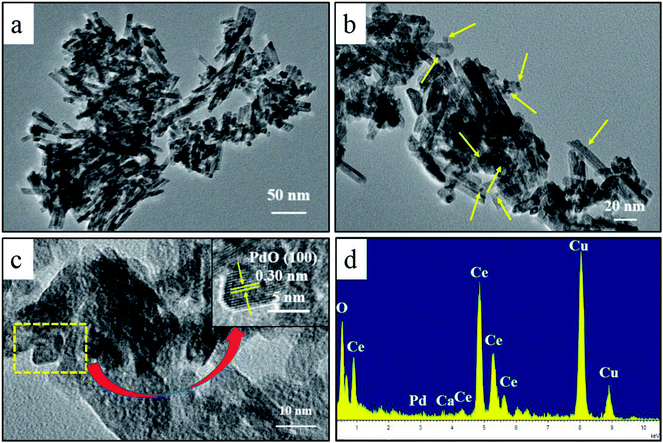
Fig. 1 displays the TEM images and EDX spectrum of the PdCa/CeO2-ND catalysts. The as-synthesized CeO2 consisted of nanorods (Fig. 1a). Magnified image shows that PdO nanoparticles were well dispersed on surface of CeO2 support (marked with yellow arrows, Fig. 1b). Further magnified (Fig. 1c), the lattice fringes of the PdO particles are observed clearly and the interplanar spacing is about 0.30 nm, corresponding to the (100) planes of PdO. From EDX spectrum (Fig. 1d), only Pd, O, Ce, Ca can be observed, suggesting that Ca was doped into Pd/CeO2-ND catalyst successfully. In addition, the Cu peaks are attributed to the Cu grids.3.2 Effects of Pd loadings
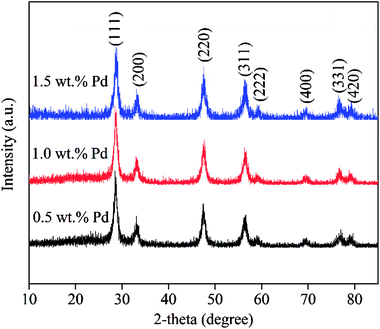
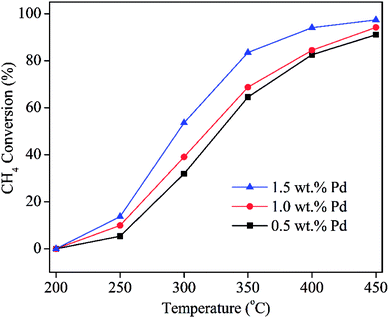
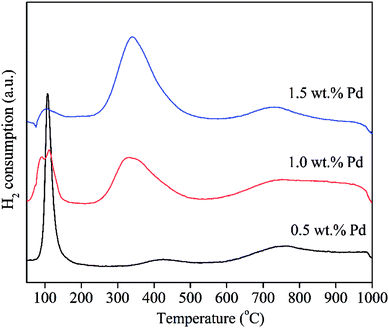
To explore the effects of Pd loading on the catalytic property of Pd/CeO2-ND, the catalysts with various loadings were prepared, and the XRD patterns are shown in Fig. 2. All peaks in the XRD patterns are attributed to the characteristic peaks of cubic fluorite-structured CeO2, corresponding to the diffraction of (111), (200), (220), (311), (222), (400), (331) and (420) planes at 28.6°, 33.1°, 47.6°, 56.4°, 59.0°, 69.4°, 76.8°, 79.1°, respectively.12 No obvious diffraction peaks of Pd or PdO phases were recorded due to their low loadings or good dispersion.13 Further, their catalytic properties were studied and the results are presented in Fig. 3. Obviously, Pd with high content exhibited high catalytic activity, and Pd catalyst with high loading gave rise to high methane conversion. The 1.5 wt% Pd/CeO2-ND catalyst showed the best performance (T10% = 235 °C and T90% = 381 °C), which is attributed to enhancement of oxygen mobility. The H2-TPR tests further explain the reasons.H2-TPR tests were performed to investigate the reducibility of the Pd/CeO2-ND catalysts and the profiles are illustrated in Fig. 4. The reduction peak at about 100 °C is attributed to reduction of PdO species. The second main peak is assigned to the reduction of surface oxygen of CeO2, whereas the third one, centered at 740 °C, is assigned to reduction of lattice oxygen of bulk CeO2.14 Reduction peak of surface oxygen of CeO2 was shifted to the lower temperature (Pd loading ranging from 0.5 wt% to 1.0 wt%) and the peak area gradually increases, which is beneficial to enhancement of the oxygen mobility, thereby, providing more active oxygen species for methane oxidation. Therefore, the methane conversions increase with increasing the Pd loadings.
For optimum of Pd loading, turnover frequency (TOF) was calculated based on the mole of CH4 molecules converting to CO2 per mole of Pd per second at certain temperature. The TOF results are shown in Fig. S1.† TOF values decreased with increasing Pd loading from 0.5 to 1.5 wt%. More importantly, the TOF values of 0.5 wt% Pd/CeO2-ND catalyst are about 1.1–2.8 times higher than that of Pd catalysts with other loadings at the same temperature, which confirms that the 0.5 wt% Pd/CeO2-ND catalyst exhibits the highest specific activity. Hence, the following works are focused on studying the properties of catalyst with 0.5 wt% Pd content.
3.3 Effects of alkaline-earth metals
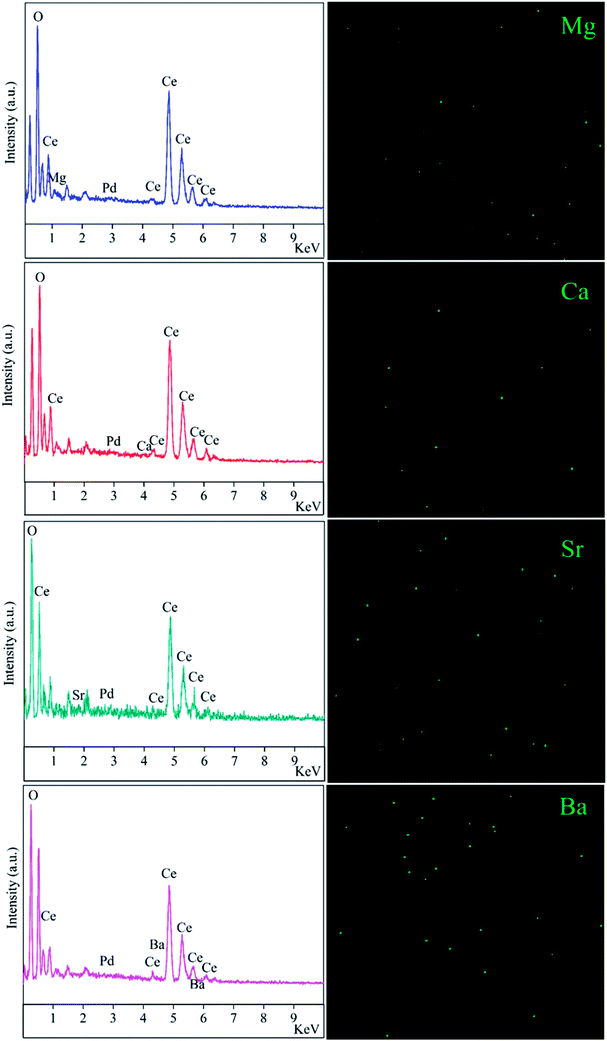
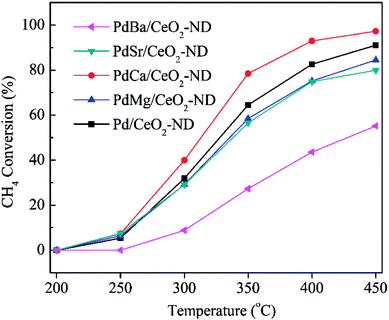
In order to further improve the catalyst activity, alkaline-earth metals promoters such as magnesium, calcium, strontium and barium with ratios of 2 are doped into the 0.5 wt% Pd/CeO2-ND catalyst. The EDX results are presented in Fig. 5. Alkaline-earth metals elements existed in the Pd/CeO2-ND material, which suggests composites of Pd/CeO2-ND with doped metals have been obtained by impregnation method. However, it can be found that the metal dopants were low, which can be further confirmed by XRD and XPS. From the XRD patterns (Fig. S2†), no diffraction peaks of alkaline-earth metals were detected in the samples, suggesting the low loading below the detection limit of this technique, and the alkaline-earth metals didn't change the crystal structure of CeO2. Moreover, the XPS results also confirm the low content due to absence of peaks from metal elements (Fig. S3†). Fig. 6 shows their catalytic performances in methane oxidation. Methane conversions over PdM/CeO2-ND catalysts decreased in the order of various promoters (PdCa, Pd, PdMg, PdSr and PdBa) in the range of reaction temperatures. For PdCa–CeO2-ND catalyst, T10%, T50% and T90% are 255 °C, 313 °C and 390 °C respectively, which are 5 °C, 15 °C and 54 °C lower than that for pure Pd/CeO2-ND (Table S1†). The T50% is lower than that (370 °C) over 0.67Pt–0.33Pd(1.1)/MnLaAl11O19 (10 vol% O2/5 vol% CH4, GHSV: 10![[thin space (1/6-em)]](https://www.rsc.org/images/entities/char_2009.gif) 000 h−1),15 far lower than that (nearly 400 °C) over 3% Pd/Co3O4 (1% CH4, GHSV: 12
000 h−1),15 far lower than that (nearly 400 °C) over 3% Pd/Co3O4 (1% CH4, GHSV: 12![[thin space (1/6-em)]](https://www.rsc.org/images/entities/char_2009.gif) 000 h−1).16 In addition, introduction of Ca obviously improved the reaction rate of Pd/CeO2-ND (Fig. S4†), which is 1.22 times higher than that of Pd/CeO2-ND catalyst at 340 °C (Table S1†). Therefore, adding Ca to the Pd/CeO2-ND catalyst can efficiently promote the catalyst activity. We calculated the reaction rate at 340 °C in order to compare the performance of catalysts with that of reported results (Table S1†). At 340 °C, the methane reaction rate over PdCa/CeO2-ND catalyst (257.53 μmol (gPds)−1) was far higher than that (51.0 μmol (gPds)−1) of 1.0 wt% Pd@ZrO2/Si–Al2O3,17 and much higher than that (136.1 μmol (gPds)−1) over 1.0 wt% Co–1.0 wt% Pd/Al2O3,18 and 114.9 μmol (gPds)−1 over Au–Pd–0.19Cr/3DOM Mn2O3,12 but slightly higher than that 245.0 μmol (gPds)−1 over 0.5 wt% Pd/ZrO2 (900).19 Obviously, as-obtained PdCa/CeO2-ND catalyst exhibits better catalytic property than those reported in the literatures.
000 h−1).16 In addition, introduction of Ca obviously improved the reaction rate of Pd/CeO2-ND (Fig. S4†), which is 1.22 times higher than that of Pd/CeO2-ND catalyst at 340 °C (Table S1†). Therefore, adding Ca to the Pd/CeO2-ND catalyst can efficiently promote the catalyst activity. We calculated the reaction rate at 340 °C in order to compare the performance of catalysts with that of reported results (Table S1†). At 340 °C, the methane reaction rate over PdCa/CeO2-ND catalyst (257.53 μmol (gPds)−1) was far higher than that (51.0 μmol (gPds)−1) of 1.0 wt% Pd@ZrO2/Si–Al2O3,17 and much higher than that (136.1 μmol (gPds)−1) over 1.0 wt% Co–1.0 wt% Pd/Al2O3,18 and 114.9 μmol (gPds)−1 over Au–Pd–0.19Cr/3DOM Mn2O3,12 but slightly higher than that 245.0 μmol (gPds)−1 over 0.5 wt% Pd/ZrO2 (900).19 Obviously, as-obtained PdCa/CeO2-ND catalyst exhibits better catalytic property than those reported in the literatures.
The excellent catalytic property is further analyzed by H2-TPR tests (Fig. S5†). It can be observed that introduction of alkaline-earth metals changed the interaction between Pd and support due to occurrence of different reduction peak at ca. 100 °C. Apparently, the doping of Ca enhanced the reduction temperature of PdO, which is beneficial for dispersion of PdO particles, thus, exposing more active sites and improving the catalytic property. However, the addition of Mg, Sr and Ba decreased the reduction temperature of partial PdO particles. In addition, γ, δ, ε and η peaks are attributed to the reduction of surface oxygen, surface Ce4+, subsurface oxygen and lattice oxygen from the bulk CeO2, respectively.20–23 Among them, PdCa/CeO2-ND catalyst showed the lowest reduction temperature of γ and η peaks, indicating that addition of Ca made it have the highest redox capability, thus increased the oxygen mobility of the catalyst. Additionally, defects and oxygen vacancies can be introduced to the CeO2 fluorite structure by doping of Ca,11 and the introduction of Ca can also increase the active sites of the oxygen.24 In conclusion, Ca-doped CeO2 provided more active oxygen species and more active sites for the methane oxidation and PdCa/CeO2-ND catalyst showed the best catalytic activity. Furthermore, the thermal stabilities of PdCa/CeO2-ND and Pd/CeO2-ND catalysts were explored in 450 °C for 120 min (Fig. S6†). The results show that the methane conversions decreased 20.79% and 36.50% for PdCa/CeO2-ND and Pd/CeO2-ND catalysts within 120 min, respectively. Notably, the methane conversions over PdCa/CeO2-ND and Pd/CeO2-ND catalysts displayed similar decrease in methane conversions, and the former decreased slightly slower than the latter did in 40 min. More importantly, the methane conversion over PdCa/CeO2-ND catalyst remained comparable stability compared to that over Pd/CeO2-ND from 40 to 120 min, which demonstrates that the addition of Ca improves the thermal stability of Pd/CeO2-ND.
3.4 Catalyst optimum
Introducing metal calcium into the catalyst improves the property of Pd/CeO2-ND catalyst. Hence, we optimized the amount of doped calcium, and catalytic properties of 0.5 wt% PdCa/CeO2-ND (n(Pd)![[thin space (1/6-em)]](https://www.rsc.org/images/entities/char_2009.gif) :
:![[thin space (1/6-em)]](https://www.rsc.org/images/entities/char_2009.gif) n(Ca) = 4
n(Ca) = 4![[thin space (1/6-em)]](https://www.rsc.org/images/entities/char_2009.gif) :
:![[thin space (1/6-em)]](https://www.rsc.org/images/entities/char_2009.gif) 1, 2
1, 2![[thin space (1/6-em)]](https://www.rsc.org/images/entities/char_2009.gif) :
:![[thin space (1/6-em)]](https://www.rsc.org/images/entities/char_2009.gif) 1, 1
1, 1![[thin space (1/6-em)]](https://www.rsc.org/images/entities/char_2009.gif) :
:![[thin space (1/6-em)]](https://www.rsc.org/images/entities/char_2009.gif) 1 and 1
1 and 1![[thin space (1/6-em)]](https://www.rsc.org/images/entities/char_2009.gif) :
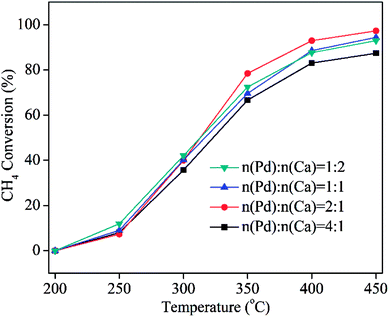
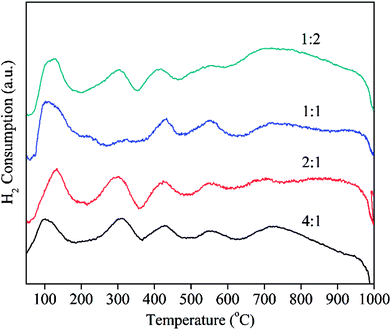
:![[thin space (1/6-em)]](https://www.rsc.org/images/entities/char_2009.gif) 2) were also performed. From XRD results (Fig. S7†), no diffraction peaks of Ca were found. The possible reason is due to their low content or high dispersion. The activities of PdCa/CeO2-ND catalysts with various molar ratios of Pd/Ca are shown in Fig. 7. Obviously, molar ratio of Pd to Ca has an obvious effect on the catalytic property of PdCa/CeO2-ND. Among them, PdCa/CeO2-ND catalyst with Pd and Ca ratio of 2 exhibited the lowest full conversion temperature (T90%), which is attributed to the strong Pd–support interaction and more active oxygen species. This is further analyzed by H2-TPR tests. From Fig. 8, PdO exhibited the highest reduction temperature when n(Pd)
2) were also performed. From XRD results (Fig. S7†), no diffraction peaks of Ca were found. The possible reason is due to their low content or high dispersion. The activities of PdCa/CeO2-ND catalysts with various molar ratios of Pd/Ca are shown in Fig. 7. Obviously, molar ratio of Pd to Ca has an obvious effect on the catalytic property of PdCa/CeO2-ND. Among them, PdCa/CeO2-ND catalyst with Pd and Ca ratio of 2 exhibited the lowest full conversion temperature (T90%), which is attributed to the strong Pd–support interaction and more active oxygen species. This is further analyzed by H2-TPR tests. From Fig. 8, PdO exhibited the highest reduction temperature when n(Pd)![[thin space (1/6-em)]](https://www.rsc.org/images/entities/char_2009.gif) :
:![[thin space (1/6-em)]](https://www.rsc.org/images/entities/char_2009.gif) n(Ca) is 2
n(Ca) is 2![[thin space (1/6-em)]](https://www.rsc.org/images/entities/char_2009.gif) :
:![[thin space (1/6-em)]](https://www.rsc.org/images/entities/char_2009.gif) 1, suggesting that Pd–CeO2 has stronger interaction resulting in high dispersion of Pd phase. In addition, reduction peak of surface oxygen of CeO2 (the second peak) showed low temperature and large peak area, indicating that the catalyst has higher oxygen mobility and more active oxygen species as a consequence. Therefore, PdCa/CeO2-ND with Pd and Ca ratio of 2 exhibited higher catalytic performance.
1, suggesting that Pd–CeO2 has stronger interaction resulting in high dispersion of Pd phase. In addition, reduction peak of surface oxygen of CeO2 (the second peak) showed low temperature and large peak area, indicating that the catalyst has higher oxygen mobility and more active oxygen species as a consequence. Therefore, PdCa/CeO2-ND with Pd and Ca ratio of 2 exhibited higher catalytic performance.
3.5 Effects of calcination temperature
The calcination temperature of catalyst is also an important technological parameter for exploring catalyst property. Hence, we studied the effects of calcination temperature on the property of the PdCa/CeO2-ND with Pd and Ca ratio of 2. From XRD patterns (Fig. S8†), peak intensities increased with increasing calcination temperature, which indicates that the size of CeO2 particles gradually increase. In addition, the peak positions of CeO2 did not change, suggesting the calcination temperatures have no obvious influence on the crystal structure of the CeO2. But diffraction peaks of Ca and Pd or PdO aren't still observed, suggesting that high temperature doesn't reunite the active species or less agglomeration below the detection limit of this XRD equipment.20 The activities of PdCa/CeO2-ND (n(Pd)![[thin space (1/6-em)]](https://www.rsc.org/images/entities/char_2009.gif) :
:![[thin space (1/6-em)]](https://www.rsc.org/images/entities/char_2009.gif) n(Ca) = 2
n(Ca) = 2![[thin space (1/6-em)]](https://www.rsc.org/images/entities/char_2009.gif) :
:![[thin space (1/6-em)]](https://www.rsc.org/images/entities/char_2009.gif) 1) heated at different calcination temperature are shown in Fig. 9. For the comparison of T90%, the catalytic activity decreased in the following order: PdCa/CeO2-ND (450 °C) > PdCa/CeO2-ND (550 °C) > PdCa/CeO2-ND (350 °C) > PdCa/CeO2-ND (650 °C). Namely, the catalyst shows higher catalytic property when the calcination temperature is 450 °C. This can be explained by H2-TPR tests (Fig. S9†). Clearly, reduction temperature of PdO displayed an increase trend when calcination temperature increased from 350 °C to 550 °C, and remained unchanged in the range of 550–650 °C, suggesting the interaction between Pd and support increased gradually. Moreover, stronger interaction suppresses PdO reduction, thus decreasing active sites, resulting in low catalytic activity. In addition, a negative peak occurs at 550 °C and 650 °C of calcination temperature, indicating that larger particles of PdO phase existed due to the high temperature.25 Moreover, when calcination temperature is 450 °C, the catalyst shows lower reduction temperature of surface oxygen of CeO2, providing more active oxygen for methane oxidation. Therefore, the catalyst with calcination temperature of 450 °C showed the better catalytic property.
1) heated at different calcination temperature are shown in Fig. 9. For the comparison of T90%, the catalytic activity decreased in the following order: PdCa/CeO2-ND (450 °C) > PdCa/CeO2-ND (550 °C) > PdCa/CeO2-ND (350 °C) > PdCa/CeO2-ND (650 °C). Namely, the catalyst shows higher catalytic property when the calcination temperature is 450 °C. This can be explained by H2-TPR tests (Fig. S9†). Clearly, reduction temperature of PdO displayed an increase trend when calcination temperature increased from 350 °C to 550 °C, and remained unchanged in the range of 550–650 °C, suggesting the interaction between Pd and support increased gradually. Moreover, stronger interaction suppresses PdO reduction, thus decreasing active sites, resulting in low catalytic activity. In addition, a negative peak occurs at 550 °C and 650 °C of calcination temperature, indicating that larger particles of PdO phase existed due to the high temperature.25 Moreover, when calcination temperature is 450 °C, the catalyst shows lower reduction temperature of surface oxygen of CeO2, providing more active oxygen for methane oxidation. Therefore, the catalyst with calcination temperature of 450 °C showed the better catalytic property.
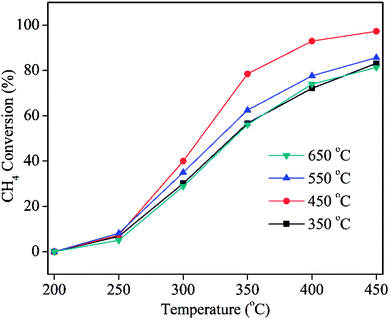 | ||
Fig. 9 Methane conversion over the PdCa/CeO2-ND catalysts (n(Pd)![[thin space (1/6-em)]](https://www.rsc.org/images/entities/char_2009.gif) : :![[thin space (1/6-em)]](https://www.rsc.org/images/entities/char_2009.gif) n(Ca) = 2 n(Ca) = 2![[thin space (1/6-em)]](https://www.rsc.org/images/entities/char_2009.gif) : :![[thin space (1/6-em)]](https://www.rsc.org/images/entities/char_2009.gif) 1) with different calcination temperature. 1) with different calcination temperature. | ||
4. Conclusion
A series of alkaline-earth metal-doped Pd/CeO2-ND catalysts were prepared by wet incipient impregnation method, and the catalytic properties of PdM/CeO2-ND were also investigated using low-concentration methane oxidation as probe reaction. The results show that introduction of Ca improves the catalytic property of Pd/CeO2-ND catalyst effectively, and the optimum molar ratio of Pd to Ca is 2 and calcination temperature is 450 °C. The effects of Ca addition lead to high oxygen mobility and strong Pd–support interaction, which suggests that PdCa/CeO2-ND catalyst has a promising application in oxidation of low-concentration methane.Conflicts of interest
There are no conflicts to declare.Acknowledgements
The authors thank partial financial support by National Natural Science Foundation of China – China (21136007 and 51572185), Natural Science Foundation of Shanxi Province – China (2014011016-4) and Coal-Based Scientific and Technological Key Project of Shanxi Province (MQ2014-10).References
- H. R. M. Jhong, C. E. Tornow, B. Smid, A. A. Gewirth, S. M. Lyth and P. J. A. Kenis, ChemSusChem, 2017, 10, 1094–1099 CrossRef CAS PubMed.
- Z. Zhao, L. Wang, J. Ma, Y. Feng, X. Cao, W. Zhan, Y. Guo, Y. Guo and G. Lu, RSC Adv., 2017, 7, 15211–15221 RSC.
- Z. Li, Z. Wu, Z. Qin, H. Zhu, J. Wu, R. Wang, L. Lei, J. Chen, M. Dong, W. Fan and J. Wang, Fuel Process. Technol., 2017, 160, 102–108 CrossRef CAS.
- J. S. Bae, S. Su and X. Yu, Environ. Sci. Technol., 2014, 48, 6043–6049 CrossRef CAS PubMed.
- T. Guo, J. Du and J. Li, J. Mater. Sci., 2016, 51, 10917–10925 CrossRef CAS.
- M. Monai, T. Montini, M. Melchionna, T. Duchoň, P. Kúš, C. Chen, N. Tsud, L. Nasi, K. C. Prince, K. Veltruská, V. Matolín, M. M. Khader, R. J. Gorte and P. Fornasiero, Appl. Catal., B, 2017, 202, 72–83 CrossRef CAS.
- J. Hu, C. Yu, Y. Bi, L. Wei, J. Chen and X. Chen, Chin. J. Catal., 2014, 35, 8–20 CrossRef CAS.
- C. Yu, J. Hu, W. Zhou and Q. Fan, J. Energy Chem., 2014, 23, 235–243 CrossRef CAS.
- S. Xie, Y. Liu, J. Deng, X. Zhao, J. Yang, K. Zhang, Z. Han and H. Dai, J. Catal., 2016, 342, 17–26 CrossRef CAS.
- T. Guo, J. Du, J. Wu, S. Wang and J. Li, Chem. Eng. J., 2016, 306, 745–753 CrossRef CAS.
- D. Qiao, G. Lu, D. Mao, Y. Guo and Y. Guo, J. Mater. Sci., 2011, 46, 641–647 CrossRef CAS.
- Y. Li, Z. Wei, F. Gao, L. Kovarik, R. A. L. Baylon, C. H. F. Peden and Y. Wang, ACS Catal., 2015, 5, 3006–3012 CrossRef CAS.
- S. Xie, Y. Liu, J. Deng, X. Zhao, J. Yang, K. Zhang, Z. Han, H. Arandiyan and H. Dai, Appl. Catal., B, 2017, 206, 221–232 CrossRef CAS.
- M. Hoffmann, S. Kreft, G. Georgi, G. Fulda, M.-M. Pohl, D. Seeburg, C. Berger-Karin, E. V. Kondratenko and S. Wohlrab, Appl. Catal., B, 2015, 179, 313–320 CrossRef CAS.
- S. A. Yashnik, Yu. A. Chesalov, A. V. Ishchenko, V. V. Kaichev and Z. R. Ismagilov, Appl. Catal., B, 2017, 204, 89–106 CrossRef CAS.
- G. Ercolino, P. Stelmachowski, G. Grzybek, A. Kotarba and S. Specchia, Appl. Catal., B, 2017, 206, 712–725 CrossRef CAS.
- C. Chen, Y.-H. Yeh, M. Cargnello, C. B. Murray, P. Fornasiero and R. J. Gorte, ACS Catal., 2014, 4, 3902–3909 CrossRef CAS.
- A. Satsuma, T. Tojo, K. Okuda, Y. Yamamoto, S. Arai and J. Oyama, Catal. Today, 2015, 242, 308–314 CrossRef CAS.
- J.-H. Park, J. H. Cho, Y. J. Kim, E. S. Kim, H. S. Han and C.-H. Shin, Appl. Catal., B, 2014, 160–161, 135–143 CrossRef CAS.
- B. Zhao, Q. Wang and G. L. R. Zhou, J. Environ. Chem. Eng., 2013, 1, 534–543 CrossRef CAS.
- Tana, M. Zhang, J. Li, H. Li, Y. Li and W. Shen, Catal. Today, 2009, 148, 179–183 CrossRef CAS.
- F. Fally, V. Perrichon, H. Vidal, J. Kaspar, G. Blanco, J. M. Pintado, S. Bernal, G. Colon, M. Daturi and J. C. Lavalley, Catal. Today, 2000, 59, 373–386 CrossRef CAS.
- J.-R. Kim, W.-J. Myeong and S.-K. Ihm, Appl. Catal., B, 2007, 71, 57–63 CrossRef CAS.
- B. Litawa, P. Michorczyk and J. Ogonowski, Pol. J. Chem. Technol., 2013, 15, 22–26 CAS.
- Y. Cao, R. Ran, X. Wu, B. Zhao, J. Wan and D. Weng, Appl. Catal., A, 2013, 457, 52–61 CrossRef CAS.
Footnotes |
| † Electronic supplementary information (ESI) available. See DOI: 10.1039/c8ra07797e |
| ‡ T. Guo and X. Nie contributed equally to the work. |
| This journal is © The Royal Society of Chemistry 2018 |

