 Open Access Article
NOx reduction by CO over ASC catalysts in a simulated rotary reactor: effect of CO2, H2O and SO2†
Peiliang Sun ab,
Xingxing Cheng
 *ab,
Yanhua Lai*b,
Zhiqiang Wangab,
Chunyuan Maab and
Jingcai Changab
aNational Engineering Lab for Coal-fired Pollutant Emission Reduction, School of Energy and Power Engineering, Shandong University, Jinan, 250061, China. E-mail: xcheng@sdu.edu.cn; Fax: +86 531-88385877; Tel: +86 531-88399372(615)
bSchool of Energy and Power Engineering, Shandong University, Jinan, 250061, China. E-mail: laiyh@sdu.edu.cn; Tel: +86 531-88392637
First published on 30th October 2018
Abstract
The influence of CO2, H2O and SO2 on the NO reduction by CO over Fe/Co activated semi-coke catalyst was investigated in a simulated rotary reactor. The results showed that, in the simulated rotary reactor, the influence of CO2 and H2O on the NO adsorption was significant at low temperatures, and the inhibition became weak when increasing the temperature. However, the NO adsorption efficiency could not be improved by increasing temperature after catalyst sulfur poisoning. The heavily inhibited NO adsorption process, which was due to the competitive adsorption and formation of the sulfate, resulted in a low NO reduction efficiency in the presence of CO2, H2O or SO2. The in situ DRIFT study showed that the dominant effect of CO2, H2O and SO2 on the NO adsorption was the inhibition of the free nitrate ions formation. In addition, the introduction of CO2, H2O and SO2 could not change the route of NO reduction, but just reduced the degree of the NO + CO reduction.
1. Introduction
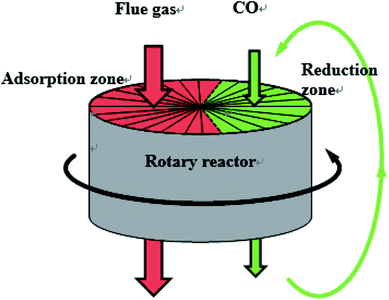
NOx is one of the polluting gases emitted from industrial production, especially from power plants, which is responsible for the formation of acid rain, photochemical smog, ozone depletion and greenhouse effects. With the increasingly stringent NOx emission policy, new deNOx technology with lower cost and higher efficiency has attracted more and more attention. NO reduction by CO is one of the main technologies of deNOx, which comes from three-way catalysis. Compared with NH3-SCR, CO deNOx technology is much cheaper and environmentally friendly, so it has attracted wide attention as a potential deNOx technology. Numerous studies have been conducted in recent years, and Fe/Co-impregnated catalyst showed a high efficiency of NOx reduction by CO above 200 °C.1–4 And in our laboratory,5 the Fe/Co co-impregnated activated semi-coke catalyst also exhibited high NOx removal efficiency (>99%) and NOx reduction efficiency (>90%) in a rotary reactor at 250 °C when CO was fed in excess. The schematic of the rotary reactor is shown in Fig. 1.However, the composition of real flue gas is complex, including CO2, H2O, SO2 and other gases, which will inhibit the NOx removal process over the catalyst. Previous studies on the effects of CO2 on NO removal were mostly focused on the NO adsorption process. The research of Nova6 found that CO2 could inhibit the NOx storage on the Pt–Ba/Al2O3 catalyst, particularly at low temperatures. Similarly, the studies of Yang7 and Kim8 showed that, CO2 exhibited a negative impact on the adsorption of NO, which might be caused by the competitive adsorption between CO2 and NO. And according to Cinke's study,9 the adsorption of CO2 on carbon-based adsorbents was found to be mainly a physisorption process below 200 °C with decreasing adsorptive capacities as the temperature was increased.
According to previous studies,7,10–12 water has a significant effect on the deNOx process of SCR technology. The competitive adsorption of H2O and NO was one of the main factors on NOx removal process.11,13 Moreover, H2O could react with the surface species of the catalyst to destroy the surface structure,14 especially for the carbon-based catalyst, HNO3 formed by the interaction of H2O and NO could consume the carbon support heavily. Besides, H2O will also affect the reduction process on the catalyst surface.14 And in previous study,15,16 the introduction of H2O could significantly inhibit the adsorption of NO on the catalyst surface and further affect the NOx removal efficiency of the catalyst. However, the effect of H2O was considered to be reversible.17 Previous studies of our group14,18 also found that H2O had obvious inhibitory effect on CO deNOx process over activated semi coke catalysts, but the mechanism was rarely reported.
Numerous studies found that the inhibition effect of SO2 was more obvious than that of H2O,17,19,20 and the effect of SO2 on the catalyst was irreversible.17 The competitive adsorption between SO2 and NO on the active sites existed, resulting in a serious inhibition on the NO removal.21,22 On the other hand, SO2 could be catalytically oxidized to SO3 over a metal phase, such as Cu or Co phase, in the presence of oxygen, and then reacted with active sites to produce sulfate attached to the catalyst surface.23–26 In addition, sulfuric acid could be produced by the SO2 + O2 + H2O reaction, which could consume active metal on the catalyst surface.
Therefore, in this study, the influence of CO2, H2O and SO2 on the NO reduction by CO over lab-synthesized Fe/Co activated semi-coke catalyst in the simulated rotary reactor was investigated. And the mechanism of the influence was also explored based on the in situ DRIFT study.
2. Experimental
2.1 Catalyst preparation
The catalyst support used in this experiment was the commercial semi-coke (Shaanxi Shenmu Coal Mine Co., Ltd., China). The semi-coke was crushed into uniform-sized particles which diameter was 1.02–1.27 mm. Second, the semi coke was activated by HNO3 (30 wt%) at 80 °C for 2 h, then washed with deionized water in order to adjust the pH to neutral, dried at 90 °C overnight and calcined at 700 °C for 4 h in nitrogen. The solid particles obtained through the above process were named as activated semi-coke (ASC).The metals were loaded onto ASC by the hydrothermal method.18 Fe(NO)3·9H2O and Co(NO3)2·6H2O was dissolved into 30 mL deionized water following a mole ratio of 4![[thin space (1/6-em)]](https://www.rsc.org/images/entities/char_2009.gif) :
:![[thin space (1/6-em)]](https://www.rsc.org/images/entities/char_2009.gif) 1. The solution then immersed 5 g ASC and enclosed in an autoclave, heated at 160 °C for 24 h in a heating furnace. The solid particles were filtered from the solution, dried at 90 °C for 12 h and calcined at 700 °C for 4 h in a nitrogen atmosphere.
1. The solution then immersed 5 g ASC and enclosed in an autoclave, heated at 160 °C for 24 h in a heating furnace. The solid particles were filtered from the solution, dried at 90 °C for 12 h and calcined at 700 °C for 4 h in a nitrogen atmosphere.
2.2 Experimental equipment and methods
The activity of the prepared catalysts was investigated in a fixed bed reactor system, which schematic was shown in Fig. S1 in ESI.† The tubular reactor in the experiment was a stainless steel tube with an inner diameter of 0.5 inches, which temperature was controlled by a heating furnace. A single nitrogen gas path was used to carry water vapor into the reactor through a gas-washing bottle which was heated by a thermostatic water bath. The mixed gas out of the gas-washing bottle was heated at 100 °C to guaranteed that the vapor was unsaturated. The flow of gas was controlled by mass flow meters, and the gas into the reactor was controlled by electromagnetic valves and three-way valves.The simulated flue gas used in the experiment was prepared from several gas cylinders: 21% O2 balanced with N2, 2% NO balanced with N2, 5000 ppm SO2 balanced with N2, pure CO2 and pure N2 gas cylinders. The reducing agent used in the experiment was carbon monoxide, prepared from 1% CO balanced with N2 and pure N2 cylinders. The compositions (NOx, O2, CO, CO2, and SO2) of the reactor outlet gases were analyzed by a HORIBA PG-350 gas analyzer. In addition, during the NO adsorption process, various kind of nitric oxides could be produced in the reactor, e.g. NO2, N2O, N2O4. However, according to our previous study, NO2 and NO were the two main nitric oxides in experiments. Therefore, NOx, which concentration could be collected in real time by HORIBA gas analyzer, was used to represent NO + NO2 in this study.
The fresh catalyst was loaded into the reactor for adsorption experiments. At the beginning of the adsorption experiments, the catalyst was heated to the target temperature in the nitrogen atmosphere, and then the atmosphere was switched to the simulated flue gas. Meanwhile, the outlet concentration of gases were collected by the gas analyzer until the adsorption of the catalyst was saturated. Similarly, when the reduction efficiency of the catalyst was tested, the tests of each reaction conditions were completed in greater than 40 min until the outlet gas concentrations were stable. In addition, the NOx reduction effiency represents the degree of conversion of NOx to N2.
The adsorption capacity of NO is defined as eqn (1).
 | (1) |
 | (2) |
3. Results and discussion
3.1 NOx adsorption performance on FeCo/ASC catalyst
The adsorption performance of activated semi coke catalyst in the presence of H2O, SO2 and CO2 was investigated in the temperature range from 100 °C to 250 °C. The experimental conditions were as follows: GHSV was 12![[thin space (1/6-em)]](https://www.rsc.org/images/entities/char_2009.gif) 000 h−1, the compositions of the simulated flue gas were 800 ppm NO and 5% O2 balanced by N2, the SO2 concentration was set as 100 ppm, H2O content was 5% and 10%, and the CO2 concentration was 15%. In addition, all the adsorption curve reported have been collected on a fresh sample.
000 h−1, the compositions of the simulated flue gas were 800 ppm NO and 5% O2 balanced by N2, the SO2 concentration was set as 100 ppm, H2O content was 5% and 10%, and the CO2 concentration was 15%. In addition, all the adsorption curve reported have been collected on a fresh sample.
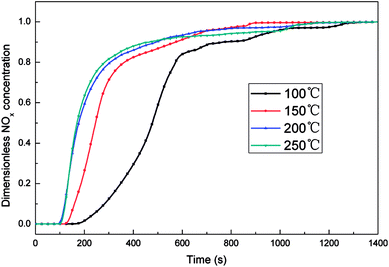
The NOx adsorption capacity of the catalyst at different temperatures was shown in Fig. 2. The composition of gases at all temperatures was 5% O2 and 800 ppm NO balanced by N2. Obviously, the adsorption breakthrough time of NOx was longer when the temperature was 100 °C. The NOx adsorption capacity of the catalyst at 100 °C could reach 1.56 mg g−1 (shown in Fig. S2†), which was significantly higher than that of other temperatures. When the adsorption temperature was above 150 °C, the NOx adsorption capacity of the catalyst decreased to below 0.9 mg g−1. There was a significant decrease of the adsorption capacity between 100 and 150 °C, which might caused by the obvious desorption of the physisorbed NOx when the temperature was increased above 100 °C.
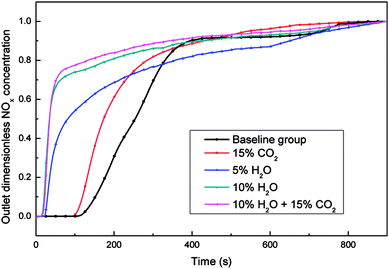
The NOx adsorption curves under different reaction conditions were summarized in Fig. 3, and the adsorption temperature was set as 200 °C. The gas composition of baseline group was 5% O2 and 800 ppm NO balanced by N2. After adding 15% CO2 to the flue gas, the NOx adsorption capacity of the catalyst had a slight decrease, which was reduced from 0.660 mg g−1 to 0.580 mg g−1 (shown in Table S1†). It was supposed that a competitive adsorption between CO2 and NO exist, and CO2 occupied the adsorption sites of NO, which could inhibited the adsorption of NO. When H2O was added into the simulated flue gas, the adsorption performance of the catalyst decreased obviously, and the higher the content of H2O, the smaller the adsorption capacity of the catalyst. There were a large number of hydrophilic oxygen containing functional groups on the surface of the ASC catalyst. Besides, the relative concentration of water molecules, which have strong polarity, was much higher than NO, so the H2O was more easily to be adsorbed onto the catalyst surface. Therefore, the NO adsorption ability of the catalyst was greatly weakened, even the weakly adsorbed NO, which had been adsorbed onto the surface of the ASC catalyst, would be replaced by water molecules, resulting in a decrease in the adsorption of NO on the surface of the catalyst. However, when the flue gas contained 10% H2O and 15% CO2, the adsorption capacity of the catalyst was further decreased, which was dropped to 0.290 mg g−1. However, there was likely no obvious interaction between H2O and CO2 on the catalyst surface which could cause the drastic inhibition on NOx adsorption process.
3.2 NOx reduction performance on FeCo/ASC catalyst
The effects of H2O, CO2 and SO2 on the NOx reduction over ASC catalyst were investigated, as shown in Fig. 4. The reaction conditions were as follows: GHSV was 12![[thin space (1/6-em)]](https://www.rsc.org/images/entities/char_2009.gif) 000 h−1, the gas components were 800 ppm NO, 1600 ppm CO and N2 as the balance gas. And the concentrations of the SO2, H2O and CO2 added in the simulated flue gas were 100 ppm, 5–10% and 15%, respectively.
000 h−1, the gas components were 800 ppm NO, 1600 ppm CO and N2 as the balance gas. And the concentrations of the SO2, H2O and CO2 added in the simulated flue gas were 100 ppm, 5–10% and 15%, respectively.
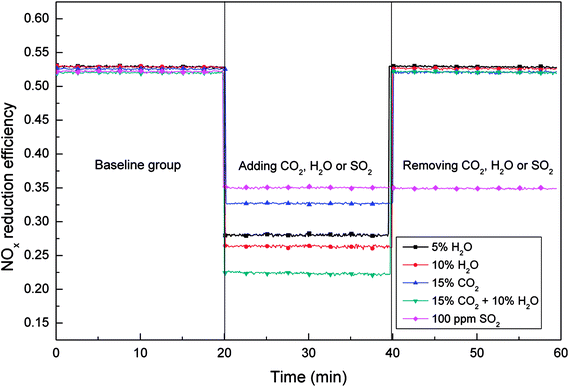
Fig. 4 was divided into three stages from left to right. The first stage was the NOx reduction efficiency test of the fresh ASC catalyst at 200 °C. At the second stage, H2O, CO2 or SO2 were added into the simulated flue gas, and the data of NOx concentration was collected after 40 min. And at the last stage, these three components were removed from the simulated flue gas, and the reduction efficiency of the catalyst was tested again. As shown in Fig. 4, the efficiencies of NOx reduction under different H2O and CO2 conditions were as follows: 15% CO2 > 5% H2O > 10% H2O > 10% H2O + 15% CO2. In addition, for these four experimental group, the NOx reduction efficiency of the catalyst could be restored to the original level after removing H2O and CO2 from the simulated flue gas. However, for the experimental group with 100 ppm SO2, when removing SO2 from the flue gas, the NOx reduction efficiency was still in a low level, indicating that the influence of H2O and CO2 on the ASC catalyst was reversible, while the influence of SO2 on the catalyst was irreversible.
When the water vapor existed in the simulated flue gas, the NOx reduction efficiency decreased obviously, and the catalytic activity of catalyst decreased, indicating that the existence of water vapor could inhibited the adsorption and reduction process of NO over the catalyst. It was supposed that the NO and O2 adsorbed on the catalyst could be replaced by water molecules, besides, the free water molecules could also be adsorbed onto the adsorption sites. Moreover, the NO and O2 adsorption process on the ASC catalyst surface follows the Langmuir–Hinshelwood reaction mechanism, so the decrease of the adsorption sites for NO and O2 adsorption could lead to the decrease of the NOx reduction efficiency. In addition, H2O could also react with NO2 generated by catalytic oxidation on the catalyst surface to produce HNO3, which inhibited the adsorption and oxidation of NO. On the other hand, when the water vapor in the flue gas was removed, the NOx reduction efficiency of the catalyst raised again, indicating that the influence of H2O on the deNOx process over ASC catalyst was reversible and temporary, and the structure of the catalyst was not changed.
As shown in Fig. 4 (stage 2), when 100 ppm SO2 existed in the simulated flue gas, the NOx reduction efficiency of the catalyst also decreased from 53% to 36%, indicating that SO2 had an inhibitory effect on the reduction of NO. As a polar molecule, sulfur dioxide could compete for the adsorption sites with NO, meanwhile, the oxygen groups produced by adsorption process were beneficial to the adsorption of sulfur dioxide. On the other hand, the sulfates produced by the reaction of sulfur dioxide to active metals was attached to the surface of the catalyst and difficult to decompose, which could also inhibit the adsorption of NO. Sulphuric acid was formed and when SO2, H2O and O2 existed simultaneously in the flue gas, which could consumed the activated semi coke catalyst. According to the stage 3 in Fig. 4, when removed SO2 from the flue gas, the NOx reduction efficiency of the catalyst did not recover to the level before adding sulfur dioxide, which indicated that the influence of SO2 on the activated semi-coke catalyst was irreversible under this reaction condition.
When 15% CO2 existed in the flue gas, the NOx reduction efficiency of the catalyst was decreased from 53% to 33%. Then remove CO2 from the flue gas, the NOx reduction efficiency could recover to 53%, indicating that CO2 also had a inhibitory effect on NOx reduction and the inhibition was reversible. According to the equation of CO + NO reaction, carbon dioxide can be produced by the oxidation of carbon monoxide. Therefore, when a large amount of CO2 was introduced into the flue gas, the CO + NO reaction equilibrium moved to the reverse direction, which could reduced the NOx reduction efficiency.
3.3 Catalyst performance during dynamic NOx adsorption–reduction
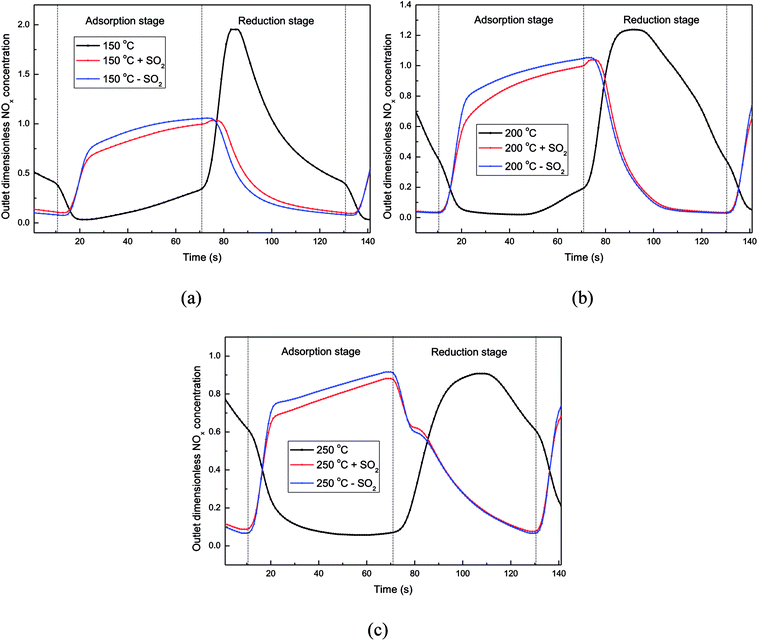
In this experiment, the working condition of the catalyst in a rotary reactor was simulated in the fixed bed. The adsorption stage and reduction stage were switched continuously every 60 second. It is worth emphasizing that, the flue gas and the reducing gas passes through the reactor at adsorption stage and reduction stage, respectively. At the beginning of the experiment, the catalyst was fresh so the adsorption capacity of catalyst was still large, and NO could be adsorbed on the catalyst surface easily at the adsorption stage. Then in the next 60 s reduction stage, NOx on the catalyst couldn't desorbed completely. Therefore, more and more NOx accumulated gradually on the catalyst with time. With the accumulation of NOx on the catalyst, the NOx adsorption process of the catalyst will gradually weaken and eventually will be balanced with the NOx desorption process. All the data of the dynamic experiment were collected after this balance. In addition, oxygen concentration is the basis for distinguishing between the adsorption stage and the reduction stage.5The outlet gas concentration profiles at 150 °C were shown in Fig. 5. From the CO curve in Fig. 5(a), it can be seen that the reaction of CO + NO has begun at 150 °C, and some CO2 was produced simultaneously. At the beginning of the reduction stage, an obvious peak of NO concentration appeared, indicating that the NO adsorbed on the catalyst surface was heavily desorbed by the reducing gas at this moment. And then the outlet NO concentration was decreased to approximately 400 ppm at the end of the reduction stage, indicating that the regeneration of the catalyst at this stage was not completely. At the adsorption stage, most of the NO was still adsorbed onto the catalyst surface, which leaded to the low concentration of the NO in the outlet of the reactor. It's explained that, at 150 °C, the incomplete regeneration of the catalyst at the reduction stage would not obviously affect the NO adsorption by the catalyst without CO2.
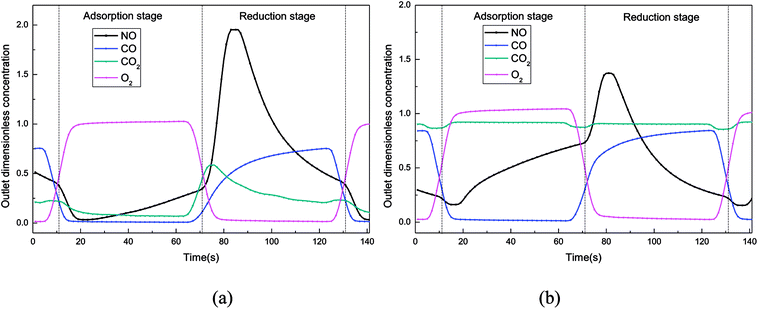 | ||
| Fig. 5 Dimensionless outlet concentration in the simulated rotary reactor at 150 °C. ((a) CO2 = 0%, (b) CO2 = 15%). | ||
While adding CO2 to simulated atmosphere (Fig. 5(b)), the CO consumption decreased a lot at the reduction stage, indicating that the reaction CO + NO was inhibited by the high concentration of CO2 in this dynamic deNOx process. And at the adsorption stage, the NO concentration in the reactor outlet increased significantly, leading to a low NO adsorption efficiency, which was might caused by the heavy competitive adsorption between CO2 and NO. Moreover, the decreased amount of the NOx adsorbed on the catalyst surface leaded to a lower outlet NOx concentration profiles at the reduction stage.
The effects of CO2 on the dynamic adsorption–reduction process of the catalyst at 200 °C and 250 °C were shown in Fig. S3.† When CO2 was added into the gas atmosphere, different from the case of low temperature, the profiles of NOx concentrations at the adsorption stage did not change obviously. Moreover, by calculating the adsorption efficiency of NO (in Table S2†), it was found that the adsorption efficiency decreased only by less than 5% after the addition of 15% CO2. Therefore, when the temperature was above 200 °C, the addition of CO2 in the dynamic deNOx process would not affect the adsorption of NOx obviously, and the higher the temperature, the smaller the effect of CO2 on the adsorption of NOx.
At the reduction stage, the NOx concentration profiles became higher significantly after adding 15% CO2 into the reactor, showing that more adsorbed NOx on the catalyst surface was removed in the way of direct desorption, instead of being reduced to N2. Meanwhile, when the reaction temperature was 200 °C and 250 °C, after adding 15% CO2, the reduction efficiency of NO decreased by approximately 18% and 30% (in Table S2†) respectively, which could also be explained by Le Chatelier's principle.
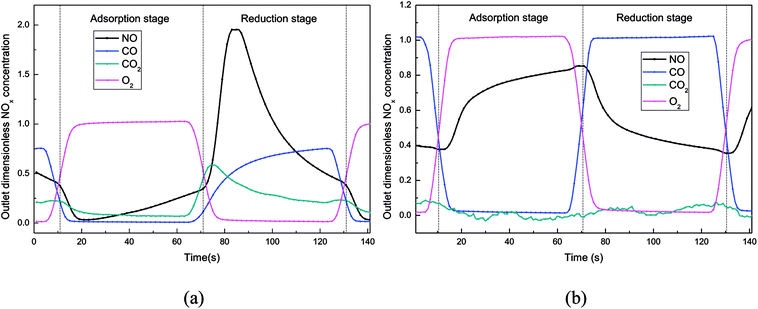 | ||
| Fig. 6 Dimensionless outlet NOx concentration in the simulated rotary reactor, T = 150 °C. ((a) H2O = 0%, (b) H2O = 5%). | ||
The influence of water vapor on NOx adsorption–reduction process at high temperatures (200 °C and 250 °C) was investigated with the outlet NOx concentration plotted in Fig. S4.† It could be seen that, no matter at 200 °C or 250 °C, the outlet NOx concentration profiles at the adsorption stage became higher after adding water vapor into the flue gas, indicating that H2O and NO still had obvious competitive adsorption on the catalyst surface at high temperature. In addition, when the temperature was increased from 150 °C to 250 °C, the effect of water vapor on the NO adsorption became weaker.
At the beginning of the reduction stage, it could be observed from Fig. S4† that more NOx was desorbed from the catalyst surface after adding water vapor into the reactor. The water vapor adsorbed on the catalyst surface had not been desorbed at the beginning of the reduction stage, so the reaction of CO + NO was still inhibited by the water vapor, resulting in that the NOx was just desorbed from the catalyst surface instead of reduced by CO to N2. After a short period of reducing gas blowing, the H2O adsorbed on the catalyst surface was gradually desorbed, which reduced the inhibition of water vapor on the CO + NO reaction on the catalyst surface. However, most NO had been desorbed from the catalyst at the same time, so that the NO concentration at the end of the reduction stage could be decreased to a lower level. It could be confirmed from Table S3† that the NO adsorption efficiency and reduction efficiency of the catalyst decreased significantly when the simulated flue gas contained 5% H2O.
3.4 In situ DRIFT study of the NOx adsorption–reduction process
In order to further investigate the mechanism of the influence of the CO2, SO2 and H2O on the NO adsorption and reduction process, an in situ DRIFT study was performed for co-adsorption and the NO + CO reaction under different atmospheres.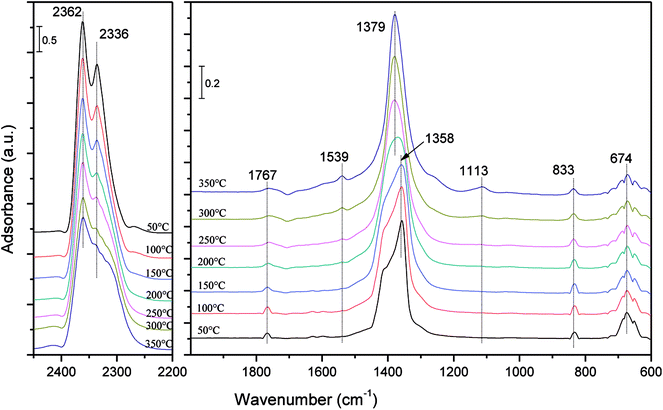 | ||
| Fig. 8 In situ DRIFT spectra following an exposure of Fe–Co/ASC catalysts to a gas streaming containing 1000 ppm NO + 5% O2 + 15% CO2 balanced by Ar with changing temperature from 50 to 350 °C. | ||
Although the concentration of CO2 in the gas streaming was quite high, obvious peaks of nitrogen oxides at around 1379 cm−1 (ref. 5 and 30) could still be observed from the spectra, indicating that the adsorption of NOx on the catalysts was not significantly inhibited by high concentration of CO2. An obvious phenomenon could be found that, as the temperature was increased, the band at 1358 cm−1 was replaced by the band at 1379 cm−1 gradually.5 It could be concluded that the addition of CO2 did not change the adsorption form of nitrogen oxides and the transformation rules of surface nitrogen oxo species.
Moreover, several small bands were observed at 1767, 1539 and 1113 cm−1, which were assigned to C![[double bond, length as m-dash]](https://www.rsc.org/images/entities/char_e001.gif) O stretch,31,32 stretching of C
O stretch,31,32 stretching of C![[double bond, length as m-dash]](https://www.rsc.org/images/entities/char_e001.gif) C bonds32,33 and stretch of C–O single bonds.34 It might caused by the vibration of the carbon support.
C bonds32,33 and stretch of C–O single bonds.34 It might caused by the vibration of the carbon support.
Fig. 9 shows the in situ DRIFT spectra of NO adsorption on the ASC catalysts with the present of O2 and SO2 as the temperature changed from 50 °C to 350 °C. It could be observed from the spectra that the peak of free nitrate ions at 1378 cm−1 (ref. 5) had an obvious change with the temperature. When the temperature was increased from 50 °C to 350 °C, this band tended to be narrower and lower, meanwhile, the band of cis-N2O22− at 833 cm−1 was hardly observed at all tested temperature. The decrease of the bands of nitrogen oxo species could be caused by the competitive adsorption of SO2.35
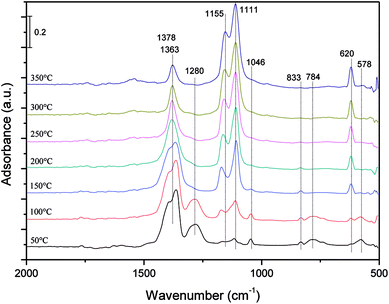 | ||
| Fig. 9 In situ DRIFT spectra following an exposure of Fe–Co/ASC catalysts to a gas streaming containing 1000 ppm NO + 5% O2 + 100 ppm SO2 balanced by Ar with changing temperature from 50 to 350 °C. | ||
Besides the bands of nitrogen oxo species, a large number of bands of sulfate species could be observed from the DRIFT spectra. As the temperature increased from 50 °C to 350 °C, three bands at 1111, 1155 and 620 cm−1 appeared and increased gradually, which were assigned to an –SO3– group,36 an –O–SO3– group,36,37 S![[double bond, length as m-dash]](https://www.rsc.org/images/entities/char_e001.gif) O and S–O group,38 respectively. When the temperature was below 150 °C, a broad band at 1280 cm−1 and three small bands at 1046, 578 and 784 cm−1 appeared, which had no obviously change below 150 °C. According to the previous study,39–41 the bands at 1280, 1155, and 1046 cm−1 were assigned to bidentate sulfate, which were formed by the ν3 splitting of the S–O group. And the band at 578 cm−1 might be attributed to the characteristic frequencies of the SO42− ion.42 The band at 784 cm−1 is rarely observed in the DRIFT spectra, but it might be assigned to a vibration of sulfate species according to the same change as the bands of other sulfate species.
O and S–O group,38 respectively. When the temperature was below 150 °C, a broad band at 1280 cm−1 and three small bands at 1046, 578 and 784 cm−1 appeared, which had no obviously change below 150 °C. According to the previous study,39–41 the bands at 1280, 1155, and 1046 cm−1 were assigned to bidentate sulfate, which were formed by the ν3 splitting of the S–O group. And the band at 578 cm−1 might be attributed to the characteristic frequencies of the SO42− ion.42 The band at 784 cm−1 is rarely observed in the DRIFT spectra, but it might be assigned to a vibration of sulfate species according to the same change as the bands of other sulfate species.
From the in situ DRIFT spectra results shown in Fig. 9, the main forms of SO2 storaged on the surface of ASC catalyst were SO32− and SO42−. At temperatures lower than 150 °C, the main species on the catalyst surface were nitrate species, and sulfate species were relatively few. As the temperature was increased, there would be a slight change in the sulfate species, and the nitrate species on the surface of catalysts would be gradually replaced by sulfate species.
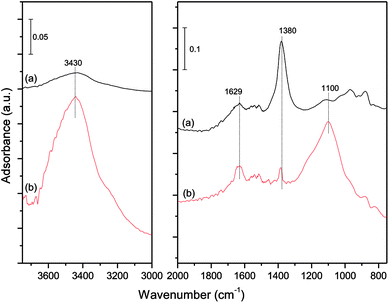
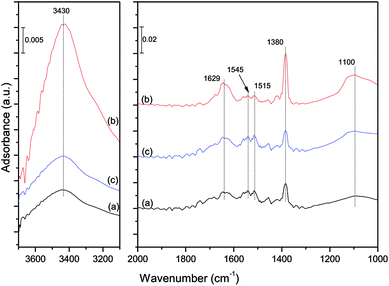
The mechanism of the H2O influence on the NO reduction process was investigated by a DRIFT study. The catalysts were loaded in the fixed bed reactor to adsorb NO. The catalyst samples (a) and (b) were taken out after an exposure to a gas streaming containing 1000 ppm NO + 5% O2 and 1000 ppm NO + 5% O2 + 10% H2O for 30 min, respectively. The DRIFT spectra were then obtained for the catalyst samples (a) and (b) shown in Fig. 10.
It could be observed from Fig. 10 that the species on the catalyst surface were changed significantly. When 10% H2O existed in the simulated flue gas, the band of free nitrate ions5 at 1380 cm−1 decreased drastically, indicating that the NO adsorption capacity of the catalyst was quite low in the presence of 10% H2O. Moreover, three new bands at 3430, 1629 and 1100 cm−1 appeared. The two broad bands at 3430 and 1100 cm−1 could be assigned to different forms of the O–H stretching vibration attributed to the presence of adsorbed water molecules on the catalyst surface.43–45 And the small band at 1629 cm−1 was assigned to δHOH bending vibration of weakly held water44,46,47 It could be concluded that the adsorption strength of water molecules was weak, and most of the water molecules in the flue gas were stored on the catalyst surface by physisorption. The adsorbed water molecules could prevent access of NO to the interfacial active sites, resulting in a poor NO adsorption efficiency of the catalysts.
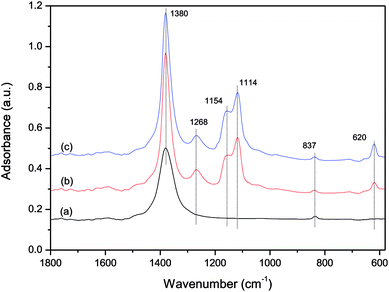
Fig. 12 shows the in situ DRIFT results of the influence of SO2 on the NO + CO reaction on the catalyst surface. Compared with the spectra in Fig. 12(a) and (b), after adding 100 ppm SO2 into the gas streaming, the bands of sulfate species at 620, 1114 and 1154 cm−1 appeared and the band of free nitrate ions at 1380 cm−1 increased markedly, indicating that the NO + CO reaction was drastically inhibited by the sulfate species adsorbed on the catalyst surface. When the SO2 was removed from the gas streaming (in Fig. 12(c)), the three bands of sulfate species had no changes, indicating that these species were adsorbed on the catalyst surface stably, and had an irreversible effect on the catalysts. This result was in agreement with the previous experiment in Fig. 4. And the band at 1268 cm−1 could be observed from Fig. 12(b) and (c), which was assigned to sulfite species.28,48 This band was also stable and could not be removed by reducing gas.
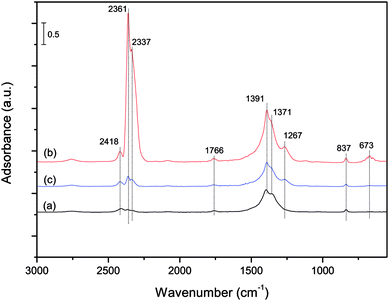
The influence of H2O on the NO reduction process was further investigated by a DRIFT study. The catalysts were loaded in the fixed bed reactor and expose to a gas streaming containing 1000 ppm NO and 2000 ppm CO. The catalyst sample (a) and (b) were taken out before adding 10% H2O and after adding 10% H2O 30 min, respectively. After that, the catalyst sample (c) was taken out after removing 10% H2O from the gas streaming 30 min. The DRIFT spectra of these three samples are shown in Fig. 13.
As compared to the spectra of sample (a) and (b), three bands of water molecules at 3430, 1629 and 1100 cm−1 appeared after adding 10% H2O, and the band of free nitrate ions at 1380 cm−1 increased a lot. The bands at 1545 and 1515 cm−1, which were assigned to bidentate carbonates,49–51 decreased slightly. According to the previous study, the bidentate carbonates were the main adsorption product of CO on the catalyst surface,52 so it could be concluded that the adsorption of carbon monoxide was inhibited by water vapor. And according to the path of NO + CO reaction over Fe–Co/ASC catalyst,52 the less adsorbed CO caused the less consumption of the nitrate species on the catalyst surface. Therefore, the NO + CO reaction was inhibited by water vapor, which caused a low NO reduction of the catalyst. In addition, no new bands of nitrate or carbonate species were observed after adding water vapor, indicating that the water vapor had no influence on the path of the NO + CO reaction. After removing water vapor from the gas streaming (curve (c) in Fig. 13), the bands at 3430, 1629 and 1100 cm−1 disappeared, at the same time, the bands at 1380, 1545 and 1515 cm−1 were back to the initial state (the same as curve (a)). It was indicated that after removing water vapor, the water molecules weakly adsorbed on the catalyst surface were quickly desorbed by the gas streaming, and the NO and CO could be adsorbed on the catalyst surface again, resulting in a recovery of the NO reduction efficiency of the catalyst. The inhibition of H2O on the catalyst was reversible.
3.5 Mechanism of the effect of CO2, H2O and SO2 on the adsorption and reduction process
In summary, competitive adsorption between NO and CO2, H2O and SO2 was the dominant factor of the inhibition on NO adsorption process. As the results showed above, CO2 was just physisorbed on the catalyst surface. Especially, HNO3 could be formed during the co-adsorption of H2O, NO and O2. Sulphuric acid could also produced by the interaction of SO2, H2O and O2, and attached to the catalyst, which could consume the metal sites. On this account, when catalyst adsorbed NO in the presence of CO2, H2O or SO2, the molecule of CO2, H2O and SO2 could occupied the active sites on the catalyst surface more easily than NO, and then some nitric acid and sulphuric acid could be formed on the catalyst surface. Therefore, the amount of adsorbed NO was drastically decreased. For the NO reduction process by carbon monoxide, it could be concluded that the physisorbed H2O and CO2 was easy to be desorbed by the flowing of the reducing gas, while SO2 and the acid species was too stable to be removed from the active sites on the catalyst surface by the reducing gas flow. These species could be stored on the catalyst surface so that the next NO adsorption process was inhibited more serious in the rotary reactor. The adsorption model of NO + O2 and reduction model of NO + CO influenced by CO2, H2O and SO2 are shown in Fig. 14.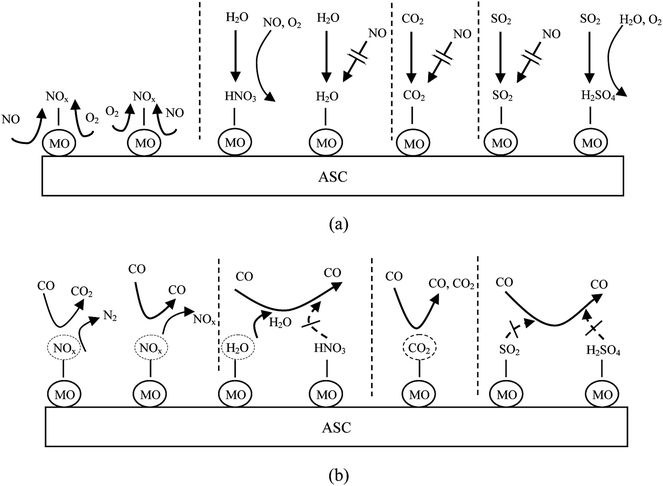 | ||
| Fig. 14 The (a) adsorption model of NO + O2 and (b) reduction model of NO + CO influenced by CO2, H2O and SO2. (MO: metallic oxide). | ||
4. Conclusion
The influence of CO2, H2O and SO2 on the NO adsorption and reduction performance of the Fe/Co ASC catalyst was investigated in the simulated rotary reactor. The results showed that the inhibition effect of CO2 on the NO adsorption and reduction by CO over Fe/Co activated semi-coke catalyst in the fixed bed reactor was more slight than that of H2O and SO2. When H2O and SO2 were both present in the flue gas, the NO reduction efficiency of Fe/Co activated semi-coke catalyst was much lower compared with other conditions.In the NO adsorption–reduction dynamic process, the results were shown as follows:
(1) At 150 °C, the NO adsorption process was significantly inhibited by the CO2 and H2O respectively, which indicated by over 40% decrease of the NO adsorption efficiency, while the inhibition on the NO adsorption almost disappeared when the temperature increased to 250 °C. What's more, at all the tested temperatures, the NO reduction efficiency was always low in the present of 15% CO2. While the effect of H2O on the NO reduction (down to approximately 30% of original level) was slighter than that of CO2 when the temperature was 250 °C.
(2) When 100 ppm SO2 was introduced into the flue gas, the serious inhibition NO adsorption process at the adsorption stage was observed, and the NO adsorption and reduction efficiencies of the Fe/Co ASC catalyst were always at a low level under a SO2-containing flue gas. Moreover, the efficiencies of NO adsorption and reduction of the Fe/Co ASC catalyst could not recovered after removing SO2 from the flue gas, and the sulfur poisoning of the catalyst would not disappear by increasing temperature.
The in situ DRIFT results showed that when the CO2, H2O and SO2 was introduced into the flue gas respectively, the formation of free nitrate ions was always inhibited significantly, which was the main reason for the low NO adsorption efficiency of the Fe/Co ASC catalyst. Meanwhile, no new nitrate species or other intermediates generated after adding CO2, H2O or SO2 into the flue gas, so the pathway of NO + CO reaction was not changed.
Conflicts of interest
There are no conflicts to declare.References
- L. Dong, B. Zhang, C. Tang, B. Li, L. Zhou, F. Gong, B. Sun, F. Gao, L. Dong and Y. Chen, Catal. Sci. Technol., 2014, 4, 482–493 RSC.
- D. Mehandjiev, M. Khristova and E. Bekyarova, Carbon, 1996, 34, 757–762 CrossRef CAS.
- L. Liu, Y. Chen, L. Dong, J. Zhu, H. Wan, B. Liu, B. Zhao, H. Zhu, K. Sun, L. Dong and Y. Chen, Appl. Catal., B, 2009, 90, 105–114 CrossRef CAS.
- L. Wang, X. Cheng, Z. Wang, C. Ma and Y. Qin, Appl. Catal., B, 2017, 201, 636–651 CrossRef CAS.
- X. Cheng, M. Zhang, P. Sun, L. Wang, Z. Wang and C. Ma, Green Chem., 2016, 18, 5305–5324 RSC.
- I. Nova, L. Castoldi, L. Lietti, E. Tronconi and P. Forzatti, Catal. Today, 2002, 75, 431–437 CrossRef CAS.
- T. T. Yang, H. T. Bi and X. Cheng, Appl. Catal., B, 2011, 102, 163–171 CrossRef CAS.
- J. Kim Young, M. Min Kyung, K. Lee Jun, B. Hong Suk, K. Cho Byong and I. S. Nam, ChemCatChem, 2014, 6, 1186–1189 Search PubMed.
- M. Cinke, J. Li, C. W. Bauschlicher, A. Ricca and M. Meyyappan, Chem. Phys. Lett., 2003, 376, 761–766 CrossRef CAS.
- C.-H. Lin and H. Bai, Ind. Eng. Chem. Res., 2004, 43, 5983–5988 CrossRef CAS.
- M. H. Kim and I.-S. Nam, Korean J. Chem. Eng., 2001, 18, 725–740 CrossRef CAS.
- J. Wang, Z. Yan, L. Liu, Y. Zhang, Z. Zhang and X. Wang, Appl. Surf. Sci., 2014, 309, 1–10 CrossRef CAS.
- M. Tutuianu, O. R. Inderwildi, W. G. Bessler and J. Warnatz, J. Phys. Chem. B, 2006, 110, 17484–17492 CrossRef CAS PubMed.
- L. Wang, X. Cheng, Z. Wang, C. Ma and Y. Qin, Energy Fuels, 2017, 31, 7413–7425 CrossRef CAS.
- M. D. Amiridis, I. E. Wachs, G. Deo, J.-M. Jehng and D. S. Kim, J. Catal., 1996, 161, 247–253 CrossRef CAS.
- A. Lindholm, N. W. Currier, E. Fridell, A. Yezerets and L. Olsson, Appl. Catal., B, 2007, 75, 78–87 CrossRef CAS.
- F. Liu and H. He, Catal. Today, 2010, 153, 70–76 CrossRef CAS.
- P. Sun, X. Cheng, Z. Wang, Y. Lai, C. Ma and J. Chang, J. Energy Inst., 2018 DOI:10.1016/j.joei.2018.04.009.
- Z. Huang, Z. Zhu and Z. Liu, Appl. Catal., B, 2002, 39, 361–368 CrossRef CAS.
- L. Zhang, L. Li, Y. Cao, X. Yao, C. Ge, F. Gao, Y. Deng, C. Tang and L. Dong, Appl. Catal., B, 2015, 165, 589–598 CrossRef CAS.
- Y. Li, Y. Guo, J. Xiong, T. Zhu and J. Hao, Ind. Eng. Chem. Res., 2016, 55, 12341–12349 CrossRef CAS.
- Y. Guo, Y. Li, T. Zhu and M. Ye, Energy Fuels, 2013, 27, 360–366 CrossRef CAS.
- H.-H. Tseng and M.-Y. Wey, Carbon, 2004, 42, 2269–2278 CrossRef CAS.
- K. S. Yoo, S. D. Kim and S. B. Park, Ind. Eng. Chem. Res., 1994, 33, 1786–1791 CrossRef CAS.
- Y. Shu, T. Aikebaier, X. Quan, S. Chen and H. Yu, Appl. Catal., B, 2014, 150–151, 630–635 CrossRef CAS.
- T. Shaymurat, Q. Tang, Y. Tong, L. Dong and Y. Liu, Adv. Mater., 2013, 25, 2269–2273 CrossRef CAS PubMed.
- R. W. Stevens, R. V. Siriwardane and J. Logan, Energy Fuels, 2008, 22, 3070–3079 CrossRef CAS.
- G. Herzberg, Chapter IV: Molecular Spectra and Molecular Structure, II, Infrared and Raman Spectra of Polyatomic Molecules, 1945 Search PubMed.
- R. Bal, B. B. Tope, T. K. Das, S. G. Hegde and S. Sivasanker, J. Catal., 2001, 204, 358–363 CrossRef CAS.
- K. I. Hadjiivanov, Catal. Rev., 2000, 42, 71–144 CrossRef CAS.
- Z. Zhang, M. Xu, H. Wang and Z. Li, Chem. Eng. J., 2010, 160, 571–577 CrossRef CAS.
- C. Hontoria-Lucas, A. J. López-Peinado, J. d. D. López-González, M. L. Rojas-Cervantes and R. M. Martín-Aranda, Carbon, 1995, 33, 1585–1592 CrossRef CAS.
- M. S. Shafeeyan, W. M. A. W. Daud, A. Houshmand and A. Arami-Niya, Appl. Surf. Sci., 2011, 257, 3936–3942 CrossRef CAS.
- P. E. Fanning and M. A. Vannice, Carbon, 1993, 31, 721–730 CrossRef CAS.
- T. Qiang, Z. Zhigang, Z. Wenpei and C. Zidong, Fuel, 2005, 84, 461–465 CrossRef.
- Y.-W. Lee, J.-W. Park, J.-H. Choung and D.-K. Choi, Environ. Sci. Technol., 2002, 36, 1086–1092 CrossRef CAS PubMed.
- B. Nyberg and R. Larsson, Acta Chem. Scand., 1973, 27, 63–70 CrossRef CAS.
- V. Gomez-Serrano, M. Acedo-Ramos and J. Lopez-Peinado Antonio, J. Chem. Technol. Biotechnol., 1999, 68, 82–88 CrossRef.
- G. Severa, K. Bethune, R. Rocheleau and S. Higgins, Chem. Eng. J., 2015, 265, 249–258 CrossRef CAS.
- B. Q. Jiang, Z. B. Wu, Y. Liu, S. C. Lee and W. K. Ho, J. Phys. Chem. C, 2010, 114, 4961–4965 CrossRef CAS.
- D. Peak, R. G. Ford and D. L. Sparks, J. Colloid Interface Sci., 1999, 218, 289–299 CrossRef CAS PubMed.
- Z. Zhu, Z. Liu, H. Niu, S. Liu, T. Hu, T. Liu and Y. Xie, J. Catal., 2001, 197, 6–16 CrossRef CAS.
- C. Moreno-Castilla, M. A. Ferro-Garcia, J. P. Joly, I. Bautista-Toledo, F. Carrasco-Marin and J. Rivera-Utrilla, Langmuir, 1995, 11, 4386–4392 CrossRef CAS.
- D. Gamarra and A. Martínez-Arias, J. Catal., 2009, 263, 189–195 CrossRef CAS.
- J. Przepiórski, J. Hazard. Mater., 2006, 135, 453–456 CrossRef PubMed.
- G. Martra, S. Coluccia, L. Marchese, V. Augugliaro, V. Loddo, L. Palmisano and M. Schiavello, Catal. Today, 1999, 53, 695–702 CrossRef CAS.
- J. Szanyi, J. H. Kwak, R. J. Chimentao and C. H. F. Peden, J. Phys. Chem. C, 2007, 111, 2661–2669 CrossRef CAS.
- R. C. Lord, J. Am. Chem. Soc., 1965, 87, 1155–1156 CrossRef.
- C. Sun, Y. Tang, F. Gao, J. Sun, K. Ma, C. Tang and L. Dong, Phys. Chem. Chem. Phys., 2015, 17, 15996–16006 RSC.
- M. C. Kung and H. H. Kung, Catal. Rev., 1985, 27, 425–460 CrossRef.
- Y. Xiong, X. Yao, C. Tang, L. Zhang, Y. Cao, Y. Deng, F. Gao and L. Dong, Catal. Sci. Technol., 2014, 4, 4416–4425 RSC.
- L. Wang, Z. Wang, X. Cheng, M. Zhang, Y. Qin and C. Ma, RSC Adv., 2017, 7, 7695–7710 RSC.
Footnote |
| † Electronic supplementary information (ESI) available. See DOI: 10.1039/c8ra07658h |
| This journal is © The Royal Society of Chemistry 2018 |

