DOI:
10.1039/C8RA07566B
(Paper)
RSC Adv., 2018,
8, 38538-38549
An energy self-compensating phosphosilicate material applied to temperature sensors†
Received
11th September 2018
, Accepted 28th October 2018
First published on 15th November 2018
Abstract
For years, researchers have been exploring effective methods of sustaining the emission intensity of phosphors with increasing temperature by suppressing emission loss. In this work, we developed a multi-cationic site and lattice-distorted phosphosilicate phosphor, Ca8Al2P6SiO28:Ce, Eu. To obtain luminous-self-healing properties, we attempted to change the energy depths and density distributions of the traps to achieve self-suppression of emission loss by energy compensation from the traps or energy transfer between Ce3+ and Eu2+/Eu3+. The temperature-dependent emission spectra indicate that the luminescence of Ce3+ presents similar change trends in both single and co-doped samples. Meanwhile, the change trends of the Eu2+/Eu3+ emission intensities show obvious differences. Combined with the thermoluminescence curves, decay times, temperature-dependent fluorescence characteristics and cathodoluminescence spectra, we speculate that the traps play an important role in the luminescence of Ce3+ due to the smaller energy difference of the Ce3+ excited states and the conduction band. The abnormal luminescence of Eu2+/Eu3+ mainly results from the energy transfer of Ce3+ to Eu2+/Eu3+. For this phenomenon, a high thermal sensitive fluorescence intensity ratio is obtained in a broad temperature range, which implies that this material can be applied in temperature sensors.
1. Introduction
It is well known that phosphates and silicates have attracted considerable attention in luminescence research due to their excellent photoluminescence and thermal properties, such as higher physical and chemical stability and lower synthesis temperature. Rare earth-doped materials have the advantages of large Stokes shifts, narrow emission lines and long lifetimes.1–10 These materials feature a broad range of potential applications in display devices, optoelectronics, laser cooling, optical sensing, luminescence solar cell concentrators, security applications and bio-imaging; they include SrWO4:Yb3+, Er3+,11 YPO4:Yb3+, Tb3+,12 Y3Al2Ga3O12:Ce3+, Cr3+,13 Y2SiO5:Eu3+, Bi3+,14 Ca9Mg(PO4)6F2:Eu2+, Mn2+,15 KLu2F7:Er3+, Yb3+,16 K3LuF6:Er3+, and Yb3+.17
In practical application, phosphors usually exhibit typical thermal quenching phenomena at high temperature.18 This decreases the luminescence intensity when the phosphor is operated at elevated temperature. For years, researchers have been exploring effective methods to sustain the emission intensity of phosphors with increasing temperature by suppressing emission loss from non-radiative transitions by a counter mechanism. Recently, some beneficial results have been obtained. In a 2017 Nature Materials article, Yoon Hwa Kim et al. reported an interesting host that can absorb excess thermal energy, generate structural transformation, and then engender defect levels; these serve as electron-trapping centers, transferring energy to the assisted ions by thermal activation from traps.19 That is to say, appropriate traps are a key factor and ultimately play an important role in the process of suppressing emission loss. In view of this thought, we hoped to design a multi-cationic site material in which rational traps can be introduced by adjusting and optimizing the synthesis scheme to decrease the probability of energy loss. Combined with multi-activators, we expected to exploit the specific energy compensation from traps or energy transfer (ET) from the sensitizer to the activator to suppress or even tailor the energy loss of the luminescence centers in the heating process. In this paper, we selected the phosphosilicate Ca8Al2P6SiO28 (CAPS) as a general luminescent matrix. CAPS has a mineral whitlockite structure that is similar to that of β-Ca3(PO4)2. In this structure, there are six different sites that can offer changeable crystal environments. Especially, these cationic sites are not completely filled, which is beneficial to produce traps with different depths. Additionally, we can also replace the partial [PO4]3− tetrahedra with [SiO4]4− tetrahedra to further adjust the energy and density distributions of the traps. A series of CAPS:Ce, Eu phosphors were successfully synthesized by solid state reactions at high temperature, and we carefully studied their structures, luminescence characteristics, trap distributions and detailed physical processes of electron transition with increasing temperature by XRD, photoluminescence (PL), photoluminescence excitation (PLE) spectra, decay times, temperature-dependent fluorescence studies, cathodoluminescence (CL) spectra, etc.
2. Experimental section
2.1. Materials and synthesis
The CAPS:0.03Ce, xEu samples were synthesized by high temperature solid-state reactions. Firstly, the raw materials Eu2O3 (4 N), CaCO3 (A.R.), SiO2 (A.R.), Al2O3 (A.R.), CeO2 (4 N) and (NH4)2HPO4 (A.R.) were weighed in an agate mortar. The samples were then calcined in a crucible for 2 hours in air at 900 °C to release NH3, CO2 and H2O and were then heated for 6 hours in a fluidized N2–H2 (5%) reduction atmosphere at 1250 °C to 1300 °C. Finally, the samples were cooled to room temperature and ground into powder for further characterization.
2.2. Measurements and characterization
The crystal structures of the samples were characterized by powder X-ray diffraction (Rigaku D/Max-2400 X-ray diffractometer) and XRD analysis with CuKα rays filtered by nickel. The PL, PLE and attenuation curves of the samples were measured using a 450 W Xe light source and a ns pulse hydrogen lamp on a FLS-920T fluorescence spectrophotometer (Livingston, UK). All measurements were carried out at room temperature. The thermal quenching was tested by a heating device (TAP-02) combined with PL equipment. The TL curves were measured by an FJ-417A TL measuring instrument (Beijing nuclear instrument plant, Beijing, China). Low-voltage CL spectra were obtained using a modified Mp-Micro-S instrument.
3. Results and discussion
3.1. Phase identification
The representative XRD diagrams of single and co-doped CAPS samples with Ce and Eu ions are given in Fig. S1† and 1. The diffraction peaks of all the samples can be attributed to the pure phase of Ca9AlP7O28 (CAP) by its standard JCPDS card (no. 48-1192). No other phases were detected, indicating that the samples were single phase. CAP is related to the mineral pyroxene and has the same structure as β-Ca3(PO4)2. In the host, there are six cation sites: M1 to M6. The M1, M2, and M3 sites are eight-coordinated with oxygen atoms and are fully occupied by Ca2+. The M4 site is surrounded by nine oxygen atoms and is 50% occupied by Ca2+. The distorted octahedral M5 site is fully occupied by Ca2+. The M6 site is vacant. In this experiment, the diffraction peaks of the CAPS:0.03Ce and xEu samples shifted to smaller angles with increasing doping ion concentration. In the reference crystal radii of all the species,20 the effective ionic radii for eight-coordinated Ca2+, Ce3+, Eu2+, and Eu3+ are 1.12, 1.143, 1.25 and 1.066 Å, respectively. For nine-coordinated Ca2+, Ce3+, Eu2+, and Eu3+, the effective ionic radii are 1.18, 1.196, 1.3 and 1.12 Å, respectively. For six-coordinated Al3+, Ce3+, Eu2+, and Eu3+, the effective ionic radii are 0.39, 1.01, 1.17 and 0.947 Å, respectively. It is obvious that the shifts are caused by the differences in the ionic radii. According to a report by B. I. Lazoryak et al.,21 solid solutions in Ca9RP7O28 systems can be formed in this region for all trivalent elements with radii 0.5 ≤ r ≤ 1.3 Å. Large cations, such as some rare earth elements, prefer to occupy the M1 to M3 positions, while small cations (Al3+, Fe3+, etc.) prefer to occupy the M5 position. Thus, we consider that the doped ions Ce3+, Eu2+, and Eu3+ are likely to occupy the four sites M1 to M4; this speculation is further proved in the following spectrum analysis. The structure diagram of CAPS is shown in Fig. S2.†
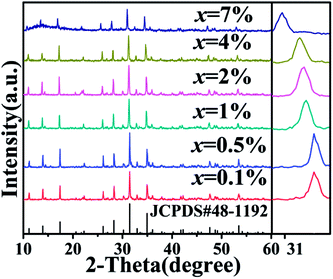 |
| | Fig. 1 The XRD patterns of CAP and the CAPS:0.03Ce, xEu samples (x = 0.1%, 0.5%, 1%, 2%, 4%, 7%). | |
3.2. Photoluminescence property analysis
Fig. 2 shows the PLE spectrum monitored at 339 nm and the PL spectrum excited at 296 nm of CAPS:0.03Ce3+; the PLE spectrum (black line) contains three obvious absorption bands at 265, 296 and 313 nm due to the 4f–5d transition of Ce3+, with the highest peak at 296 nm. Upon excitation at 296 nm, CAPS:0.03Ce3+ exhibits a broad purple-blue emission band in the range from 310 to 420 nm that peaks at 339 nm. To further determine the crystallographic sites of the doping ions in the CAPS host, the coordination number n can be calculated by the following empirical relation:22| |
 | (1) |
| |
 | (2) |
where Q is the lowest energy position at the edge of the d band of the free ion (here, Q = 50![[thin space (1/6-em)]](https://www.rsc.org/images/entities/char_2009.gif) 000 cm−1 for Ce3+), V is the valence state of the active ion, n is the coordination number, ea is the electron affinity of the anion, and r is the radius of the cation (Ca2+) replaced by the active cation. The value of the parameter n was calculated to be 8 to 10. That is, the doping ion Ce3+ may replace two different eight-coordinated sites (M1, M2, M3) and one nine-coordinated site (M4), which corresponds with the XRD measurement results. Because the crystal environments of M1, M2 and M3 are very similar, the emission bands of the active ions in the three sites are difficult to distinguish. In order to simplify the analysis, we assume that the active ions in the M1, M2, and M3 sites only show emission bands. For the sample CAPS:0.03Ce3+, the emission spectrum in Fig. 2 can be readily decomposed into four separate Gaussian components centered at 340 nm (29
000 cm−1 for Ce3+), V is the valence state of the active ion, n is the coordination number, ea is the electron affinity of the anion, and r is the radius of the cation (Ca2+) replaced by the active cation. The value of the parameter n was calculated to be 8 to 10. That is, the doping ion Ce3+ may replace two different eight-coordinated sites (M1, M2, M3) and one nine-coordinated site (M4), which corresponds with the XRD measurement results. Because the crystal environments of M1, M2 and M3 are very similar, the emission bands of the active ions in the three sites are difficult to distinguish. In order to simplify the analysis, we assume that the active ions in the M1, M2, and M3 sites only show emission bands. For the sample CAPS:0.03Ce3+, the emission spectrum in Fig. 2 can be readily decomposed into four separate Gaussian components centered at 340 nm (29![[thin space (1/6-em)]](https://www.rsc.org/images/entities/char_2009.gif) 412 cm−1), 365 nm (27
412 cm−1), 365 nm (27![[thin space (1/6-em)]](https://www.rsc.org/images/entities/char_2009.gif) 392 cm−1), 359 nm (27
392 cm−1), 359 nm (27![[thin space (1/6-em)]](https://www.rsc.org/images/entities/char_2009.gif) 855 cm−1) and 390 nm (25
855 cm−1) and 390 nm (25![[thin space (1/6-em)]](https://www.rsc.org/images/entities/char_2009.gif) 641 cm−1) by the Gauss curve fitting. The energy difference ΔE1 between 340 and 365 nm is 2020 cm−1 and ΔE2 between 359 and 390 nm is 2214 cm−1, which is very close to the usual energy difference between the Ce3+ 2FJ (J = 7/2, 5/2) states.23 From eqn (1), we can see that the larger the value of n × r, the higher the value of E. Thus, the fitting peaks at 340 and 365 nm and 359 and 390 nm can be attributed to the nine- and eight-coordinated sites, respectively. In addition, the inset of Fig. 2 shows the curve of concentration quenching of Ce3+ and the optimal emission intensity located at x = 0.03.
641 cm−1) by the Gauss curve fitting. The energy difference ΔE1 between 340 and 365 nm is 2020 cm−1 and ΔE2 between 359 and 390 nm is 2214 cm−1, which is very close to the usual energy difference between the Ce3+ 2FJ (J = 7/2, 5/2) states.23 From eqn (1), we can see that the larger the value of n × r, the higher the value of E. Thus, the fitting peaks at 340 and 365 nm and 359 and 390 nm can be attributed to the nine- and eight-coordinated sites, respectively. In addition, the inset of Fig. 2 shows the curve of concentration quenching of Ce3+ and the optimal emission intensity located at x = 0.03.
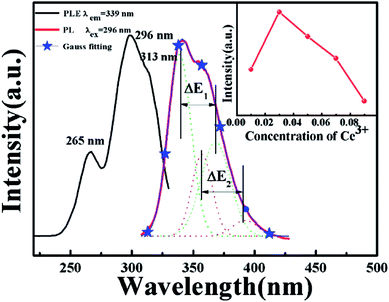 |
| | Fig. 2 PLE spectrum monitored at 339 nm and PL spectrum excited at 296 nm of CAPS:0.03Ce3+; the inset shows the curve of the intensity of Ce3+ with concentration at 339 nm. | |
Fig. 3 shows the PLE and PL spectra of the phosphor CAPS:0.03Eu. The excitation spectrum was monitored at 614 nm, and the corresponding excitation spectrum includes broad absorption bands and some line absorptions. The charge transfer band (CTB) of O2–Eu3+ has the largest broadband absorption at 260 nm.24–27 The strong sharp lines at 394 and 465 nm correspond to the characteristic f–f transitions of Eu3+. When monitored at 451 nm, the corresponding PLE spectrum simply consists of a strong emission broadband that peaks at 351 nm; this results from the 4f–5d transition absorption of Eu2+. When comparing the black solid line with the red line, we can see that there is no Eu2+ broadband absorption when monitored at 614 nm (the red line). This indicates that there is no ET between Eu2+ and Eu3+; that is, the luminescence properties of Eu2+ and Eu3+ can be considered to be completely independent. Upon 260 nm excitation, the corresponding PL spectrum contains a broad band centered at ∼445 nm and some line peaks due to the Eu2+ d–f transition and Eu3+ characteristic f–f transition, which suggests that Eu3+ has not been fully reduced under a flowing N2–H2 (5%) atmosphere in the host CAPS. The weak peak is located at about 593 nm and belongs to the 5D0 → 7F1 magnetic dipole transition of Eu3+, which is insensitive to the site symmetry. The main peak at 614 nm is attributed to the 5D0 → 7F2 electric dipole transition of Eu3+, indicating that Eu3+ occupies the asymmetric center of the main lattice. Upon 394 nm excitation, the PL spectrum shape is similar to that upon 260 nm excitation except for the broadband emission position and the slight difference in the full-width at haft-maximum of Eu2+, which may originate from the selective excitation of Eu2+ at the different sites. When excited at 351 nm, the PL spectrum of CAPS:0.03Eu only shows an asymmetric broad band from 380 to 650 nm with a maximum wavelength at about 451 nm, as shown in the inset of Fig. 3. By eqn (1) and (2) (Q = 3400 cm−1), the n for Eu2+ can be also calculated as 8 to 10, which is similar to the case of Ce3+. By the Gaussian fitting, the asymmetric emission band can be fitted by two components with peaks at 435 and 473 nm, respectively,28,29 which can be attributed to Eu2+ occupying two different sites with nine and eight-coordination.
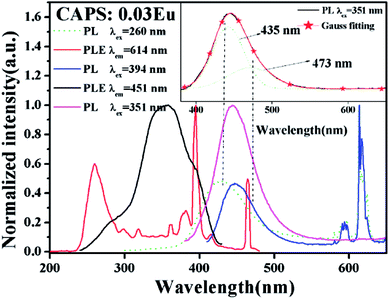 |
| | Fig. 3 The PLE spectra monitored at 451 and 614 nm and the PL spectra excited at 260, 351, and 394 nm of CAPS:0.03Eu. The inset shows the Gauss curves of the PL spectra of CAPS:0.03Eu under excitation at 351 nm. | |
Comparing the PLE spectra of Eu2+, Eu3+ with the PL spectrum of Ce3+ in Fig. 4(a), we can clearly see an obvious spectrum overlap in the range of 310 to 420 nm; this implies that ET can occur between Ce3+ and Eu2+, Eu3+. In order to confirm the existence of ET, we measured the PLE spectra of CAPS:0.03Ce monitored at 339 nm, CAPS:0.03Ce, 0.01Eu monitored at 443 and 614 nm and CAPS:0.03Eu monitored at 451 and 614 nm. Compared to the PLE spectra of CAPS:0.03Eu monitored at 451 and 614 nm, the PLE spectrum of CAPS:0.03Ce, 0.01Eu clearly has a new absorption band at about 296 nm, marked by a green ellipse line, and a slight enhancement at about 265 nm, marked by a black ellipse line. These phenomena indicate that the absorption of Ce3+ contributes to the emissions of Eu2+ and Eu3+ and thus proves that ET occurs between Ce3+ and Eu2+, Eu3+. Similar to the PLE spectrum of the Eu single-doped sample, the excitation spectrum of the Ce, Eu co-doped sample monitored at 614 nm also does not present the obvious excitation of Eu2+, which indicates that ET does not similarly occur between Eu2+ and Eu3+ in CAPS:0.03Ce, 0.01Eu. Fig. 4(b) and (c) reveal the PL spectra of CAPS:0.03Ce, xEu (0 ≤ x ≤ 0.07). Under excitation at 296 and 265 nm, the PL spectra of the CAPS:0.03Ce, xEu samples consist of two emission bands due to Ce3+ (310 to 420) and Eu2+ (370 to 550) and several weak emission peaks of Eu3+ (above 575 nm). As the Eu ion concentration x increases, the emission intensity of the Ce3+ ions decreases monotonically, whereas the emission intensities of Eu2+ and Eu3+ simultaneously increase, as shown in the insets of Fig. 4(b) and (c); this also indirectly supports the occurrence of ET among Ce3+, Eu2+ and Eu3+.30 Meanwhile, with increasing x, the emission band of Eu2+ still shows a slight red shift, which is probably due to two reasons: the change in the crystal field environment and the selective excitation of Eu2+ at the different sites. In addition, as the Eu content increases, the distance between the sensitizer Ce3+ and the activators Eu2+ and Eu3+ becomes shorter. When the distances of Ce3+, Eu2+ and Eu3+ exceed the critical distances, concentration quenching will occur, as shown in Fig. 4(d). Upon 296 nm excitation, the optimal concentrations of both Eu2+ and Eu3+ are 1%. However, under excitation at 265 nm, the Eu3+ emission intensities achieve the maximum at 2%. This may be due to the differences in ET efficiency between Ce3+ at different sites and Eu2+ and Eu3+ at different sites.
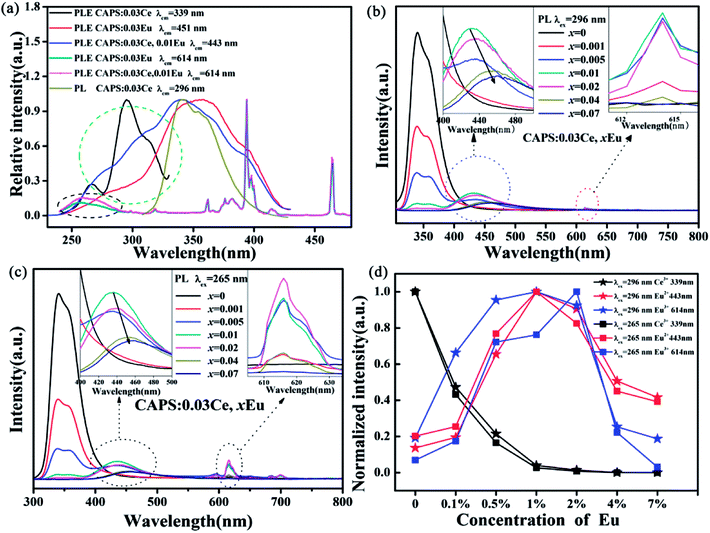 |
| | Fig. 4 (a) The PL spectra of CAPS:0.03Ce excited at 296 nm and the PLE spectra of CAPS:0.03Ce monitored at 339 nm, CAPS:0.03Ce, 0.01Eu monitored at 443 and 614 nm and CAPS:0.03Eu monitored at 451 and 614 nm. (b) and (c) PL spectra of CAPS:0.03Ce, xEu excited at 296 and 265 nm. (d) The emission intensities of Ce and Eu ions in CAPS:0.03Ce, xEu excited at 296 and 265 nm (0 ≤ x ≤ 0.07). | |
In order to more clearly understand the ET process, the lifetimes as well as the ET efficiencies were measured and calculated. Fig. 5(a) shows the decay curves of Ce3+ in CAPS:0.03Ce, xEu excited at 296 nm and monitored at 339 nm. The corresponding luminescence decay times can be well fitted with a second-order exponential decay mode by the following equation:31
| |
I = A1![[thin space (1/6-em)]](https://www.rsc.org/images/entities/char_2009.gif) exp(−t/τ1) + A2 exp(−t/τ1) + A2![[thin space (1/6-em)]](https://www.rsc.org/images/entities/char_2009.gif) exp(−t/τ2) exp(−t/τ2)
| (3) |
where
I is the luminescence intensity;
A1 and
A2 are the constants;
t is time; and
τ1 and
τ2 are the rapid and slow lifetimes for the exponential components, respectively. Using these parameters, the average decay times (
τ) can be determined by the formula given below:
32| | |
τ = (A1τ12 + A2τ22)/(A1τ1 + A2τ2)
| (4) |
 |
| | Fig. 5 (a) The decay curves of the CAPS:0.03Ce, xEu samples excited at 296 nm and monitored at 339 nm. (b) The variation of τ and ηT with increasing Eu. (c) The CIE chromaticity coordinates of the samples CAPS:0.03Ce, xEu under excitation at 296 nm (0.001 ≤ x ≤ 0.07); the insets show photos of the samples under UV irradiation. | |
The average decay times (τ) were calculated to be 27.01, 20.67, 5.11, 3.21, 2.24 and 1.85 ns for CAPS:0.03Ce, xEu with x = 0, 0.001, 0.005, 0.01, 0.02, 0.04 and 0.07, respectively. In this Ce and Eu ions co-doped system, the average decay times were found to shorten with increasing Eu content. The changing trend is also shown in Fig. 5(b), which strongly supports the ET process from Ce3+ to Eu2+ or Eu3+; this ET process may happen via a resonant-type mechanism.33
The efficiency of ET (ηT) from Ce3+ to Eu2+/Eu3+ in the CAPS:0.03Ce, xEu sample was calculated using the following formula:34
| |
 | (5) |
where
τS0 and
τS are the decay lifetimes of Ce
3+ in the absence and presence of Eu
2+ and Eu
3+, respectively. The ET efficiency curve is shown in
Fig. 5(b). In addition, the CIE chromaticity coordinates of the samples CAPS:0.03Ce,
xEu under excitation at 296 nm (0.001 ≤
x ≤ 0.07) and photos of the samples under UV irradiation are shown in
Fig. 5(c); the emission color changes from pink to blue-green with increasing Eu ion content from 0 to 0.07.
3.3. Temperature-dependent photoluminescence behavior
A comprehensive understanding of the temperature dependence of phosphors in the process of their application is indispensable due to the thermal problems in many running devices and fluorescent temperature sensors.35 Numerous investigations have discussed these thermal quenching behaviors. Two competing factors prevail:one is the activation energy of non-radiative relaxation, and the other is the photon and phonon coupling effect caused by temperature, which improves the luminescence intensity of the activator. The temperature-dependent luminescence properties for the CAPS:Ce, CAPS:Eu and CAPS:0.03Ce, 0.005Eu phosphors are traced in the temperature range from 25 °C to 250 °C, and the results are shown in Fig. 6(a–c) . For the CAPS:Ce and CAPS:Eu phosphors, with increasing temperature, the emission intensities of all the samples gradually decline. The emission intensities of Ce3+, Eu2+ and Eu3+ at 250 °C are 81%, 10% and 47% of their initial intensities at 25 °C, respectively. When Ce and Eu ions are co-doped into the CAPS host, the decreasing trend of the Ce3+ PL intensity does not change greatly, as shown in Fig. 6(d). As the PL intensity decline of Eu2+ becomes slower, the PL intensity of Eu3+ actually increases. The intensities of Ce3+, Eu2+ and Eu3+ in the sample CAPS:0.03Ce3+, 0.005(Eu2+/Eu3+) at 250 °C are 76%, 58% and 152% of those at 25 °C, respectively. In other words, Eu2+ and Eu3+ in the Ce, Eu co-doped samples show good thermal stability, which can be easily explained by the ET from Ce3+ to Eu2+, Eu3+ under the stronger electron–phonon coupling with increasing temperature. Also, according to this speculation, the emission intensity of Ce3+ in the co-doped sample should rapidly decrease due to a large number of transferred electrons in the Ce3+ excited states to the Eu2+, Eu3+ excited states. However, the actual experimental data indicate that the Ce3+ luminescence demonstrates similarly excellent thermal stability in the two samples. Thus, there should be an additional physical process to compensate the loss of Ce3+. The traps are the only possible source of this additional physical process. In the following paragraphs, we will carefully analyse the effect of the traps.
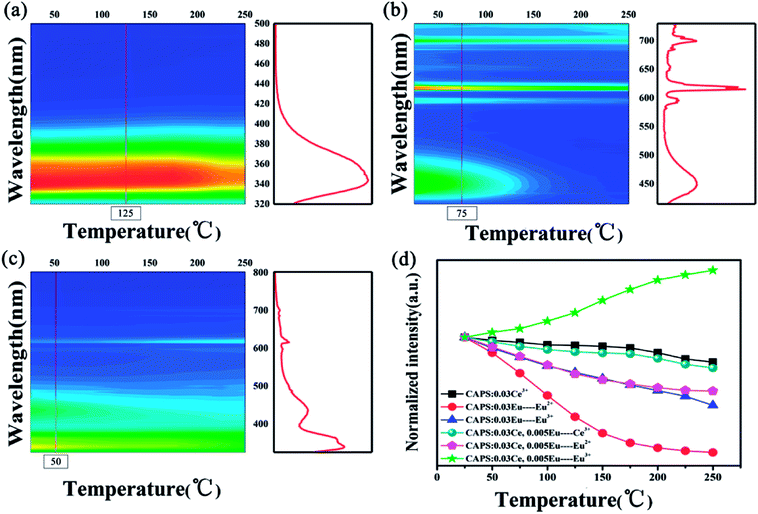 |
| | Fig. 6 The PL spectra of typical samples: (a) CAPS:0.03Ce, (b) CAPS:0.03Eu, and (c) CAPS:0.03Ce, 0.005Eu at various temperatures. (d) The dependence of the normalized PL intensities on temperature for typical phosphors. | |
In the previous structural analysis, we found that our CAPS samples have six cation sites. The M1, M2, M3 and M5 sites are fully occupied by Ca2+. The M4 site is 50% occupied by Ca2+. The M6 site is vacant. Therefore, when doping ions are introduced, especially in the case of non-equivalent replacement, cation vacancies are generated easily. Meanwhile, for the phosphate material, there are many reports about the occurrence of oxygen vacancies through oxygen escaping from sites during the sintering process under both reducing and air atmospheres.36 As a result, numerous traps may exist to capture electrons or holes in the host. Fig. 7(a) shows the thermoluminescence (TL) curves of the CAPS, CAPS:0.03Ce3+, CAPS:0.03Eu, and CAPS:0.03Ce, 0.005Eu samples under the same conditions of exposure to pre-excitation at 254 nm for 5 min before measurement. The heating rate of TL measurements is 1 K s−1. It can be seen that the TL curve of the Ce3+-doped sample is similar to that of the host. Both samples have two broad bands; with the introduction of Ce3+, the bands slightly shift to higher temperatures. For the sample CAPS:0.03Eu, the shapes of the TL curves greatly change. The second peak at about 250 °C almost disappears. When Ce and Eu ions are co-doped, the curve is similar to that of the Eu single sample, except that a weak shoulder peak re-appears above 150 °C. These results indicate that Eu ions are the dominant factor affecting the trap energy and density distribution. Fig. 7(b) and S3(a)† show the TL curves of CAPS:0.03Ce, 0.005Eu and CAPS:0.03Eu at different delay times. As the delay time increases, the TL intensity gradually decreases and the highest peak of the TL curve continuously shifts to a higher temperature; this indicates that the escape rate of the charges captured in shallow traps is much faster than that of those in deep traps at room temperature.37
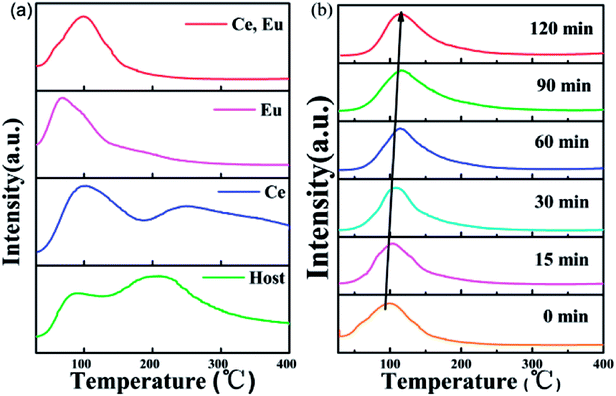 |
| | Fig. 7 (a) TL curves of the CAPS, CAPS:0.03Ce3+, CAPS:0.03Eu, and CAPS:0.03Ce, 0.005Eu samples after irradiation by a UV lamp for 5 min. (b) TL curves of CAPS:0.03Ce3+, 0.005Eu at different delay times after irradiation by a UV lamp for 5 min. | |
According to the Eeckhout method,38 a series of excitation temperature-dependent TL experiments of CAPS:0.03Ce, 0.005Eu and CAPS:0.03Eu were performed, as shown in Fig. 8(a) and S3(b).† First, the two samples were exposed to re-excitation by a UV lamp for 5 min and preheated to a certain temperature (Texc) for 10 min in a muffle furnace; then, they were cooled to ambient temperature. Thermal disturbance can affect the distribution of trapped electrons by detrapping a portion of the electrons in the shallow traps; therefore, the TL curves measured at different Texc values provide important information regarding the different unemptied fractions of trapped electrons. Fig. 8(a) and S3(b)† manifest that with increasing Texc, not only does the TL intensity decrease but the maximum TL peak gradually shifts to a higher temperature. Because the trap depth is generally proportional to the temperature of the TL peak, the shift of the TL peak shows that the trap distribution in co-doped CAPS is consecutive and broad. As the Texc increases, the electrons in the shallow traps are released gradually, and the decrease corresponds to a decrease of the electron density in the traps at a certain depth. The trap depths of these defects can be calculated by the following equation:39
| |
 | (6) |
where
ET is the thermo-active energy of the trap depths (in eV), denoting the energy gap between the trap levels and the conduction band of the host, and
TM is the temperature of the TL peak (in Kelvin, K). The trap depths of CAPS:0.03Ce, 0.005Eu and CAPS:0.03Eu were calculated to be 0.744, 0.818, 0.836, 0.882, 0.966, 1.028, 1.054, and 1.156 eV and 0.682, 0.776, 0.824, 0.868, 0.892, 0.926, 1.022, and 1.084 eV for the temperatures 298, 323, 348, 373, 398, 423, 448 and 473 K, respectively. Based on this, the trap density and energy distributions can be depicted, as shown in
Fig. 8(b) and S3(c).
† These results indicate that traps with different energy depths and density distributions indeed exist in our materials.
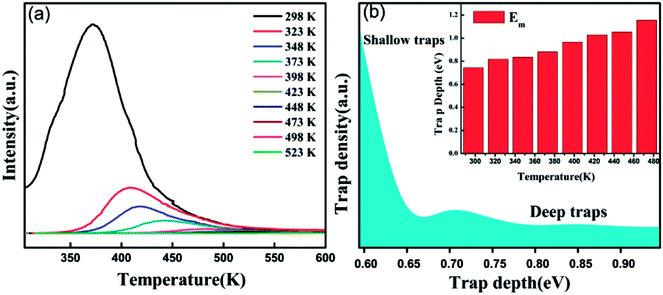 |
| | Fig. 8 (a) Excitation temperature-dependent TL curves of CAPS:0.03Ce, 0.005Eu by pre-exciting for 5 min and pre-heating for 10 min at different Texc. (b) Trap density and depth distributions in CAPS:0.03Ce, 0.005Eu. | |
Based on the configuration coordinate model, Fig. 9 carefully depicts the possible ET processes among the trap levels, Ce3+, Eu2+ and Eu3+. With increasing temperature, the traps with appropriate energy depths and density distributions will affect our PL spectra in three probable ways: (1) the radiative transitions from recombination of electron–hole pairs can transfer energy to activators along path ①; (2) direct cross transfer occurs between the trap levels and activator excited states along path ②; (3) the traps near the conduction band capture electrons, release them by thermal excitation to the conduction band, and then compensate for the activator excited states along path ③. In the material CAPS, we do not observe an obvious self-luminescence phenomenon, indicating that the influence of traps on Ce or Eu from path ① is weak. Efficient ET from the traps to Ce and Eu by path ② requires at least three factors: (1) the energies of the trap levels and the Ce or Eu excited states must be similar; (2) the numbers of traps with similar energies must be sufficiently high; (3) the distances between traps with similar energies and Ce or Eu must be sufficiently short. We consider that few traps can satisfy these strict conditions in our materials. Thus, the influence of the traps on Ce or Eu from path ② can be neglected. With increasing temperature, the electrons in the traps can leap into the conduction band by a thermal disturbance effect and become free electrons. This is because Ce3+ has a higher excitation state and a closer conduction band than Eu2+ and Eu3+. Thus, the vast majority of electrons can relax to the excitation state of Ce3+, and only a few electrons can relax to the excitation states of Eu2+ and Eu3+. As a result, Ce3+ has excellent thermal stability in both the single and co-doped systems. For the single and co-doped systems of Eu2+ and Eu3+, it is obvious that the co-doped systems of Eu2+ and Eu3+ present an improvement in thermal stability compared to the single systems of Eu2+ and Eu3+. We can give a reasonable explanation that under the excitation of UV light, the electrons of Ce3+ are excited to the excited states. Then, most of the electrons return to their ground states by radiative transition to obtain the characteristic emission of Ce3+ at room temperature. However, for the Ce and Eu ions co-doped system, the excited state electrons of Ce3+ likely overcome the energy barrier ΔE1 or ΔE2, transferring to the excited states of Eu2+ and Eu3+ under electron–phonon coupling; that is, Ce3+ compensates for the excited state electrons of Eu2+ and Eu3+. Therefore, the decreasing rates of the PL intensities for Eu2+ and Eu3+ in CAPS:0.03Ce, 0.005Eu are suppressed, and the trend even appears to increase.
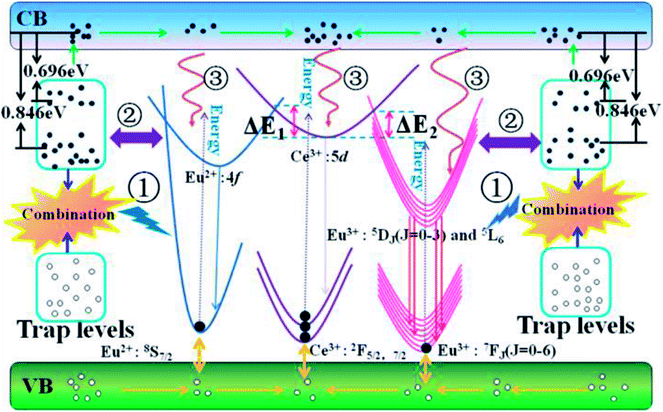 |
| | Fig. 9 The configurational coordinate diagram of the excited and ground states of the trap levels, Ce3+, Eu2+ and Eu3+. | |
The temperature-dependent luminescence properties of the typical samples imply that this material can be applied in temperature fluorescence sensors based on the luminescence intensity ratio (FIR).40,41 The histogram (I614/I339) of Eu3+/Ce3+ in CAPS:0.03Ce, 0.005Eu and the histogram (I614/I451) of Eu3+/Eu2+ in CAPS:0.03Eu are presented in Fig. 10(a) and S4(a).† Photos of typical samples are shown in Fig. 10(b) and S4(b).† It can be clearly observed that the luminescence color obviously changes with increasing temperature from 25 °C to 250 °C. According to Struck and Fonger's theory,42 the relationship between the temperature and PL intensity can be expressed as:
| |
 | (7) |
where
I0 is the PL intensity at 0 K,
A is a pre-exponential constant,
kB is the Boltzmann constant,
T is the absolute temperature, and
E is the thermal quenching activation energy. Based on
eqn (7), the FIR of Eu
3+ to Ce
3+ (
I614/
I339) and Eu
3+ to Eu
2+ (
I614/
I451) can be deduced and expressed as follows:
| |
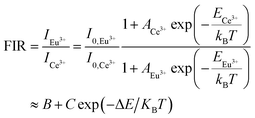 | (8) |
where
A,
B,
C and Δ
E are basic constants for specific hosts. The absolute and relative temperature sensitivities,
Sa and
Sr, can be further derived and expressed by the following equations:
| |
 | (9) |
| |
 | (10) |
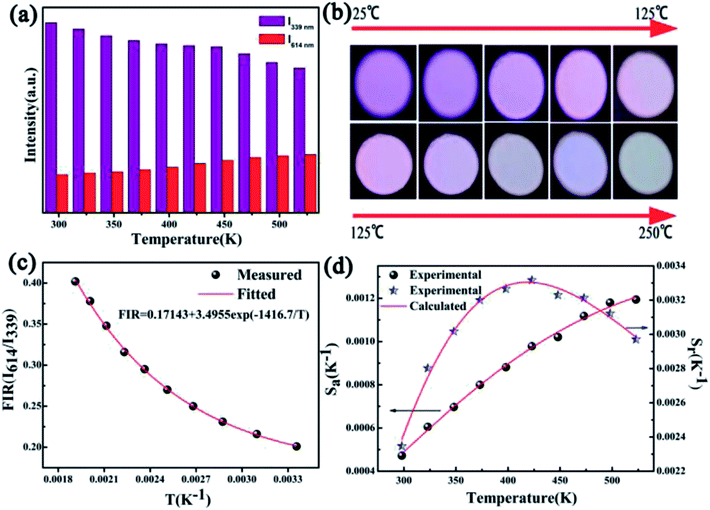 |
| | Fig. 10 (a) Histogram displaying the luminescence intensities of Eu3+ (≈614 nm) and Ce3+ (≈339 nm) at various temperatures. (b) Photos of the sample at various temperatures under UV irradiation. (c) Experimentally measured and eqn (8)-fitted plots of FIR (I614/I339) versus temperature. (d) Absolute sensitivity Sa and relative sensitivity Sr versus temperature. | |
As displayed in Fig. 10(c) and S4(c),† the measured plots of FIR versus temperature can be fitted well by eqn (8). The Sa and Sr values calculated by eqn (9) and (10) are presented in Fig. 10(d) and S4(d).† Detailed data for Sa and Sr are listed in Tables S1 and S2.† Although the CAPS:0.03Eu sample has a greater absolute temperature sensitivity Sa, in fact, Fig. 10(c) presents better monotonicity than Fig. S4(c).† The photos in Fig. 10(b) and S4(b)† also obviously show that the luminescence color becomes indistinguishable when the temperature reaches 125 °C for the sample CAPS:0.03Eu. Thus, we consider that the Ce and Eu co-doped CAPS samples have better signal discriminabilities than Eu single CAPS in a broad temperature range, which is beneficial for application in fluorescent temperature sensors.
3.4. CL properties
To more profoundly investigate the physical process of electron transition upon excitation from different sources and explore their potential application in FEDs, the CL spectral properties of CAPS:0.03Ce, xEu (0.001 ≤ x ≤ 0.07) were investigated and revealed typical emissions of Ce3+, Eu2+, and Eu3+; the results are shown in Fig. S5(a).† The CIE chromaticity diagram and coordinates for the CAPS:0.03Ce, xEu phosphors are shown in Fig. S5(b) and Table S3.† Compared with the PL spectra under excitation at 265 and 296 nm, the intensity ratio of I441/I339 of the CL spectrum for the sample CAPS:0.03Ce, 0.005Eu was greatly strengthened while the intensity ratio of I614/I339 showed no remarkable change, as shown in Fig. 11(a) and (b). From the energy level diagram in Fig. 11(d), the phenomenon can be reasonably explained as follows. For the PL spectrum, the excitation sources of 265 and 296 nm only provide energies of 3 to 4 eV, which can excite partial electrons of the energy levels of Ce3+, Eu2+, Eu3+ and the traps. Meanwhile, an electron beam can provide energies of several thousand and even tens of thousands of eV. The high-energy particles bombard the sample and bring out more secondary electrons with decreasing electron energy. Finally, a large number of electrons in the valence band will be excited to the conduction band, and some of these may excite or transfer energy to the activators and traps. Most of the excited electrons in the conduction band can move and gradually aggregate in the excited state of Ce3+ and the trap levels, as shown in Fig. 11(d). In Fig. 5, we show that the decay time of Ce3+ is on the order of nanoseconds. The electrons in the excited states of Ce3+ can transfer quickly to the ground state by radiative transition. Because the cardinal number of electrons in the excited states is large, electron saturation of the Ce3+ ground state is very likely. The redundant electrons in the Ce3+ excited state can be easily transferred to the excited states of Eu2+ and Eu3+ through ET, correspondingly increasing the Eu2+ and Eu3+ emission intensities. As we know, the decay times of Eu2+ and Eu3+ are usually on the order of microseconds and milliseconds.43 The electrons in the Eu2+ and Eu3+ ground states have enough time to return to the valence band, suppressing the occurrence of ground state saturation. Also, because the radiation rate of Eu2+ is faster than that of Eu3+, the Eu2+ emission finally presents a more obvious change than the Ce3+ and Eu3+ emissions. In addition, in the above content, we have discussed possible three paths (①, ② and ③) of trap influence on the activators. Under excitation by electron beams, the electrons in the conduction band are much more numerous than under excitation by UV light because of the extremely high energy of the excitation source. This may be the reason why the contributions of the traps in the CL spectra are relatively smaller than those in the PL spectra. Fig. 11(c) shows the Eu2+ emission band from 380 to 525 nm. Two distinct peaks at 435 and 475 nm can be observed by Gauss fitting, which is completely coincident with the PL spectrum in Fig. 3 and further indicates that Eu2+ occupies two different sites with 8- and 9-coordination. Fig. 11(d) presents the CIE chromaticity coordinates of CAPS:0.03Ce, 0.005Eu upon excitation from different sources. The degradation behaviour of CAPS:0.03Ce, 0.005Eu under a continuous fixed accelerating voltage (5 kV) and a fixed filament current (70 mA) was measured and is shown in Fig. 11(f). It is apparent that the CL intensities of three peaks (339, 441 and 614 nm) slowly decrease with increasing bombing time, which may be due to the following four reasons: (1) accumulation of graphitic carbon on the surface of the samples during continuous electron bombardment, resulting in carbon contamination, (2) accumulation of surface charges, (3) thermal quenching effects caused by the increase of the surface temperature of the sample over the long period of electron beam bombardment, (4) ground-state depletion.44–47 In our work, the sample CAPS:0.03Ce, 0.005Eu has good degradation properties. When bombarded by a persistent electron beam for 90 min, the CL intensities of Ce3+, Eu2+, and Eu3+ decreased to 67.1%, 72.3% and 71.8% of the initial values, respectively. Fig. 11(g) shows the CL intensities of the CAPS:0.03Ce, 0.005Eu sample as a function of the accelerating voltage and filament current. With increasing voltage from 1 kV to 6 kV with a fixed current at 70 mA, the electronic penetration depth increased continually; more luminescence centers will be activated and release energy, resulting in this continuous enhancement in the emission intensity. When increasing the filament current from 10 mA to 100 mA under 5 KV accelerating voltage, the same penetration layer of our sample has a larger electron density, which will also cause more luminescence centers to be activated; thus, the CL emission intensities also gradually increase and reach a maximum at 90 mA due to ground-state depletion, the thermal quenching effect and charge buildup effects. It is noteworthy that the CL intensity at variable voltage increases more rapidly than that at variable current, which implies that the influence of the penetration depth is greater than that of the electron density. In addition, the intensity ratios of both I339/I441 and I339/I614 gradually changed and stabilized with increasing accelerating voltage and filament current.
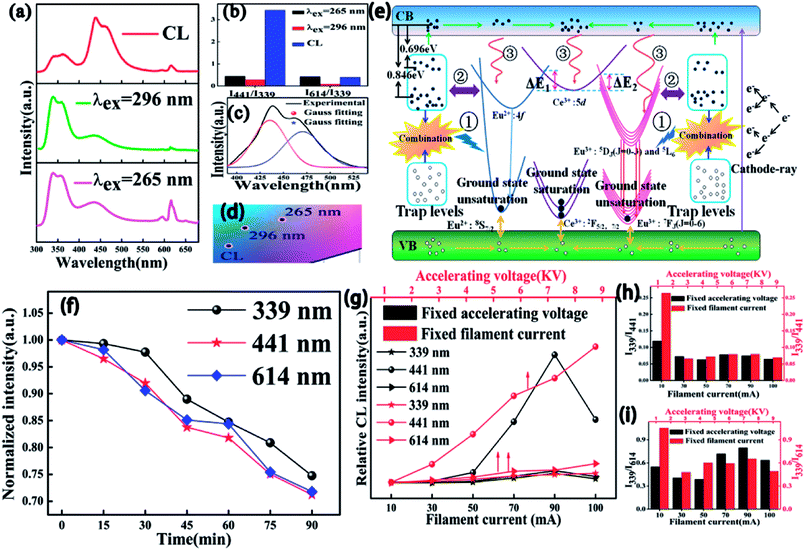 |
| | Fig. 11 (a) PL curves excited at 296 and 265 nm and CL curves at an accelerated voltage of 5 kV and a filament current of 70 mA for CAPS:0.03Ce, 0.005Eu. (b) The intensity ratios of I441/I339 and I614/I339 upon excitation from different sources. (c) The Gauss curves of the PL spectra of CAPS:0.03Ce, 0.005Eu. (d) The CIE chromaticity coordinates of CAPS:0.03Ce, 0.005Eu upon excitation from different sources. (e) Schematic energy level diagram. (f) The intensity of degradation of CAPS:0.03Ce, 0.005Eu at different times. (g) The relative CL intensities of CAPS:0.03Ce, 0.005Eu at different accelerating voltages and filament currents. (h) and (i) intensity ratios of I339/I441 and I339/I614. | |
4. Conclusion
Temperature-dependent fluorescence is a key index of rare earth ion-doped functional materials. In this work, to obtain luminous-self-healing properties, we successfully synthesized a multi-cationic site phosphosilicate phosphor, Ca8Al2P6SiO28:Ce, Eu. By XRD, PL and PLE spectra, decay times, CIE chromaticity coordinates, thermal quenching, etc., the temperature-dependent fluorescence properties and effects of traps on the emissions of the activators were investigated in detail. Under UV light excitation, Ca8Al2P6SiO28:Ce showed a broad blue-violet band due to the Ce3+ d–f transition. Meanwhile, for the Ca8Al2P6SiO28:Eu sample, Eu could not be completely reduced and was present in coexisting states of Eu2+ and Eu3+. By designing the synthesis schemes of the target materials, the energy depths and density distributions of the traps could be reasonably adjusted. Finally, we realized self-suppression of the emission loss by energy compensation from traps or ET between Ce and Eu ions in the material CAPS. With increasing temperature, for the typical single and co-doped samples, the luminescence intensities of Ce3+ at 250 °C were 81% and 76% of their initial intensities at ambient temperature, which may be due to energy compensation from traps; the luminescence intensities of Eu2+/Eu3+ at 250 °C were 10%/47% and 58%/52%, respectively, which mainly resulted from ET between Ce and Eu2+/Eu3+. This phenomenon implies that CAPS can be applied in fluorescent temperature sensors. Upon excitation by electron beams, the shapes of the emission spectra were obviously different from those of the PL spectra. Based on the CL curves at an accelerated voltage of 5 KV and a filament current of 70 mA, the degradation intensities at different times and the CL intensity ratios at different accelerating voltages and filament currents, we carefully illuminated the photo-physical mechanism of electron transition by a configurational coordinate diagram. These results can be useful in the discussion of trap energy compensation or ET effects for luminous-self-healing materials or abnormal luminescence changes with different excitation sources.
Conflicts of interest
There are no conflicts to declare.
Acknowledgements
This work was supported by the National Natural Science Funds of China (no. 51302121 and 51462031), the Natural Science Foundation of Gansu Province of China (Grant No. 1606RJYA262), the Scientific research projects of Gansu colleges and Universities (Grant No. 2017A-009), China Postdoctoral Science Foundation (Grant No. 2016M592909XB), Creation of Science and Technology of Northwest Normal University, China (Grant No. NWNU-LKQN-15-9) and the Fundamental Research Funds for the Central Universities (lzujbky-2017-sp23).
References
- J. C. Bünzli and C. Piguet, Chem. Soc. Rev., 2006, 37, 1048–1077 Search PubMed.
- K. Binnemans, Chem. Rev., 2009, 109, 4283–4374 CrossRef CAS PubMed.
- X. D. Wang, O. S. Wolfbeis and R. J. Meier, Chem. Soc. Rev., 2013, 42, 7834–7869 RSC.
- V. Bachmann, C. Ronda and A. Meijerink, Chem. Mater., 2009, 21, 2077–2084 CrossRef CAS.
- T. Wang, J. Gou and X. Xu, Opt. Express, 2015, 23, 12595–12604 CrossRef CAS PubMed.
- G. Wang, Q. Peng and Y. Li, J. Am. Chem. Soc., 2009, 131, 14200–14201 CrossRef CAS PubMed.
- J. Zhao, D. Jin, E. P. Schartner, Y. Lu, Y. Liu and A. V. Zvyagin, Nat. Nanotechnol., 2013, 8, 729–734 CrossRef CAS PubMed.
- L. Wang and Y. Li, Nano Lett., 2006, 6, 1645 CrossRef CAS PubMed.
- J. K. Cao, X. M. Li, Z. X. Wang, Y. L. Wei, L. P. Chen and H. Guo, Sens. Actuators, B, 2016, 224, 507–513 CrossRef CAS.
- J. K. Cao, D. K. Xu, F. F. Hu, X. M. Li, W. P. Chen, L. P. Chen and H. Guo, J. Eur. Ceram. Soc., 2018, 38, 2753–2758 CrossRef CAS.
- A. Pandey, V. K. Rai, V. Kumar and H. C. Swart, Sens. Actuators, B, 2015, 209, 352 CrossRef CAS.
- X. Huang, S. Han, W. Huang and X. Liu, Chem. Soc. Rev., 2013, 42, 173–201 RSC.
- J. Xu, S. Tanabe, A. D. Sontakke and J. Ueda, Appl. Phys. Lett., 2015, 107, 58674 Search PubMed.
- Y. H. Kim, P. Arunkumar and Y. K. Bo, Nat. Mater., 2017, 16, 543 CrossRef CAS PubMed.
- K. Li, D. Geng, M. Shang, Y. Zhang, H. Lian and J. Lin, J. Phys. Chem. C, 2014, 118, 11026–11034 CrossRef CAS.
- J. K. Cao, W. P. Chen, D. K. Xu, F. F. Hu, L. P. Chen and H. Guo, J. Lumin., 2018, 194, 219–224 CrossRef CAS.
- J. K. Cao, F. F. Hu, L. P. Chen, H. Guo, C. K. Duan and M. Yin, J. Am. Ceram. Soc., 2017, 100, 2108–2115 CrossRef CAS.
- P. Dorenbos, J. Phys. Condens. Matter, 2005, 17, 8103–8111 CrossRef CAS.
- Y. H. Kim, P. Arunkumar, B. Y. Kim, S. Kim, E. Unithrattil and S. H. Moon, Nat. Mater., 2017, 16, 543 CrossRef CAS PubMed.
- R. D. Shannon, Acta Crystallogr., Sect. A: Cryst. Phys., Diffr., Theor. Gen. Crystallogr., 1976, 32, 751–767 CrossRef.
- B. I. Lazoryak, T. V. Strunenkova, E. A. Vovk and V. V. Mikhailin, Mater. Res. Bull., 1996, 31, 665–671 CrossRef CAS.
- L. G. V. Uitert, J. Lumin., 1984, 29, 1–9 CrossRef.
- Z. W. Zhang, H. Zhong, S. S. Yang and X. J. Chu, J. Alloys Compd., 2017, 708, 671–677 CrossRef CAS.
- A. M. Pires, M. R. Davolos and O. L. Malta, J. Lumin., 1997, 72, 244–246 CrossRef.
- J. Yang, L. Yang, W. Liu, Y. Zhang, H. Fan and Y. Wang, J. Alloys Compd., 2008, 454, 506–509 CrossRef CAS.
- B. Piriou, M. Richard-Plouet, J. Parmentier, F. Ferey and S. Vilminot, J. Alloys Compd., 1997, 262, 450–453 CrossRef.
- M. Buijs, A. Meyerink and G. Blasse, J. Lumin., 1987, 37, 9–20 CrossRef CAS.
- C. K. Chang and T. Chen, Appl. Phys. Lett., 2007, 91, 46 Search PubMed.
- K. A. Denault, J. Brgoch, M. W. Gaultois, A. Mikhailovsky, R. Petry and H. Winkler, Chem. Mater., 2014, 26, 2275 CrossRef CAS.
- M. Li, X. Yu, X. Xu, S. Cheng, B. Zhang and J. Qiu, J. Am. Ceram. Soc., 2015, 98, 2008–2010 CrossRef CAS.
- F. Kang, Y. Zhang and M. Peng, Inorg. Chem., 2015, 54, 1462–1473 CrossRef CAS PubMed.
- Y. Su, L. Li and G. Li, J. Cheminf., 2008, 20, 6060–6067 CAS.
- M. Yu, J. Lin and J. Fang, Chem. Mater., 2005, 17, 1783–1791 CrossRef CAS.
- Z. Xia, Y. Zhang, M. S. Molokeev and V. V. Atuchin, J. Phys. Chem. C, 2013, 117, 20847–20854 CrossRef CAS.
- P. Dorenbos, J. Phys. Condens. Matter, 2005, 17, 8103–8111 CrossRef CAS.
- J. Zhou, J. Zhong, J. Guo, H. Liang, Q. Su and Q. Tang, J. Phys. Chem. C, 2016, 120, 18741–18747 CrossRef CAS.
- X. Li, X. Tang, Z. Wang, Z. Zou, J. Zhang and Z. Ci, J. Alloys Compd., 2017, 721, 512–519 CrossRef CAS.
- K. V. D. Eeckhout, A. J. J. Bos, D. Poelman and P. F. Smet, Phys. Rev. B, 2013, 87, 045126 CrossRef.
- Y. H. Kim, P. Arunkumar, B. Y. Kim, S. Unithrattil, E. Kim, S.-H. Moon, J. Y. Hyun, K. H. Kim, D. Lee, J.-S. Lee and W. B. Im, Nat. Mater., 2017, 16, 543–550 CrossRef CAS PubMed.
- T. V. Gavrilovic, D. J. Jovanovic, V. Lojpur and M. D. Dramicanin, Sci. Rep., 2014, 4, 4209 CrossRef CAS PubMed; C. W. Struck and W. H. Fonger, J. Appl. Phys., 1971, 42, 4515 CrossRef.
- A. Pandeya, V. K. Rai, V. Kumar, V. Kumar and H. C. Swart, Sens. Actuators, B, 2015, 209, 352–358 CrossRef.
- C. W. Struck and W. H. Fonger, J. Appl. Phys., 1971, 42, 4515 CrossRef CAS.
- Z. Xia, S. Miao, M. Chen, M. S. Molokeev and Q. Liu, Inorg. Chem., 2015, 54, 7684–7691 CrossRef CAS PubMed.
- F. L. Zhang, S. Yang, C. Stoffers, J. Penczek and P. N. Yocom, Appl. Phys. Lett., 1998, 72, 2226–2228 CrossRef CAS.
- M. Shang, G. Li, D. Yang, X. Kang, C. Peng, Z. Cheng and J. Lin, Dalton Trans., 2011, 40, 9379–9387 RSC.
- Q. Sun, X. Li and Y. Du, J. Am. Ceram. Soc., 2017, 100, 193–203 CrossRef CAS.
- N. Zhang, C. Guo and H. Jing, RSC Adv., 2013, 3, 7495–7502 RSC.
Footnotes |
| † Electronic supplementary information (ESI) available. See DOI: 10.1039/c8ra07566b |
| ‡ These authors contributed equally to this work. |
|
| This journal is © The Royal Society of Chemistry 2018 |
Click here to see how this site uses Cookies. View our privacy policy here.  Open Access Article
 *abc,
Lili Han
 *abc,
Haiyan Jiaoa and
Yuhua Wang
 abc
abc


![[thin space (1/6-em)]](https://www.rsc.org/images/entities/char_2009.gif) 000 cm−1 for Ce3+), V is the valence state of the active ion, n is the coordination number, ea is the electron affinity of the anion, and r is the radius of the cation (Ca2+) replaced by the active cation. The value of the parameter n was calculated to be 8 to 10. That is, the doping ion Ce3+ may replace two different eight-coordinated sites (M1, M2, M3) and one nine-coordinated site (M4), which corresponds with the XRD measurement results. Because the crystal environments of M1, M2 and M3 are very similar, the emission bands of the active ions in the three sites are difficult to distinguish. In order to simplify the analysis, we assume that the active ions in the M1, M2, and M3 sites only show emission bands. For the sample CAPS:0.03Ce3+, the emission spectrum in Fig. 2 can be readily decomposed into four separate Gaussian components centered at 340 nm (29
000 cm−1 for Ce3+), V is the valence state of the active ion, n is the coordination number, ea is the electron affinity of the anion, and r is the radius of the cation (Ca2+) replaced by the active cation. The value of the parameter n was calculated to be 8 to 10. That is, the doping ion Ce3+ may replace two different eight-coordinated sites (M1, M2, M3) and one nine-coordinated site (M4), which corresponds with the XRD measurement results. Because the crystal environments of M1, M2 and M3 are very similar, the emission bands of the active ions in the three sites are difficult to distinguish. In order to simplify the analysis, we assume that the active ions in the M1, M2, and M3 sites only show emission bands. For the sample CAPS:0.03Ce3+, the emission spectrum in Fig. 2 can be readily decomposed into four separate Gaussian components centered at 340 nm (29![[thin space (1/6-em)]](https://www.rsc.org/images/entities/char_2009.gif) 412 cm−1), 365 nm (27
412 cm−1), 365 nm (27![[thin space (1/6-em)]](https://www.rsc.org/images/entities/char_2009.gif) 392 cm−1), 359 nm (27
392 cm−1), 359 nm (27![[thin space (1/6-em)]](https://www.rsc.org/images/entities/char_2009.gif) 855 cm−1) and 390 nm (25
855 cm−1) and 390 nm (25![[thin space (1/6-em)]](https://www.rsc.org/images/entities/char_2009.gif) 641 cm−1) by the Gauss curve fitting. The energy difference ΔE1 between 340 and 365 nm is 2020 cm−1 and ΔE2 between 359 and 390 nm is 2214 cm−1, which is very close to the usual energy difference between the Ce3+ 2FJ (J = 7/2, 5/2) states.23 From eqn (1), we can see that the larger the value of n × r, the higher the value of E. Thus, the fitting peaks at 340 and 365 nm and 359 and 390 nm can be attributed to the nine- and eight-coordinated sites, respectively. In addition, the inset of Fig. 2 shows the curve of concentration quenching of Ce3+ and the optimal emission intensity located at x = 0.03.
641 cm−1) by the Gauss curve fitting. The energy difference ΔE1 between 340 and 365 nm is 2020 cm−1 and ΔE2 between 359 and 390 nm is 2214 cm−1, which is very close to the usual energy difference between the Ce3+ 2FJ (J = 7/2, 5/2) states.23 From eqn (1), we can see that the larger the value of n × r, the higher the value of E. Thus, the fitting peaks at 340 and 365 nm and 359 and 390 nm can be attributed to the nine- and eight-coordinated sites, respectively. In addition, the inset of Fig. 2 shows the curve of concentration quenching of Ce3+ and the optimal emission intensity located at x = 0.03.

![[thin space (1/6-em)]](https://www.rsc.org/images/entities/char_2009.gif) exp(−t/τ1) + A2
exp(−t/τ1) + A2![[thin space (1/6-em)]](https://www.rsc.org/images/entities/char_2009.gif) exp(−t/τ2)
exp(−t/τ2)


