 Open Access Article
Rare earth complexes using azobenzene-containing poly(aryl ether)s with different absorption wavelengths as macromolecular ligands: synthesis, characterization, fluorescence properties and fabrication of fluorescent holographic micropatterns
Yuxuan Zhanga and
Shanyong Chen *b
*b
aCollege of Chemistry, Liaoning University, Shenyang, 110036, China
bResearch Institute for New Materials Technology, Chongqing University of Arts and Sciences, Yongchuan 402160, China
First published on 6th November 2018
Abstract
In this paper, two novel azobenzene-containing poly(aryl ether)s with different absorption wavelengths were synthesized via Ullmann coupling and Sonogashira coupling, respectively. The obtained polymers were characterized and evaluated by elemental analysis, IR, 1H NMR, UV-vis, DSC and TGA. Rare earth complexes were prepared by using the two novel azobenzene-containing poly(aryl ether)s as macromolecular ligands. The obtained rare earth complexes were characterized by elemental analysis, IR and WAXD. The influence of the absorption wavelength of azobenzene chromophores on the fluorescent properties was investigated. The polymer whose absorption wavelength was far from the excitation wavelengths of the rare earth complexes showed a much larger fluorescence intensity. By exposing the films of the rare earth complexes to two interference laser beams, SRGs can be formed on the films and can also be detected by fluorescence microscopy measurement.
1. Introduction
Azobenzene-containing polymers (azo-polymers) have attracted much attention due to their potential application in optical data storage, photochemical switches, photodeformation materials and nonlinear optical materials.1–8 One of the attractive phenomena is that surface relief gratings (SRGs) can be formed directly on the films of azo-polymers by exposing the films to two interfering laser beams due to the reversible photoisomerization and photoinduced anisotropy of the azobenzene groups.9,10 The SRGs are stable below the glass transition temperatures (Tgs) of the polymers and can be removed by heating the polymers above their Tgs or can be erased optically. Therefore, introducing azobenzene chromophores into some high-Tg aromatic polymers, such as polyimides and poly(aryl ether)s, can improve the storage stability of SRGs based on the azobenzene-containing polymers.11–15In recent years, a facile method for fabricating fluorescent and rewritable micropatterns by the combination of the holographic technique and fluorescence technique was demonstrated.16–18 The method could be realized through the combination of fluorescent materials and azobenzene-containing materials. The studies provided a convenient method to fabricate patterned organic light-emitting devices and opened up a new way of recording and detecting optical information. In our previous work, a series of novel materials for fabricating fluorescent holographic micropatterns based on the rare earth coordination of poly(aryl ether)s with different azobenzene chromophores contents was demonstrated.19 With the introduction of azobenzene chromophores and the increase of azobenzene chromophore content, the fluorescence intensity of the rare earth complexes decreased dramatically. The reason is that the excitation wavelengths of the rare earth complexes overlapped with the absorption wavelength of the azobenzene chromophores, and the fluorescence intensity of the rare earth complexes was weakened by the azobenzene chromophores. To essentially prevent such energy competition between azobenzene chromophores and rare earth complexes, the structure of the azobenzene chromophores should be carefully designed to make the absorption wavelengths of the azobenzene chromophores far away from the excitation wavelengths of the rare earth complexes.
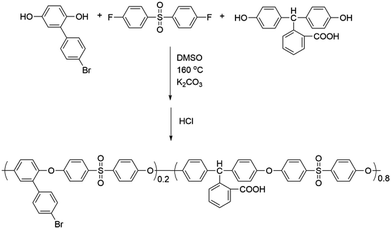
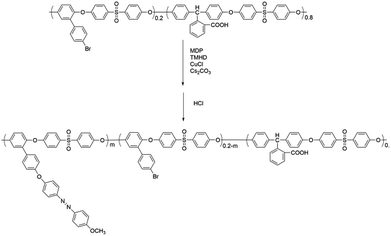
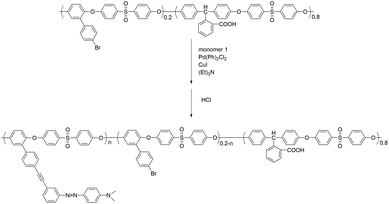
In this work, novel poly(aryl ether)s with carboxyl side groups and bromine side groups (Br-CPAE) were synthesized. Based on the novel polymer Br-CPAE, a novel azobenzene-containing poly(aryl ether) whose absorption wavelength was far away from the excitation wavelengths of rare earth complexes was synthesized via Sonogashira coupling. For comparison, a novel azobenzene-containing poly(aryl ether) whose absorption wavelength overlapped with the excitation wavelengths of rare earth complexes was also synthesized via Ullmann coupling. The rare earth complexes were prepared by using the three novel poly(aryl ether)s as macromolecular ligands. The influence of the absorption wavelength of azobenzene chromophores on the fluorescent properties was investigated. By exposing the films of the rare earth complexes to two interference laser beams, SRGs could be formed on the films. Under the excitation, red fluorescent patterns of the SRGs could be detected by fluorescence microscopy measurement.
2. Materials
2.1. Materials
4-Fluorophenyl sulfone, Ce2CO3, CuCl, CuI, triethylamine, 3-ethynylaniline and N,N-dimethylaniline were purchased from Aladdin. Phenolphthalin was purchased from TCI. 2,2,6,6-Tetramethyl-3,5-heptanedione (TMHD) was purchased from Aldrich. 2-(4-Bromophenyl)hydroquinone and 4-((4-methoxyphenyl)diazenyl)phenol (MDP) were synthesized according to the literature,20,21 respectively. All of the other reagents were purchased from commercial sources.2.2. Measurements
1H NMR spectra were recorded on a Mercury-Vx300-NMR instrument using DMSO-d6 as the solvent. UV-visible absorption spectra were recorded on a PerkinElmer Lambda 35 UV-vis spectrophotometer at room temperature. Elemental analysis was conducted on a Perkin-Elmer 2400 Elemental analyser. The elemental analysis of the content of Eu3+ was conducted using an Optima 3300DV inductively coupled plasma system. FT-IR spectra (KBr pellet) were recorded on a Perkin Elmer Spectrum One FT-IR spectrophotometer. Gel permeation chromatography was carried out using a Waters 410 instrument with polystyrene as the calibration standard. Wide-angle X-ray diffraction (WAXD) measurements were carried out on a Shimadzu XRD-7000 X-ray diffractometer with a Cu Kα radiation source. The powder sample was multiplied to increase the intensity in the 2θ range of 5–60°. Glass transition temperatures (Tgs) were determined by a TA DSC-Q100 instrument under nitrogen atmosphere at a heating rate of 10 °C min−1. Thermo-gravimetric analysis was performed on a TA SDT-Q600 TGA analyser under nitrogen atmosphere at a heating rate of 10 °C min−1. The fluorescence emission spectra of rare earth complexes were measured on an Edinburgh FS900 fluorescence spectrophotometer.The experimental setups for SRGs formation have been described by our groups previously,14 and only several details are given here. The SRGs were optically inscribed on the spin-coated films with two interfering laser beams. Polarized Nd:YAG nanosecond pulsed 355 nm laser beams with a pulse duration of 10 ns were utilized as the recording light source. The surface topology of the SRG films was observed using a Nanoscope atomic force microscope (AFM) in tapping mode. The fluorescence microscopy images of the SRGs were obtained on an Olympus BX51 Reflected Fluorescence System.
2.3. Synthesis
To compare with the rare earth coordination polymer, a small molecule rare earth complex Eu3+–Phen was synthesized as follows: 1,10-phenanthroline (0.006 mol) was dissolved in 6 mL of dried DMF. Then, a solution of Eu(NO3)3 (0.002 mol) in 6 mL of dried DMF was added. The mixture was stirred for 3 h. After being slowly poured into 50 mL of ethanol, the precipitate was collected and washed with ethanol several times. The product was dried at 80 °C under vacuum for 24 h.
![[thin space (1/6-em)]](https://www.rsc.org/images/entities/char_2009.gif) :
:![[thin space (1/6-em)]](https://www.rsc.org/images/entities/char_2009.gif) 0.8
0.8![[thin space (1/6-em)]](https://www.rsc.org/images/entities/char_2009.gif) :
:![[thin space (1/6-em)]](https://www.rsc.org/images/entities/char_2009.gif) 2.4, which were dissolved in dried DMF (10 wt%). After stirring for 2 h, the solution was filtered through 0.45 μm syringe filter membranes. To fabricate SRGs, films were obtained via spin-coating the solution onto clean glass substrates. The thickness was controlled to be approximately 1.0 μm by adjusting the spinning rate. After drying under vacuum for 48 h to drive off the residual solvent, the films were obtained.
2.4, which were dissolved in dried DMF (10 wt%). After stirring for 2 h, the solution was filtered through 0.45 μm syringe filter membranes. To fabricate SRGs, films were obtained via spin-coating the solution onto clean glass substrates. The thickness was controlled to be approximately 1.0 μm by adjusting the spinning rate. After drying under vacuum for 48 h to drive off the residual solvent, the films were obtained.3. Results and discussion
3.1. Synthesis and characterization
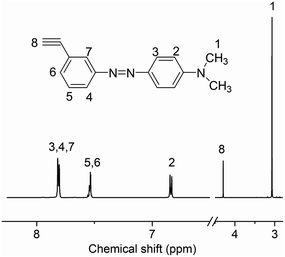
We designed a new monomer containing the azobenzene group and the synthetic route of the monomer is illustrated in Scheme 1. The structure of monomer 1 was confirmed by 1H NMR, as shown in Fig. 1. All of the signals are in good agreement with the expected structure.Two novel azobenzene-containing poly(aryl ether)s (Azo-CPAE-1 and Azo-CPAE-2) with different absorption wavelengths were synthesized via Ullmann coupling and Sonogashira coupling, respectively. From Table 1, it could be seen that all the polymers had number average molecular weights above 1 × 10⁴ g mol−1. Due to the high alkalinity of Cs2CO3, Cs2CO3 could degrade the main chain of Br-CPAE. Thus the Mn of Azo-CPAE-1 was lower than that of Br-CPAE. All the polymers showed good solubility in common organic solvents such as tetrahydrofuran, dimethylacetamide, N,N-dimethylformamide, N-methyl-2-pyrrolidone and cyclohexanone.
| Polymer | Grafting ratio% | Mn | Mw/Mn |
|---|---|---|---|
| Br-CPAE | 0 | 1.1 × 10⁴ | 1.81 |
| Azo-CPAE-1 | 87 | 1.0 × 10⁴ | 2.12 |
| Azo-CPAE-2 | 93 | 1.2 × 10⁴ | 1.94 |
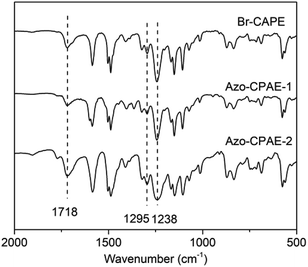
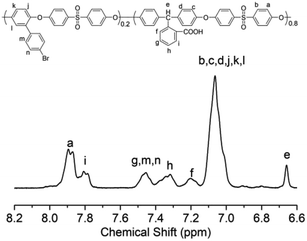
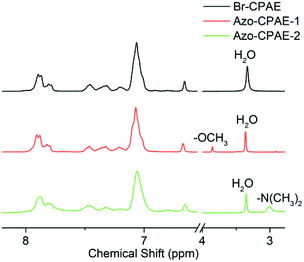
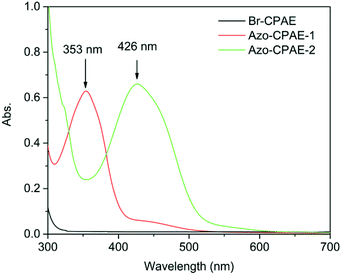
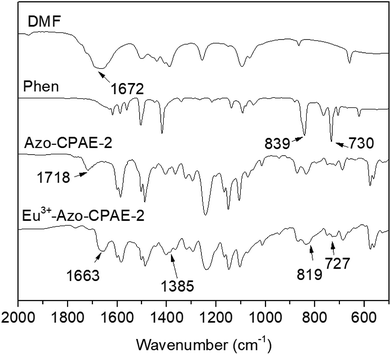
The chemical structures of the polymers were confirmed by elemental analysis, IR, 1H NMR and UV-vis spectra. As shown in Table 2, on the basis of elemental analysis, the molar percentage of azobenzene chromophores in Azo-CPAE-1 and Azo-CPAE-2 could be calculated. If all of the aryl bromide reacted, it represented a 100% grafting ratio. The grafting ratios of Azo-CPAE-1 and Azo-CPAE-2 were 93% and 87%, respectively. The IR spectra of the polymers are shown in Fig. 2. It could be observed that the IR spectra of the polymers showed characteristic absorption bands of carboxyl groups at 1718 cm−1, sulfone groups at 1295 cm−1 and aryl ether groups at 1238 cm −1, indicating that the polymers were successfully prepared. Fig. 3 shows the typical 1H NMR spectra of Br-CPAE in DMSO-d6. All of the signals are in good agreement with the expected structure. Fig. 4 shows the typical 1H NMR spectra of all the polymers in DMSO-d6. Compared with the 1H NMR spectra of Br-CPAE, the 1H NMR spectra of Azo-CPAE-1 showed new peaks at approximately 3.85 ppm corresponding to the chemical shift of hydrogen in the –OCH3 group. Similarly, compared with the 1H NMR spectra of Br-CPAE, the 1H NMR spectra of Azo-CPAE-2 showed new peaks at approximately 3.01 ppm corresponding to the chemical shift of hydrogen in the –N(CH3)2 groups. The UV-vis spectra of the polymers in DMF solution are shown in Fig. 5. The characteristic absorption bands at approximately 353 nm and 426 nm could be observed in the spectra of Azo-CPAE-1 and Azo-CPAE-2, respectively, corresponding to π–π* transitions resulting from the intramolecular charge transfer of the azobenzene chromophores.23 Due to the larger conjugate length, the absorption wavelength of azobenzene chromophores in Azo-CPAE-2 was larger than the absorption wavelength of azobenzene chromophores in Azo-CPAE-1.
| Polymer | C | H | N |
|---|---|---|---|
| Br-CPAE | 69.68 | 3.95 | |
| Azo-CPAE-1 | 71.43 | 4.13 | 0.89 |
| Azo-CPAE-2 | 72.25 | 4.23 | 1.41 |
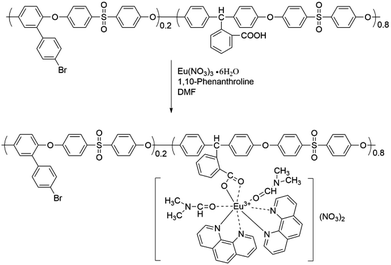
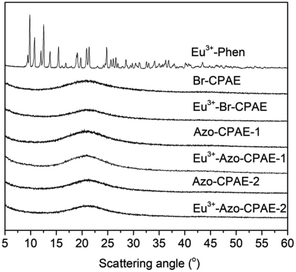
The chemical structures of the rare earth coordination polymers could be confirmed by IR, WAXD and elemental analysis. For example, Fig. 6 presents the comparison of the IR spectra of DMF, Phen, Azo-CPAE-2 and the coordination polymer Eu3+-Azo-CPAE-2. From the IR spectra of DMF and Eu3+-Azo-CPAE-2, it was found that the peak at 1672 cm−1 corresponding to the carbonyl groups of DMF was absent in the IR spectrum of Eu3+-Azo-CPAE-2. Alternatively, a new peak at 1663 cm−1 could be observed in the IR spectrum of Eu3+-Azo-CPAE-2, which demonstrated that there was some interaction between the carbonyl groups of DMF and Eu3+ ion, suggesting that the solvent DMF was also involved in the coordination with Eu3+ ion. From the comparison of the IR spectra of Phen and Eu3+-Azo-CPAE-2, it was revealed that the bent vibrations of Phen at 839 cm−1 and 730 cm−1 were redshifted to 819 cm−1 and 727 cm−1, respectively, indicating the formation of coordination bonds between Eu3+ ion and the nitrogen atom of Phen. Moreover, from the comparison of the IR spectra of Azo-CPAE-2 and Eu3+-Azo-CPAE-2, it was found that the peak at 1718 cm−1 corresponding to carboxyl groups was absent in the IR spectrum of Eu3+-Azo-CPAE-2. Alternatively, the characteristic absorption bond corresponding to the symmetric stretching vibration of COO− at 1385 cm−1 could be observed in the IR spectrum of Eu3+-Azo-CPAE-2. Accordingly, it could be included that all of Azo-CPAE-2, DMF and Phen participated in the coordination reaction with Eu3+ ions. The chemical structures of other rare earth coordination polymers could also be confirmed by IR. The WAXD patterns of Eu3+–Phen, polymers and rare earth coordination polymers are illustrated in Fig. 7. The WAXD patterns of the polymers displayed an amorphous characteristic, and Eu3+–Phen showed strong diffraction peaks, indicating a crystal lattice structure. However, the WAXD pattern of the rare earth coordination polymers only showed an amorphous structure, which indicated that the rare earth ions were not simply doped into the polymers but coordinated with the carboxyl groups in the side chain of the polymers, leading to a homogeneous distribution of rare earth ions within the polymer host. The WAXD finding was well consistent with the IR analysis results. As demonstrated in other similar polymer systems,22,24,25 the rare earth coordination polymer might own a stable eight-fold coordination structure. The possible molecular formula of the rare earth coordination polymer is depicted in Scheme 5, which could also be confirmed by elemental analysis. As shown in Table 3, the measured values of C, H, N and Eu3+ agreed well with the calculated values.
| Complexes | Element | Found | Calculated |
|---|---|---|---|
| Eu3+-Br-CPAE | C | 63.34 | 62.19 |
| H | 4.07 | 4.21 | |
| N | 6.53 | 6.40 | |
| Eu3+ | 11.25 | 11.66 | |
| Eu3+-Azo-CPAE-1 | C | 65.01 | 63.24 |
| H | 4.13 | 4.29 | |
| N | 6.27 | 6.70 | |
| Eu3+ | 11.53 | 11.37 | |
| Eu3+-Azo-CPAE-2 | C | 64.72 | 63.70 |
| H | 4.27 | 4.34 | |
| N | 7.05 | 6.94 | |
| Eu3+ | 10.98 | 11.32 |
3.2. Thermal properties of the polymers
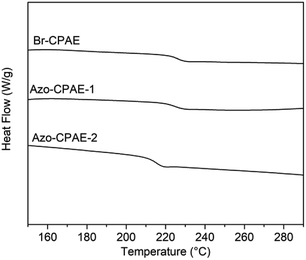
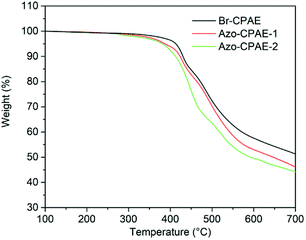
DSC and TGA measurements were carried out to investigate the thermal properties of the polymers. Fig. 8 shows the DSC curves of the polymers and the experiment data are listed in Table 4. All the polymers showed glass transition temperatures above 218 °C, indicating their high glass transition temperatures. The TGA curves and data of the polymers under nitrogen are shown in Fig. 9 and Table 3, respectively. The temperatures at 5% weight loss (Td5) of the polymers were all above 381 °C, indicating their excellent thermal stability. Because the thermal stability of azobenzene chromophores was weaker than the thermal stability of the main chain of Br-CPAE, the temperatures at 5% weight loss of Azo-CPAE-1 and Azo-CPAE-2 were lower than that of Br-CPAE.| Polymer | Tga (°C) | Td5b (°C) | Td10c (°C) |
|---|---|---|---|
| a Glass transition temperature by DSC.b 5% weight-loss temperatures were detected at a heating rate of 10 °C min−1 in nitrogen.c 10% weight-loss temperatures were detected at a heating rate of 10 °C min−1 in nitrogen. | |||
| Br-CPAE | 231 | 413 | 430 |
| Azo-CPAE-1 | 227 | 387 | 423 |
| Azo-CPAE-2 | 218 | 381 | 412 |
3.3. Analysis of fluorescence properties
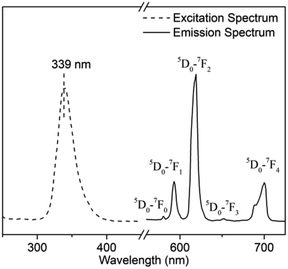
The excitation and emission spectra of Eu3+-Br-CPAE are shown in Fig. 10. The excitation spectrum of Eu3+-Br-CPAE was obtained by monitoring the emission wavelength at 619 nm. The strongest excitation peak corresponding to Eu3+-Br-CPAE appeared at 339 nm. The emission spectrum of Eu3+-Br-CPAE exhibited the characteristic emission of Eu3+ ion under the excitation at 339 nm. The emission peaks at 580 nm, 593 nm, 619 nm, 651 nm and 700 nm were assigned to the characteristic emission 5D0–7FJ (J = 0, 1, 2, 3, 4) transitions of Eu3+ ion, respectively.3.4. The influence of absorption wavelength of azobenzene chromophores on the fluorescence properties
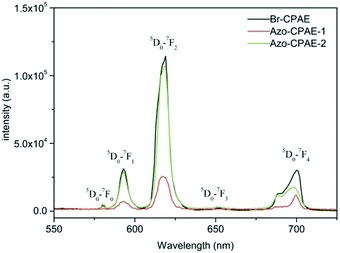
Fig. 11 shows the fluorescence spectra of the rare earth coordination polymers in DMF with the same concentration. All the rare earth coordination polymers were prepared from polymers, Eu3+ ion and Phen at a molar ratio of 1![[thin space (1/6-em)]](https://www.rsc.org/images/entities/char_2009.gif) :
:![[thin space (1/6-em)]](https://www.rsc.org/images/entities/char_2009.gif) 0.8
0.8![[thin space (1/6-em)]](https://www.rsc.org/images/entities/char_2009.gif) :
:![[thin space (1/6-em)]](https://www.rsc.org/images/entities/char_2009.gif) 2.4. It could be observed that the fluorescent intensity of Eu3+-Azo-CPAE-2 was much larger than that of Eu3+-Azo-CPAE-1, which was close to the fluorescent intensity of Eu3+-Br-CPAE. The phenomenon could be interpreted as follows. The excitation wavelengths of Eu3+ ion overlapped with the absorption wavelength of azobenzene chromophores in Eu3+-Azo-CPAE-1, so the excitation light of rare earth complexes would be absorbed by the azobenzene chromophores, which induced the energy competition between azobenzene chromophores and Eu3+ ion.26,27 On the other hand, the absorption wavelength of azobenzene chromophores in Eu3+-Azo-CPAE-2 was far away from the excitation wavelengths of Eu3+ ion, so the luminescent efficiency of the rare earth complexes would not be reduced significantly.
2.4. It could be observed that the fluorescent intensity of Eu3+-Azo-CPAE-2 was much larger than that of Eu3+-Azo-CPAE-1, which was close to the fluorescent intensity of Eu3+-Br-CPAE. The phenomenon could be interpreted as follows. The excitation wavelengths of Eu3+ ion overlapped with the absorption wavelength of azobenzene chromophores in Eu3+-Azo-CPAE-1, so the excitation light of rare earth complexes would be absorbed by the azobenzene chromophores, which induced the energy competition between azobenzene chromophores and Eu3+ ion.26,27 On the other hand, the absorption wavelength of azobenzene chromophores in Eu3+-Azo-CPAE-2 was far away from the excitation wavelengths of Eu3+ ion, so the luminescent efficiency of the rare earth complexes would not be reduced significantly.
3.5. Photoinduced surface-relief-gratings of Eu3+-Azo-CPAE-2
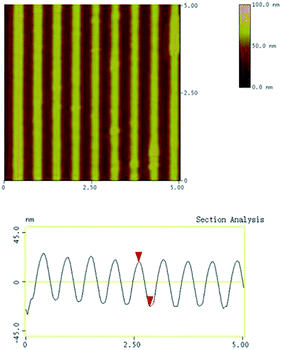
Based on the results of the fluorescence properties of the rare earth coordination polymers, Eu3+-Azo-CPAE-2 was a much better material than Eu3+-Azo-CPAE-1 to prepare fluorescent holographic micropatterns. To fabricate SRGs, the film of Eu3+-Azo-CPAE-2 was exposed to two polarized interfering laser beams for 30 s, and SRGs were rapidly formed on the films. Fig. 12 shows a typical AFM plane image of the SRGs formed on the Eu3+-Azo-CPAE-2 film. AFM section analysis revealed that the modulation depth and the grating spacing of the SRGs of Eu3+-Azo-CPAE-2 were 40 nm and 256 nm, respectively. Compared to the other SRGs we reported before,19 the modulation depth of the SRGs was shallower under similar experimental conditions, due to that the absorption bands of Azo-CPAE-2 did not match the wavelength of the laser beams (355 nm) well. However, the modulation depth could be adjusted by the irradiation time and the irradiation energy, and the grating spacing could be controlled by adjusting the angle between the two interfering beams.1 Fig. 13 presents the fluorescence microscopy image of SRGs on the Eu3+-Azo-CPAE-2 film. Under the excitation, the regular patterning obtained on the Eu3+-Azo-CPAE-2 film exhibited red light.4. Conclusions
In this work, two novel azobenzene-containing poly(aryl ether)s with different absorption wavelengths were synthesized via Ullmann coupling and Sonogashira coupling, respectively. Their structures were characterized by IR, 1H NMR and UV-vis. These polymers exhibited a high glass transition temperature (Tg > 218 °C) and good thermal stability (Td5 > 381 °C). Rare earth complexes were prepared by using the two novel azobenzene-containing poly(aryl ether)s as macromolecular ligands. The rare earth complexes based on Azo-CPAE-2 whose absorption wavelength was far from the excitation wavelengths of the rare earth complexes showed a much larger fluorescence intensity than the rare earth complexes based on Azo-CPAE-1. By exposing the film of the rare earth complexes based on Azo-CPAE-2 to two interference laser beams, SRGs can be formed on the film and can be detected by fluorescence microscopy measurement.Conflicts of interest
There are no conflicts to declare.Acknowledgements
The authors gratefully acknowledge the Liaoning Province Doctor Startup Fund (Grant No. 201501130) and the National Natural Science Foundation of China (Grant No. 51703089) for financial support.References
- A. Natansohn and P. Rochon, Chem. Rev., 2002, 102, 4139–4175 CrossRef CAS PubMed.
- A. S. Matharu, S. Jeeva, P. R. Huddleston and P. S. Ramanujam, J. Mater. Chem., 2007, 17, 4477–4482 RSC.
- C. Appiah, K. R. Siefermann, M. Jorewitz, H. Barqawi and W. H. Binder, RSC Adv., 2016, 6, 6358–6367 RSC.
- T. Ikeda, J. I. Mamiya and Y. Yu, Angew. Chem., Int. Ed., 2007, 46, 506–528 CrossRef CAS PubMed.
- Y. L. Yu, M. Nakano and T. Ikeda, Nature, 2003, 425, 145 CrossRef CAS PubMed.
- H. Y. Wen, W. D. Zhang, Y. Y. Wengm and Z. J. Hu, RSC Adv., 2014, 4, 11776–11781 RSC.
- N. J. Li, J. M. Lu, H. Li and E. T. Kang, Dyes Pigm., 2011, 80, 18–24 CrossRef.
- X. B. Chen, J. J. Zhang, H. B. Zhang, Z. H. Jiang ZH, G. Shi and Y. L. Song, Dyes Pigm., 2008, 77, 223–228 CrossRef CAS.
- P. Rochon, E. Batalla and A. Natansohn, Appl. Phys. Lett., 1995, 66, 136–138 CrossRef CAS.
- D. Y. Kim, S. K. Tripathy, L. Li and J. Kumar, Appl. Phys. Lett., 1995, 66, 1166–1168 CrossRef CAS.
- I. Sava, A. Burescu, I. Stoica, V. Musteata, M. Cristea, I. Mihaila, V. Pohoata and I. Topala, RSC Adv., 2015, 5, 10125–10133 RSC.
- J. J. Zhang, H. B. Zhang, X. B. Chen, J. H. Pang, Y. X. Zhang, Y. P. Wang, Q. D. Chen, S. H. Pei, W. X. Peng and Z. H. Jiang, React. Funct. Polym., 2011, 71, 553–560 CrossRef CAS.
- Y. X. Zhang, S. H. Pei, Y. P. Wang, Z. D. Cui, N. Li, Y. Zhu, H. B. Zhang and Z. H. Jiang, Dyes Pigm., 2013, 99, 1117–1123 CrossRef CAS.
- X. B. Chen, Y. H. Zhang, B. J. Liu, J. J. Zhang, H. Wang, W. Y. Zhang, Q. D. Chen, S. H. Pei and Z. H. Jiang, J. Mater. Chem., 2008, 18, 5019–5026 RSC.
- J. J. Zhang, H. B. Zhang, X. B. Chen, Y. H. Zhang, X. F. Li, Q. D. Chen and Z. H. Jiang, Mater. Lett., 2010, 64, 337–340 CrossRef CAS.
- E. Ishow, A. Brosseau, G. Clavier, K. Nakatani, R. Pansu, J. J. Vachon, P. Tauc, D. Chauvat, C. Mendonca and E. Piovesan, J. Am. Chem. Soc., 2007, 129, 8970–8971 CrossRef CAS PubMed.
- L. H. Liu, K. Nakatani, R. Pansu, J. J. Vachon, P. Tauc and E. Ishow, Adv. Mater., 2007, 19, 433–436 CrossRef CAS.
- X. B. Chen, B. J. Liu, H. B. Zhan, S. W. Guan, J. J. Zhang, Z. H. Jiang and M. D. Guiver, Langmuir, 2009, 25, 10444–10446 CrossRef CAS PubMed.
- Y. X. Zhang, J. J. Zhang, Z. D. Cui, Q. D. Chen, H. B. Zhang and Z. H. Jiang, J. Polym. Sci., Part A: Polym. Chem., 2015, 53, 936–943 CrossRef CAS.
- S. F. Xiao, X. M. Lu, A. H. Lu and B. Su, Macromolecules, 2008, 41, 3884–3892 CrossRef CAS.
- X. Y. Ma, Z. H. Lv, D. Wang, S. W. Guan, C. H. Chen, G. B. Wang, D. M. Zhang and Z. H. Jian, J. Photochem. Photobiol., A, 2007, 188, 43–50 CrossRef CAS.
- D. Liu and Z. G. Wang, Polymer, 2008, 49, 4960–4967 CrossRef CAS.
- H. M. D. Bandara and S. C. Burdette, Chem. Soc. Rev., 2012, 41, 1809–1825 RSC.
- J. Z. Jiang, Y. Z. Bian, F. Furuya, W. Liu, M. T. M. Choi and N. Kobayashi, Chem.–Eur. J., 2001, 7, 5059–5069 CrossRef CAS.
- D. Liu, H. Yu, Z. G. Wang and Q. P. Nie, Polym. Int., 2010, 59, 937–944 CrossRef CAS.
- D. Wang, J. Y. Zhang, H. Ming, Q. Yan, Q. J. Zhang, P. Wang, J. Yang and Z. Q. Zheng, Chin. Phys. Lett., 2004, 21, 2445–2447 CrossRef CAS.
- Q. Yan, S. Wu, Y. L. Chen, Y. H. Luo and Q. J. Zhang, Spectrochim. Acta, Part A, 2009, 71, 1644–1647 CrossRef PubMed.
| This journal is © The Royal Society of Chemistry 2018 |


