DOI:
10.1039/C8RA07482H
(Paper)
RSC Adv., 2018,
8, 37200-37207
Visible-light-driven Ag/Bi3O4Cl nanocomposite photocatalyst with enhanced photocatalytic activity for degradation of tetracycline
Received
7th September 2018
, Accepted 17th October 2018
First published on 5th November 2018
Abstract
In this study, a novel Ag/Bi3O4Cl photocatalyst has been synthesized by a facile photodeposition process. Its photocatalytic performance was evaluated from the degradation of tetracycline (TC) under visible light irradiation (λ > 420 nm). The 1.0 wt% Ag/Bi3O4Cl photocatalyst could significantly enhance the degradation of TC compared with pure Bi3O4Cl, with the degradation level reaching 94.2% in 120 minutes. The enhancement of photocatalytic activity could be attributed to the synergetic effect of the photogenerated electrons (e−) of Bi3O4Cl and the surface plasmon resonance (SPR) caused by Ag nanoparticles, which could improve the absorption capacity of visible light and facilitate the separation of photogenerated electron–hole pairs. In addition, electron spin resonance (ESR) analysis and trapping experiments demonstrated that the superoxide radicals (˙O2−), hydroxyl radicals (˙OH) and holes (h+) played crucial roles in the photocatalytic process of TC degradation. The present work provides a promising approach for the development of highly efficient photocatalysts to address current environmental pollution, energy issues and other related areas.
1. Introduction
Antibiotics, as one of the most significant medicines, have been immoderately applied in our lives in agriculture, medicine and planting, and are frequently detected in a wide range of environmental samples, including treated wastewater and even drinking water.1–4 Furthermore, the very low concentration of antibiotic solutions might lead to the appearance of drug resistance among pathogenic microbes, and even generate multiple-resistances in human beings. The abuse of tetracycline (TC) is particularly serious.5–8 Moreover, the elimination of TC cannot be achieved by the natural environment itself or by sewage treatment plants.9,10 Therefore, exploring an effective method for eliminating TC from sewage has become an exigency. Recently, several approaches have been explored for the removal of TC from our environment, such as electrochemistry, precipitation, adsorption and photocatalysis. Among these, photocatalysis has been proven to be a promising environmentally-friendly technology for removing TC from the sewage because it can take advantage of green and sustainable solar energy, it is non-poisonous, and photocatalysts can have stable properties. So far, research into the degradation of TC by TiO2,11 CdS,12 SrTiO3 (ref. 13) and Ag2O (ref. 14) photocatalysts has been instigated by several researchers. However, the practical applications of these materials are limited due to the rapid recombination rates of the electron–hole pairs, poor stability, and the low use efficiency of solar energy. Therefore, it is imperative to overcome the above shortcomings and explore novel photocatalysts which offer high degradation efficiencies for TC under visible light irradiation.
Nowadays, bismuth oxyhalides (BiOX, X = Cl, Br, and I) as a class of layered semiconductor materials have become prevalent as photocatalysts on account of their unique and excellent electrical properties, suitable energy band positions and high-efficiency photocatalytic activities.15–18 In particular, Bi3O4Cl has a layered Sillén-Aurivillius-related oxide structure consisting of [Bi3O4] layers sandwiched between two slabs of [Cl] ions in an extraordinarily open crystalline structure.19,20 On account of the distinctive crystalline structure, there is a self-built internal static electric field to facilitate the separation and transportation of photogenerated electrons and holes to improve the photocatalytic performance.21 However, unfortunately, the use of Bi3O4Cl is constrained by its weak visible light absorption and low rate of charge transfer when applied in practice. Therefore, it is important to improve the photocatalytic performance of the single Bi3O4Cl photocatalyst.
Recently, noble metals such as Au, Pt and Ag have captured considerable attention due to their splendid conductivity and capacity for trapping electrons. In particular, Ag is fairly cheap and exhibits intense local electromagnetic fields caused by surface plasmon resonance (SPR), which can expedite the separation of electron–hole pairs within a semiconductor and improve the absorption of visible light.22–24 In recent years, Luo's team has reported that the Ag/Bi3TaO7 plasmonic photocatalyst exhibited a more excellent photocatalytic performance than pure Bi3TaO7 for the degradation of TC under visible light, which was due to the SPR which facilitated the efficient separation of photogenerated electron–hole pairs and enhanced the absorption of visible light.25 To date, however, there has been no work reported on the synthesis of an Ag/Bi3O4Cl photocatalyst for the efficient degradation of TC under visible light.
In this work, Ag/Bi3O4Cl photocatalysts were synthesized by a facile photodeposition process with different contents of silver nitrate. The photocatalytic activities of the Ag/Bi3O4Cl photocatalysts were measured by the degradation of TC under visible light irradiation. Among these samples, the 1.0 wt% Ag/Bi3O4Cl photocatalyst showed outstanding photocatalytic activity. Moreover, the separation and migration of photogenerated charge carriers were evaluated by photocurrent and electrochemical impedance spectroscopy (EIS) analysis. Furthermore, active species trapping experiments and the electron spin resonance (ESR) technique were used to analyze the possible mechanism for the enhanced photocatalytic process.
2. Experimental
2.1. Materials
Bi(NO3)3·5H2O, NH4Cl, AgNO3, disodium ethylene-diamine tetraacetate (EDTA-2Na), tertiary butanol (TBA), ascorbic acid (VC), ethanol, and ethanediol were purchased from Aladdin (Shanghai, China). They were of analytical grade and were used as received from the commercial supplier without further purification.
2.2. Preparation of photocatalysts
Bi3O4Cl nanosheets were prepared by the following hydrothermal method based on the literature report.26 Bi(NO3)3·5H2O (1 mmol) (≥98%, Aldrich) was dispersed in 10 mL ethanediol with vigorous sustained magnetic stirring at 2000 rpm for 30 min. Subsequently, 25 mL NH4Cl (0.34 mmol) solution was added and a white slurry formed immediately. Thereafter, the resultant mixture was transferred into a 50 mL Teflon-lined stainless-steel autoclave with high-temperature resistance and maintained at 160 °C for 12 h. A white precipitate formed after the entire system cooled naturally to room temperature. The product was collected centrifugally and washed three times with deionized water and absolute ethanol. Then the obtained product was dried at 60 °C in the oven overnight. Finally, the yellow product was formed after the white precipitate was transferred into porcelain boats and annealed at 550 °C for 5 h in a muffle furnace at a heating rate of 5 °C min−1.
The Ag/Bi3O4Cl photocatalysts were prepared by the method of photodeposition. In a typical reaction, 0.5 g Bi3O4Cl powder was dispersed in 1 mg mL−1 AgNO3 solution (volume determined from the required proportion of Ag). The suspension was stirred for 30 min, and then exposed to a 250 W xenon lamp for 1 h, as shown in Fig. 1. Thereafter, the as-prepared Ag/Bi3O4Cl samples were obtained by centrifugation. In order to eliminate the adsorbed silver ions (Ag+), the eventual products were washed three times with deionized water. Finally, the as-prepared samples were dried in the oven at 60 °C overnight. The proportions of Ag were 0, 0.5 wt%, 1.0 wt%, 3.0 wt% and 5.0% (weight percent).
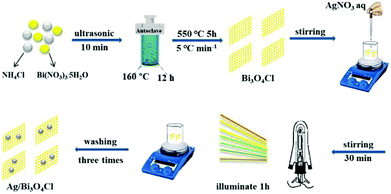 |
| | Fig. 1 Synthesis process for the Ag/Bi3O4Cl photocatalyst. | |
2.3. Characterizations
The X-ray diffraction (XRD) patterns of the as-prepared samples were obtained by using a Rigaku D/MAX-2500 diffractometer (Cu Kα radiation, λ = 0.1542 nm) with a scanning speed of 5° min−1 in the 2θ range of 10–80°. The energy dispersive X-ray spectroscopy (EDX) images were collected with an accelerating voltage of 200 kV (SEM, Hitachi) with a F20 S-TWIN electron microscope (Tecnai G2, FEI Co.). The transmission electron microscopy (TEM) and high-resolution TEM (HRTEM) images were collected using a F20 S-TWIN electron microscope, operated at 200 kV (Tecnai G2, FEI Co.) to obtain the chemical states of the photocatalysts. UV-vis diffuse reflectance spectroscopy (DRS) of the photocatalysts was performed using a UV-vis spectrophotometer (UV-2450, Shimadzu, Japan). The electron spin resonance (ESR) spectra were detected by using a Bruker EPR A 300-10/12 spectrometer to measure the activated species. Photocurrents were obtained and electrochemical impedance spectroscopy (EIS) was conducted using a CHI 760D electrochemical workstation.
2.4. Photocatalytic activity tests
The photocatalytic activities of the as-prepared samples were estimated by monitoring the degradation of TC under visible light irradiation. The light source was a 250 W xenon lamp with a 420 nm cutoff filter. In a typical photocatalytic experiment, 50 mg of sample was dispersed in an aqueous solution of 100 mL TC (10 mg L−1) in a photochemical reactor. Prior to the bright irradiation, the suspension was stirred in the dark for 30 min to achieve an adsorption–desorption equilibrium between the photocatalyst and TC. During the photocatalytic reaction, 5 mL samples of the suspension were removed at 20 min intervals and centrifuged to obtain the supernatants. The concentration of TC in each solution was measured by UV-vis spectroscopy using the absorbance at the characteristic band of 357 nm. The efficiency of degradation was calculated by using C/C0, in which C is the concentration of the reactants at a certain irradiation time and C0 is the original concentration.
2.5. Kinetic study of TC decomposition
To further comprehend the degradation process, the photocatalytic degradation kinetics were researched using the Langmuir–Hinshelwood (L–H) model which can be calculated by the following equation:27–30
in which C0, C and k are the adsorption equilibrium concentration, TC concentration at a certain irradiation time (t), and the apparent reaction rate constant (inverse minutes), respectively.
2.6. Photoelectrochemical measurements
Photocurrent and EIS tests were carried out using a CHI 760D electrochemical workstation in a standard three-electrode configuration with an as-prepared sample as the working electrode, a Pt plate as the counter electrode and an Ag/AgCl electrode as the reference electrode. The electrolyte was a 0.5 mol L−1 Na2SO4 aqueous solution. Each working electrode was prepared as follows: 0.03 mL oleic acid, 0.01 g polyvinyl pyrrolidone (PVP) and 0.03 g sample were dispersed in 3 mL ethanol with stirring for 30 min to make a slurry. The mixture was then spin coated onto a 15 mm × 20 mm indium–tin oxide (ITO) coated glass, and the working electrode was heated in a drying oven at 60 °C for 2 h. A 300 W xenon lamp served as the visible light source (λ > 420 nm).
2.7. Active species trapping experiments
Radical scavengers were employed in order to identify the active species during the photocatalytic process of TC degradation under visible light irradiation. Ascorbic acid (VC) was used to capture ˙O2− radicals, isopropyl alcohol (IPA) was used for ˙OH radicals and disodium ethylene-diamine tetraacetate (EDTA-2Na) was used for h+.31–33 The concentrations of scavengers were all 1 mM, and the experiments followed the process described for the photocatalytic activity test. Furthermore, ESR technology was used to search for the existence of ˙O2− and ˙OH radicals in the photocatalytic reaction system under visible light irradiation (λ > 420 nm). Samples for ESR measurement were prepared as follows: 10.0 mg sample was dissolved in 0.5 mL methanol, and 45 μL DMPO was added with ultrasonic dispersion for 5 min to form DMPO – ˙O2−; 0.5 mL deionized water was used in place of methanol to form DMPO – ˙OH.34,35
3. Results and discussion
3.1. Structure and composition
The crystalline structures of the as-prepared samples were revealed by the X-ray diffraction (XRD) analysis. Fig. 2a shows the XRD patterns of the as-prepared pure Bi3O4Cl nanosheets and the Ag/Bi3O4Cl photocatalysts with different contents of Ag (0.5 wt%, 1.0 wt%, 3.0 wt%, 5.0 wt%). For all samples, the characteristic peaks could be indexed to the monoclinic phase of Bi3O4Cl (JCPDF No. 36-0760).26 Peaks of the Ag phase were not detected which is probably due to the quite low contents of Ag. In addition, the elemental composition of the Ag/Bi3O4Cl photocatalyst (1 wt%) was detected by EDX. As shown in Fig. 2b, the elements of Bi, Cl, O and Ag were found in the Ag/Bi3O4Cl photocatalyst, indicating that the Ag nanoparticles had been deposited on the surface of the Bi3O4Cl nanosheets. Furthermore, the EDX showed that for the 1 wt% Ag/Bi3O4Cl photocatalyst, the atomic ratio of Bi![[thin space (1/6-em)]](https://www.rsc.org/images/entities/char_2009.gif) :
:![[thin space (1/6-em)]](https://www.rsc.org/images/entities/char_2009.gif) O
O![[thin space (1/6-em)]](https://www.rsc.org/images/entities/char_2009.gif) :
:![[thin space (1/6-em)]](https://www.rsc.org/images/entities/char_2009.gif) Cl was very close to 3
Cl was very close to 3![[thin space (1/6-em)]](https://www.rsc.org/images/entities/char_2009.gif) :
:![[thin space (1/6-em)]](https://www.rsc.org/images/entities/char_2009.gif) 4
4![[thin space (1/6-em)]](https://www.rsc.org/images/entities/char_2009.gif) :
:![[thin space (1/6-em)]](https://www.rsc.org/images/entities/char_2009.gif) 1 and the mass percent of Ag nanoparticles approached 1%. Obviously, the above results confirmed that the tested amounts were similar to the calculated values.
1 and the mass percent of Ag nanoparticles approached 1%. Obviously, the above results confirmed that the tested amounts were similar to the calculated values.
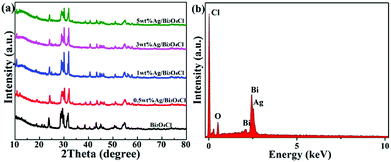 |
| | Fig. 2 (a) XRD patterns of Bi3O4Cl and Ag/Bi3O4Cl samples. (b) EDX spectrum of the 1 wt% Ag/Bi3O4Cl photocatalyst. | |
3.2. Microstructure analyses
To further affirm the successful deposition of the Ag nanoparticles on the Bi3O4Cl nanosheets, the morphologies and microstructures of the Bi3O4Cl nanosheets and 1 wt% Ag/Bi3O4Cl photocatalyst were characterized by SEM, TEM and HRTEM analysis. As shown in Fig. 3a and b, the SEM and TEM images of the pure Bi3O4Cl nanosheets exhibited sheet-like structures with clean and smooth surfaces. In contrast, the TEM images (Fig. 3c and d) of the 1 wt% Ag/Bi3O4Cl photocatalyst clearly showed nanoparticles with diameters of approximately 50 nm on the surface of the sample which illustrated that the Ag nanoparticles had been successfully deposited on the surface of the Bi3O4Cl nanosheets. Meanwhile, the HRTEM image of the 1 wt% Ag/Bi3O4Cl photocatalyst in Fig. 3e showed a lattice-fringe spacing of 0.36 nm (d = 0.36 nm) which corresponded to the (211) plane of the Bi3O4Cl nanosheets, and a spacing of d = 0.233 nm which matched well with the (111) plane of Ag nanoparticles. Additionally, Fig. 3f, which shows the SAED graphics with the typical dot patterns, indicated that the Bi3O4Cl nanosheets were composed of monocrystalline nanoparticles.36 Furthermore, the high-angle annular dark-field scanning transmission electron microscopy (HAADF-STEM) patterns in Fig. 3g demonstrated that Bi, O, Cl, and Ag elements were distributed throughout the whole material, in accordance with the EDX analysis.
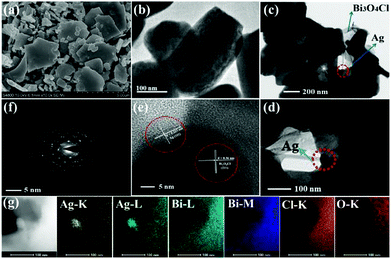 |
| | Fig. 3 (a) SEM and (b) TEM images of pure Bi3O4Cl nanosheets. (c and d) TEM, (e) HRTEM and (f) SAED images of the 1 wt% Ag/Bi3O4Cl photocatalyst. (g) HAADF-STEM image of the 1 wt% Ag/Bi3O4Cl photocatalyst. | |
3.3. XPS analyses
To further research the surface composition and chemical oxidation state of the Ag/Bi3O4Cl photocatalyst, X-ray photoelectron spectroscopy (XPS) was conducted and the results are shown in Fig. 4a. It is worth noting that the XPS survey spectrum of the Ag/Bi3O4Cl photocatalyst displayed all the elements of Bi, O, Cl and Ag, which was in keeping with the EDX and HAADF-STEM results. Fig. 4b exhibits the Ag 3d spectrum; two characteristic peaks at 367.18 eV and 373.18 eV, with a 6 eV spin–orbit splitting value, suggested that the Ag species was present in the Ag/Bi3O4Cl photocatalyst system.37–40 In addition, Fig. 4c (O 1s spectrum) shows that two different oxygen species presented on the surface of the as-prepared sample; the binding energy at 530.48 eV was due to the Bi–O bond and the peak at 529.1 eV was on account of the surface hydroxyl groups (Bi–O–H) in the samples. It was notable that the Cl 2p XPS spectrum in Fig. 4d displayed two peaks at 197.13 eV and 199.03 eV, which corresponded to the 2p3/2 and 2p1/2 orbitals of Cl−, respectively. As shown in Fig. 4e, Bi 4f peaks at 163.58 eV and 158.28 eV were ascribed to Bi 4f5/2 and Bi 4f7/2, which were assigned to Bi3+ in the samples. The results suggested that the samples possessed Ag, Bi3+, Cl− and O2− states coexisting in the Ag/Bi3O4Cl microcosmic architecture.41
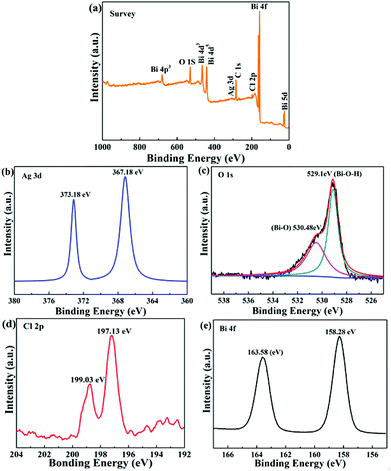 |
| | Fig. 4 XPS spectra of the 1.0 wt% Ag/Bi3O4Cl photocatalyst: (a) survey spectrum, and (b) Ag 3d, (c) O 1s, (d) Cl 2p, and (e) Bi 4f spectra. | |
3.4. UV-vis absorption spectra
The light absorption and energy band features of the as-prepared samples were examined by UV-vis diffuse reflectance spectroscopy (DRS). It was remarkable that the color of the as-prepared samples transformed from yellow to brown with increasing content of deposited Ag (Fig. 5a). Compared to pure Bi3O4Cl nanosheets, the as-prepared Ag/Bi3O4Cl photocatalysts showed an enhancement of photoabsorption in the visible light region owing to the SPR effect of the Ag nanoparticles.42 In particular, the 1 wt% Ag/Bi3O4Cl photocatalyst displayed an excellent visible light absorption intensity, which implied that it more easily produced photogenerated charge carries which should improve its photocatalytic performance. Based on the absorption spectra, curves of converted (αhν)n versus hν were plotted and the equation αhv = A(hv − Eg)n/2 was used to calculate the band gap energies (Eg), where α, h, ν, A and Eg are the absorption coefficient, Planck constant, light frequency, proportionality constant and the band gap, respectively.43 Importantly, the type of optical transitions of a semiconductor determines the value of n (n = 1 for indirect transitions and n = 4 for direct transitions), and, the value of n for Bi3O4Cl has been reported as 1 in previous literature reports.36 As shown in Fig. 5b, it was obvious that the energy gap varied from 2.78 eV to 2.6 eV. The band gap of the Bi3O4Cl nanosheets showed a few changes after they were loaded with Ag nanoparticles, which might be because the metallic clusters introduced localized energy levels into the Bi3O4Cl band gap,44 moreover, this change was one of the most important reasons for the enhanced degradation efficiency.
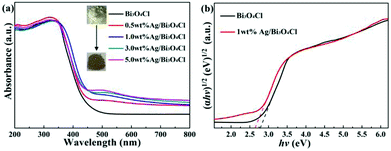 |
| | Fig. 5 (a) UV-vis DRS of the as-prepared samples. (b) Plots of (αhv)1/2 versus hv for pure Bi3O4Cl nanosheets and the 1.0 wt% Ag/Bi3O4Cl photocatalyst. | |
3.5. Photocatalytic tests
The photocatalytic activities of the as-prepared samples were measured by TC degradation under visible light illumination. It was found that TC in aqueous solution hardly degraded without the catalysts under visible light irradiation (Fig. 6a), so the blank experiment of the direct photolysis of TC showed a negligible effect. Compared to that of bare Bi3O4Cl nanosheets, the degradation efficiency was significantly enhanced after the deposition of Ag nanoparticles. Fig. 6a shows that the photocatalytic degradation efficiencies of TC were 61.5%, 70.3%, 94.2%, 75.2% and 73.8% for the bare Bi3O4Cl nanosheets, 0.5 wt% Ag/Bi3O4Cl, 1.0 wt% Ag/Bi3O4Cl, 3.0 wt% Ag/Bi3O4Cl and 5.0 wt% Ag/Bi3O4Cl, respectively. As shown in Fig. 6b, it was obvious that the optimal level of Ag deposition was 1.0% which gave the best degradation rate of 94.2%. Superfluous Ag nanoparticles might enshroud the surface of the samples and prevent the absorption of light leading to a reduction in the number of photogenerated electrons and holes in the Bi3O4Cl nanosheets; the nanoparticles might also take up a greater proportion of the active sites on the surface of the Bi3O4Cl nanosheets to reduce the surface adsorption capability of Bi3O4Cl for the TC molecules and reduce the photocatalytic activity. Notably, Fig. 6c shows that all the photodegradation data could be fitted well to the Langmuir–Hinshelwood model, which is associated with the pseudo-first-order kinetic correlation (ln(C/C0) = kappt). As shown in Fig. 6d, the values of the reaction rate constants (kapp) of blank, pure Bi3O4Cl nanosheets, 0.5 wt% Ag/Bi3O4Cl, 1.0 wt% Ag/Bi3O4Cl, 3.0 wt% Ag/Bi3O4Cl and 5.0 wt% Ag/Bi3O4Cl nanocomposites were calculated to be 0.0000495, 0.00759, 0.00986, 0.0232, 0.0113 and 0.0108 min−1, respectively. The rate constant of 1.0 wt% Ag/Bi3O4Cl was up to 3.05-fold greater than that of the bare Bi3O4Cl nanosheets.
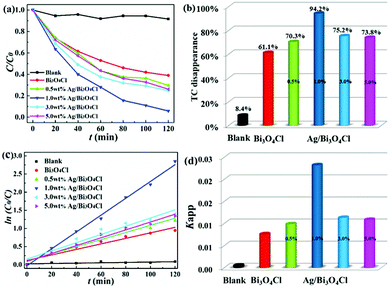 |
| | Fig. 6 (a) Photocatalytic degradation of TC with the as-prepared samples under visible light irradiation. (b) The levels of TC disappearance in the presence of the as-prepared samples. (c) Pseudo-first-order kinetic plots for the TC photodegradation with pure Bi3O4Cl nanosheets and Ag/Bi3O4Cl photocatalysts. (d) Reaction rate constants for the as-prepared samples. | |
3.6. Photocurrents and EIS analysis
The efficient separation of photogenerated electron–hole pairs could be demonstrated by the photocurrents which further illustrated the reason for the high photocatalytic activity of the photocatalysts. As shown in Fig. 7a, the intensity and stability of the photocurrent responses were enhanced when the as-prepared samples were used as electrodes under visible light illumination. Compared to the pure Bi3O4Cl nanosheets, the 1.0 wt% Ag/Bi3O4Cl photocatalyst displayed the highest photocurrent response, which illustrated that the introduction of the Ag nanoparticles efficiently enhanced the separation of photogenerated electron–hole pairs. Furthermore, the EIS electrochemical method effectively testified to the electron-transfer efficiency on the electrodes.45–50 As is well-known, a smaller circular radius indicates a higher mobility and separation of photogenerated electron–hole pairs. It could be observed from the Nyquist plots (Fig. 7b) that 1.0 wt% Ag/Bi3O4Cl nanocomposites exhibited a smaller radius than any other sample, which suggested that the 1.0 wt% Ag/Bi3O4Cl photocatalyst had a resistance that was lower than those of the others and that it exhibited an excellent efficiency of charge transfer due to the modification with Ag nanoparticles.
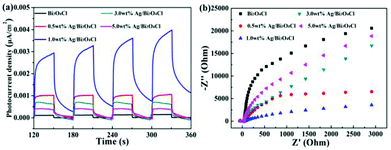 |
| | Fig. 7 (a) Photocurrent responses of the as-prepared samples. (b) EIS of the as-prepared samples. | |
3.7. Photocatalytic mechanism research
In order to confirm the main active substances responsible for TC degradation, free radical trapping experiments were implemented by adding various scavengers into the TC solution with the 1.0 wt% Ag/Bi3O4Cl photocatalyst. Scavengers of 1 mM ascorbic acid (VC), isopropyl alcohol (IPA) and disodium ethylene-diamine tetraacetate (EDTA-2Na) were used to capture ˙O2−, ˙OH, and h+, respectively. The photocatalytic efficiency of TC was affected by the addition of VC, IPA and EDTA-2Na (Fig. 8a and b). Therefore, ˙O2−, ˙OH and h+ all played a vital role during the photocatalytic degradation of TC in the Ag/Bi3O4Cl photocatalyst system under visible light irradiation.
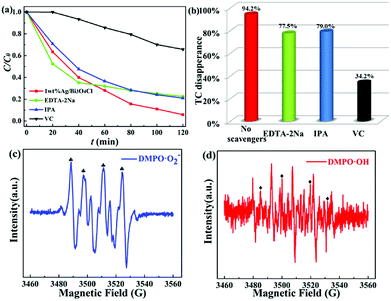 |
| | Fig. 8 (a and b) Active species trapping experiments for TC degradation over the 1.0 wt% Ag/Bi3O4Cl photocatalyst in the presence of different scavengers under visible light irradiation. ESR spectra of (c) DMPO-˙O2− in a methanol dispersion and (d) DMPO-˙OH in an aqueous dispersion. | |
To further demonstrate the above conclusion, the ESR technique was used for detecting the presence of ˙O2− radicals and ˙OH radicals in the as-prepared Ag/Bi3O4Cl photocatalyst reaction system. It can be clearly seen in Fig. 8c and d that four intense characteristic peaks for DMPO-˙O2− adducts were observed (1![[thin space (1/6-em)]](https://www.rsc.org/images/entities/char_2009.gif) :
:![[thin space (1/6-em)]](https://www.rsc.org/images/entities/char_2009.gif) 1
1![[thin space (1/6-em)]](https://www.rsc.org/images/entities/char_2009.gif) :
:![[thin space (1/6-em)]](https://www.rsc.org/images/entities/char_2009.gif) 1
1![[thin space (1/6-em)]](https://www.rsc.org/images/entities/char_2009.gif) :
:![[thin space (1/6-em)]](https://www.rsc.org/images/entities/char_2009.gif) 1 quartet pattern) under visible light irradiation, as well as signals for DMPO-˙OH radicals (1
1 quartet pattern) under visible light irradiation, as well as signals for DMPO-˙OH radicals (1![[thin space (1/6-em)]](https://www.rsc.org/images/entities/char_2009.gif) :
:![[thin space (1/6-em)]](https://www.rsc.org/images/entities/char_2009.gif) 2
2![[thin space (1/6-em)]](https://www.rsc.org/images/entities/char_2009.gif) :
:![[thin space (1/6-em)]](https://www.rsc.org/images/entities/char_2009.gif) 2
2![[thin space (1/6-em)]](https://www.rsc.org/images/entities/char_2009.gif) :
:![[thin space (1/6-em)]](https://www.rsc.org/images/entities/char_2009.gif) 1 quartet pattern);51 the other four intense peaks are due to the oxidation of DMPO. Therefore, based on the above experimental results, ˙O2− radicals and ˙OH radicals were identified as active oxidation species during the photodegradation process.
1 quartet pattern);51 the other four intense peaks are due to the oxidation of DMPO. Therefore, based on the above experimental results, ˙O2− radicals and ˙OH radicals were identified as active oxidation species during the photodegradation process.
Photostability and recyclability are crucial factors in the practical application of a photocatalyst. The photostability and recyclability of the 1.0 wt% Ag/Bi3O4Cl photocatalyst were assessed by recycling the catalyst in consecutive photocatalytic TC degradation experiments under visible light irradiation. As shown in Fig. 9a, there were no distinct changes in the photocatalytic degradation of TC over the 1.0 wt% Ag/Bi3O4Cl photocatalyst over five consecutive cycling experiments, which demonstrated the high photostability and recyclability of the as-prepared sample. Moreover, there was no obvious difference between the XRD pattern of the photocatalyst prior to any degradation experiments and that after five consecutive cycles (Fig. 9b), which further illustrated the splendid photostability and recyclability of the as-prepared nanocomposite.
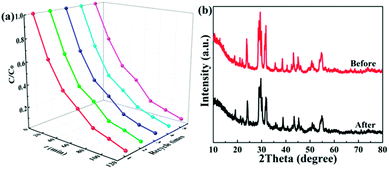 |
| | Fig. 9 (a) The TC degradation efficiency of the 1.0 wt% Ag/Bi3O4Cl photocatalyst under visible light irradiation over five cycles. (b) XRD patterns of the 1.0 wt% Ag/Bi3O4Cl photocatalyst before and after five cycles of photocatalytic degradation. | |
In order to explain the charge separation process of the as-prepared photocatalyst, the valence band (VB) edge position and the conduction band (CB) edge position of Bi3O4Cl were calculated by using the following empirical formulas:52
in which
EVB and
ECB are the VB and CB edge potentials, respectively; and
χ,
Ee and
Eg are the absolute electronegativity of the semiconductor (6.08 eV), the energy of free electrons on the hydrogen scale (about 4.5 eV) and the band gap energy of the semiconductor (2.78 eV), respectively.
26 Therefore, the
ECB and
EVB of Bi
3O
4Cl nanosheets were calculated to be 0.19 eV and 2.97 eV. Notably, the VB potential of the Bi
3O
4Cl nanosheets was more positive than the redox potential of OH
−/˙OH (1.99 eV
vs. NHE) and H
2O/˙OH (2.7 eV
vs. NHE),
25 therefore the H
2O and OH
− were oxidized by h
+ into ˙OH which played an oxidizing role in the TC degradation process.
Based on the aforementioned discussion and the experimental results, a possible mechanism for the degradation of TC by the Ag/Bi3O4Cl photocatalyst was proposed and is shown in Fig. 10. When the Ag/Bi3O4Cl photocatalyst is exposed to visible light, the electrons (e−) in the VB of the Bi3O4Cl nanosheets can be excited to the CB, leaving holes (h+) in the VB of the Bi3O4Cl nanosheets. The photogenerated holes remain in the VB of Bi3O4Cl nanosheets to directly oxidize OH− or H2O to form ˙OH active species. However, the super-oxygen radical (˙O2−) cannot be generated because the VB of the Bi3O4Cl nanosheets is more positive than the O2/˙O2− potential (−0.046 eV vs. NHE).25 Therefore, the existence of Ag nanoparticles is extraordinarily significant because the absorbance of the metallic Ag nanoparticles leads to the generation of abundant electron–hole pairs, as shown in Fig. 10. The photogenerated electrons (e−) of Bi3O4Cl are transferred to the Ag nanoparticles and recombine with the plasmon-generated holes of the metallic Ag nanoparticles because the CB edge potential of Bi3O4Cl (0.19 eV vs. NHE) is more negative than the Fermi level of Ag (0.4 eV vs. NHE).38 Subsequently, electrons (e−) on the Ag nanoparticles can be captured by O2 in water to generate ˙O2− radicals which are vigorous oxidants that can oxidize TC to its degradation products. Throughout the above analysis, the antibiotic is gradually damaged by the Ag/Bi3O4Cl photocatalyst; the degradation and charge carrier transfer processes can be described as follows:
| | |
Bi3O4Cl + hv → Bi3O4Cl (h+) + Bi3O4Cl (e−)
| (3) |
| | |
O2 + Ag (e−) → ˙O2− + Ag
| (7) |
| | |
˙O2− (˙OH or h+) + TC → degradation products
| (8) |
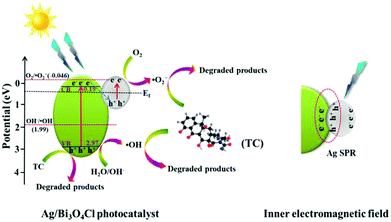 |
| | Fig. 10 The possible photocatalytic mechanism of the Ag/Bi3O4Cl photocatalyst in the degradation of TC under visible light irradiation. | |
4. Conclusions
In summary, a novel Ag/Bi3O4Cl photocatalyst was successfully synthesized by a simple photodeposition process. The as-prepared Ag/Bi3O4Cl photocatalyst displayed significantly higher photocatalytic efficiency than bare Bi3O4Cl nanosheets for the degradation of TC under visible light irradiation. Among the photocatalyst specimens, the 1.0 wt% Ag/Bi3O4Cl sample showed the optimal photocatalytic activity, reaching 94.2% degradation of TC in 120 min under visible light irradiation. The rate constant of the 1.0 wt% Ag/Bi3O4Cl sample was 3.05-fold higher than that of the bare Bi3O4Cl nanosheets. The enhanced photocatalytic activity for the Ag/Bi3O4Cl photocatalyst could be due to the SPR absorbance of the metallic Ag nanoparticles. This work provides a new approach for synthesizing novel Ag/Bi3O4Cl photocatalysts and studying the possible mechanism of TC degradation.
Conflicts of interest
There are no conflicts to declare.
Author contributions
All the authors contributed to this work.
Acknowledgements
We would like to acknowledge the National Natural Science Foundation of China (21576112, 21546006 and 21606114), the Six Talent Peaks Project in Jiangsu Province (XNY-009), the Foundation Research Project of JiangSu Province (the Natural Science Fund BK20150536), Jiangsu Planned Projects for Postdoctoral Research Funds (1701025A) the Postdoctoral Science Foundation of China (2017M611712, 2017M611717) and the Talent Introduction Project of Jiangsu University (17JDG020).
References
- X. X. Zhao, Z. Y. Lu, M. B. Wei, M. H. Zhang, H. J. Dong, C. W. Yi, R. Ji and Y. S. Yan, Appl. Catal., B, 2018, 220, 137–147 CrossRef CAS.
- F. Chen, Q. Yang, J. Sun, F. B. Yao, S. N. Wang, Y. L. Wang, X. L. Wang, X. M. Li, C. G. Niu, D. B. Wang and G. M. Zeng, ACS Appl. Mater. Interfaces, 2016, 8, 32887–32900 CrossRef CAS PubMed.
- L. W. Chen, X. Zuo, L. Zhou, Y. Huang, S. J. Yang, T. M. Cai and D. H. Ding, Chem. Eng. J., 2018, 45, 64–374 CrossRef.
- H. B. Yu, B. B. Huang, H. Wang, X. Z. Yuan, L. B. Jiang, Z. B. Wu, J. Zhang and G. M. Zeng, J. Colloid Interface Sci., 2018, 522, 82–94 CrossRef CAS PubMed.
- F. L. Wang, Y. P. Feng, P. Chen, Y. F. Wang, Y. H. Su, Q. X. Zhang, Y. Q. Zeng, Z. J. Xie, H. J. Liu, Y. Liu, W. Y. Lv and G. G. Liu, Appl. Catal., B, 2018, 227, 114–122 CrossRef CAS.
- Z. Zhu, Y. Yu, H. J. Dong, Z. Liu, C. X. Li, P. W. Huo and Y. S. Yan, ACS Sustainable Chem. Eng., 2017, 5, 10614–10623 CrossRef CAS.
- H. N. Che, G. B. Che, H. J. Dong, W. Hu, H. Hu, C. B. Liu and C. M. Li, Appl. Surf. Sci., 2018, 455, 705–716 CrossRef CAS.
- H. N. Che, G. B. Che, E. H. Jiang, C. B. Liu, H. J. Dong and C. M. Li, J. Taiwan Inst. Chem. Eng., 2018, 91, 224–234 CrossRef CAS.
- S. J. Li, S. W. Hu, W. Jiang, Y. P. Liu, Y. T. Zhou, Y. Liu and L. Y. Mo, J. Colloid Interface Sci., 2018, 521, 42–49 CrossRef CAS PubMed.
- S. X. Yu, Y. H. Zhang, F. Dong, M. Li, T. R. Zhang and H. W. Huang, Appl. Catal., B, 2018, 226, 441–450 CrossRef CAS.
- R. Li, Y. F. Jia, J. Wu and Q. Zhen, RSC Adv., 2015, 5, 40764–40771 RSC.
- R. B. Wei, Z. L. Huang, G. H. Gu, Z. Wang, L. X. Zeng, Y. B. Chen and Z. Q. Liu, Appl. Catal., B, 2018, 231, 101–107 CrossRef CAS.
- C. B. Liu, P. Li, G. L. Wu, B. F. Luo, S. Lin, A. Ren and W. D. Shi, RSC Adv., 2015, 5, 33938–33945 RSC.
- S. S. Ma, J. J. Xue, Y. M. Zhou and Z. W. Zhang, RSC Adv., 2015, 5, 40000–40006 RSC.
- G. J. Wu, Y. Zhao, Y. W. Li, B. Souvanhthong, H. M. Ma and J. Z. Zhao, Ceram. Int., 2018, 44, 5392–5401 CrossRef CAS.
- X. Xiao, C. X. Zheng, M. L. Lu, L. Zhang, F. Liu, X. X. Zuo and J. M. Nan, Appl. Catal., B, 2018, 228, 142–151 CrossRef CAS.
- B. Priya, P. Raizada, N. Singh, P. Thakur and P. Singh, J. Colloid Interface Sci., 2016, 479, 271–283 CrossRef CAS PubMed.
- F. Chen, H. W. Huang, Y. H. Zhang and T. R. Zhang, Chin. Chem. Lett., 2017, 28, 2244–2250 CrossRef CAS.
- S. B. Ning, L. Y. Ding, Z. G. Lin, Q. Y. Lin, H. L. Zhang, H. X. Lin, J. L. Long and X. X. Wang, Appl. Catal., B, 2016, 185, 203–212 CrossRef CAS.
- J. Li, L. J. Cai, J. Shang, Y. Yu and L. Z. Zhang, Adv. Mater., 2016, 28, 4059–4064 CrossRef CAS PubMed.
- G. Hamscher, S. Sczesny, H. Hoper and H. Nau, Anal. Chem., 2002, 74, 1509–1518 CrossRef CAS PubMed.
- M. K. Lee, T. G. Kim, W. Kim and Y. M. Sung, J. Phys. Chem. C, 2008, 112, 10079–10082 CrossRef CAS.
- W. Wang, M. Lai, J. J. Fang and C. H. Lu, Appl. Surf. Sci., 2018, 439, 430–438 CrossRef CAS.
- L. Tang, C. Y. Feng, Y. C. Deng, G. M. Zeng, J. J. Wang, Y. N. Liu, H. P. Peng and J. J. Wang, Appl. Catal., B, 2018, 230, 102–114 CrossRef CAS.
- B. F. Luo, D. B. Xu, D. Li, G. L. Wu, M. M. Wu, W. D. Shi and M. Chen, ACS Appl. Mater. Interfaces, 2015, 31, 17061–17069 CrossRef PubMed.
- A. K. Chakraborty and M. A. Kebede, React. Kinet., Mech. Catal., 2012, 106, 83–98 CrossRef CAS.
- S. Senobari and A. Nezamzadeh-Ejhieh, J. Mol. Liq., 2018, 261, 208–217 CrossRef CAS.
- A. J. Anceno and R. M. Stuetz, Appl. Catal., B, 2016, 181, 661–671 CrossRef CAS.
- H. N. Che, L. H. Liu, G. B. Che, H. J. Dong, C. B. Liu and C. M. Li, Chem. Eng. J., 2019, 357, 209–219 CrossRef CAS.
- A. Turki, C. Guillard, F. Dappozze, Z. Ksibi, G. Berhault and H. Kochkar, Appl. Catal., B, 2015, 163, 404–414 CrossRef CAS.
- G. Q. Tan, L. N. She, T. Liu, C. Xu, H. J. Ren and A. Xia, Appl. Catal., B, 2017, 207, 120–133 CrossRef CAS.
- Z. Zhu, Z. Y. Lu, D. D. Wang, X. Tang, Y. S. Yan, W. D. Shi, Y. S. Wang, N. L. Gao, X. Yao and H. J. Dong, Appl. Catal., B, 2016, 182, 115–122 CrossRef CAS.
- F. A. Sofi, K. Majid and O. Mehraj, J. Alloys Compd., 2018, 737, 798–808 CrossRef CAS.
- C. Liu, H. J. Zhu, Y. S. Zhu, P. Y. Dong, H. J. Hou, Q. X. Xu, X. W. Chen, X. G. Xi and W. H. Hou, Appl. Catal., B, 2018, 228, 54–63 CrossRef CAS.
- D. M. Ma, J. B. Zhong, J. Z. Li, L. Wang and R. F. Peng, Appl. Surf. Sci., 2018, 443, 497–505 CrossRef CAS.
- L. Xu, F. X. Bu, M. Hu, C. Y. Jin, D. M. Jiang, Z. J. Zhao, Q. H. Zhang and J. S. Jiang, Chem. Commun., 2014, 50, 13849–13852 RSC.
- Z. Zhu, X. Tang, C. C. Ma, M. S. Song, N. L. Gao, Y. S. Wang, P. W. Huo, Z. Y. Lu and Y. S. Yan, Appl. Surf. Sci., 2016, 387, 366–374 CrossRef CAS.
- J. B. Chen, H. N. Che, K. Huang, C. B. Liu and W. D. Shi, Appl. Catal., B, 2016, 192, 134–144 CrossRef CAS.
- W. J. Liu, X. B. Liu, Y. H. Fu, Q. Q. You, R. K. Huang, P. Liu and Z. H. Li, Appl. Catal., B, 2012, 123, 78–83 Search PubMed.
- D. Wei, F. Tian, Z. Lu, H. Yang and R. Chen, RSC Adv., 2016, 6, 52264–52270 RSC.
- C. Wang, X. Zhang and X. Song, ACS Appl. Mater. Interfaces, 2016, 8, 5320–5326 CrossRef CAS PubMed.
- M. Shakeel, B. S. Li, M. Arif, G. Yasin, W. Rehman, A. U. Khan, S. Khan, A. Khan and J. Ali, Appl. Catal., B, 2018, 227, 433–445 CrossRef CAS.
- H. N. Che, C. B. Liu, W. Hu, H. Hu, J. Q. Li, J. Y. Dou, W. D. Shi, C. M. Li and H. J. Dong, Catal. Sci. Technol., 2018, 8, 622–631 RSC.
- N. Sobana, M. Muruganadham and M. Swaminathan, J. Mol. Catal. A: Chem., 2006, 258, 124–132 CrossRef CAS.
- N. Spataru, C. Anastasescu, M. M. Radu, I. Balint, C. Negrila, T. Spataru and A. Fujishima, Appl. Surf. Sci., 2018, 444, 216–223 CrossRef CAS.
- M. Wang, P. Y. Guo, Y. Zhang, C. M. Lv, T. Y. Liu, T. Y. Chai, Y. H. Xie, Y. Z. Wang and T. Zhu, J. Hazard. Mater., 2018, 349, 224–233 CrossRef CAS PubMed.
- S. F. Kang, W. Huang, L. Zhang, M. F. He, S. Y. Xu, D. Sun and X. Jiang, ACS Appl. Mater. Interfaces, 2018, 10, 13796–13804 CrossRef CAS PubMed.
- A. Shanaghi, H. Nonahal and P. K. Chu, J. Alloys Compd., 2018, 739, 92–100 CrossRef CAS.
- J. Shen, D. H. Chen, W. Zhao and W. W. Zhang, ChemistrySelect, 2018, 3, 3363–3373 CrossRef CAS.
- H. Zhao, X. S. Wang, J. F. Feng, Y. N. Chen, X. Yang, S. Y. Gao and R. Cao, Catal. Sci. Technol., 2018, 8, 1288–1295 RSC.
- H. Xu, J. Xie, W. Jia, G. M. Wu and Y. L. Cao, J. Colloid Interface Sci., 2018, 516, 511–521 CrossRef CAS PubMed.
- F. Deng, L. N. Zhao, X. B. Luo, S. L. Luo and D. D. Dionysiou, Chem. Eng. J., 2018, 333, 423–433 CrossRef CAS.
Footnote |
| † Enhui Jiang and Xiaoteng Liu are co-first authors. |
|
| This journal is © The Royal Society of Chemistry 2018 |
Click here to see how this site uses Cookies. View our privacy policy here.  Open Access Article
 b,
Hongjun Dong
 b and
Guangbo Che
 *c
*c
![[thin space (1/6-em)]](https://www.rsc.org/images/entities/char_2009.gif) :
:![[thin space (1/6-em)]](https://www.rsc.org/images/entities/char_2009.gif) O
O![[thin space (1/6-em)]](https://www.rsc.org/images/entities/char_2009.gif) :
:![[thin space (1/6-em)]](https://www.rsc.org/images/entities/char_2009.gif) Cl was very close to 3
Cl was very close to 3![[thin space (1/6-em)]](https://www.rsc.org/images/entities/char_2009.gif) :
:![[thin space (1/6-em)]](https://www.rsc.org/images/entities/char_2009.gif) 4
4![[thin space (1/6-em)]](https://www.rsc.org/images/entities/char_2009.gif) :
:![[thin space (1/6-em)]](https://www.rsc.org/images/entities/char_2009.gif) 1 and the mass percent of Ag nanoparticles approached 1%. Obviously, the above results confirmed that the tested amounts were similar to the calculated values.
1 and the mass percent of Ag nanoparticles approached 1%. Obviously, the above results confirmed that the tested amounts were similar to the calculated values.


![[thin space (1/6-em)]](https://www.rsc.org/images/entities/char_2009.gif) :
:![[thin space (1/6-em)]](https://www.rsc.org/images/entities/char_2009.gif) 1
1![[thin space (1/6-em)]](https://www.rsc.org/images/entities/char_2009.gif) :
:![[thin space (1/6-em)]](https://www.rsc.org/images/entities/char_2009.gif) 1
1![[thin space (1/6-em)]](https://www.rsc.org/images/entities/char_2009.gif) :
:![[thin space (1/6-em)]](https://www.rsc.org/images/entities/char_2009.gif) 1 quartet pattern) under visible light irradiation, as well as signals for DMPO-˙OH radicals (1
1 quartet pattern) under visible light irradiation, as well as signals for DMPO-˙OH radicals (1![[thin space (1/6-em)]](https://www.rsc.org/images/entities/char_2009.gif) :
:![[thin space (1/6-em)]](https://www.rsc.org/images/entities/char_2009.gif) 2
2![[thin space (1/6-em)]](https://www.rsc.org/images/entities/char_2009.gif) :
:![[thin space (1/6-em)]](https://www.rsc.org/images/entities/char_2009.gif) 2
2![[thin space (1/6-em)]](https://www.rsc.org/images/entities/char_2009.gif) :
:![[thin space (1/6-em)]](https://www.rsc.org/images/entities/char_2009.gif) 1 quartet pattern);51 the other four intense peaks are due to the oxidation of DMPO. Therefore, based on the above experimental results, ˙O2− radicals and ˙OH radicals were identified as active oxidation species during the photodegradation process.
1 quartet pattern);51 the other four intense peaks are due to the oxidation of DMPO. Therefore, based on the above experimental results, ˙O2− radicals and ˙OH radicals were identified as active oxidation species during the photodegradation process.


