
 Open Access Article
 This Open Access Article is licensed under a Creative Commons Attribution-Non Commercial 3.0 Unported Licence
Pseudocapacitive-battery-like behavior of cobalt manganese nickel sulfide (CoMnNiS) nanosheets grown on Ni-foam by electrodeposition for realizing high capacity†
Mahesh Verma a,
Rohit Yadavb,
Lichchhavi Sinhaa,
Sawanta S. Malic,
Chang Kook Hongc and
Parasharam M. Shirage*ab
a,
Rohit Yadavb,
Lichchhavi Sinhaa,
Sawanta S. Malic,
Chang Kook Hongc and
Parasharam M. Shirage*ab
aDiscipline of Metallurgy Engineering and Material Science, Indian Institute of Technology Indore, Khandwa Road, Simrol, Indore-453552, India. E-mail: pmshirage@iiti.ac.in; paras.shirage@gmail.com
bDiscipline of Physics, Indian Institute of Technology Indore, Indore-453552, India
cPolymer Energy Materials Laboratory, Department of Advanced Chemical Engineering, Chonnam National University, Gwangju-61186, South Korea
First published on 30th November 2018
Abstract
Hierarchical interconnected nanosheets (HIN) of cobalt manganese nickel sulfide (CoMnNiS) were synthesized on Ni foam by a simple and economical electrodeposition technique for energy storage application. Sulfonated thin nanosheets of Co, Mn and Ni provide stability of chemical activity, surface functionalization and surface reactivity to the electrode. The fabricated electrode shows a specific capacity of 257.4 mA h g−1 (at 2.5 A g−1), measured by galvanostatic charging–discharging (GCD). Both diffusion and capacitive mechanisms in the sulfide layer contribute to the high electrical conductivity. Asymmetric devices CoMnNiS/NiCuO and CoMnNiS/CNT (CNT = carbon nanotubes) were fabricated, providing a maximum operating voltage of 1.7 V and 1 V, specific capacity of 20.8 and 50.8 mA h g−1, and energy density of 8.4 and 6.3 W h kg−1 corresponding to a power density of 985 and 211 W kg−1, respectively, at a current density of 0.5 and 0.63 A g−1. These results demonstrate a novel material for application in energy storage devices as an electrode.
1. Introduction
In order to protect living beings and the environment from the adverse effects of harnessing/utilization of fossil fuels for energy needs, generation of eco-friendly energy and its storage is becoming a highly urgent task for researchers. Efficient electrical energy storage can play a vital role in shaping our future needs. Nowadays, development of energy storage devices for portable electronic applications is a prime research focus with increasing demand for solar, wind and other natural sources of green energy. These storage devices should be efficient enough to meet the demands for energy storage and release for applications in a wide area of interest including wireless communication, sensor networks, portable generators, etc.1 Classification of electrical energy storage devices can be done mainly in two ways: based on energy density and power density, where the first one refers to batteries and the second to supercapacitors. Supercapacitors, compared to batteries, possess unique properties like fast charge/discharge times, extended life cycle, good reliability, and massive charge storage capacity. All these features make them superior to their battery counterparts,2–5 but they are lacking in terms of energy density, a key parameter for device application. The charge storage behavior of an electrode depends on properties like high surface area, porosity, electronic conductivity and multiple faradaic redox reactions. These factors influence the amount of charge collected, and the speed of transfer of ions through nanopores. Therefore, the material and synthesis strategies should be carefully selected in the design and fabrication of electrodes.Transition metal sulfides (TMS) have already been explored as high performance pseudocapacitor materials.6 TMS, as compared to transition metal oxides (TMO), possess properties like high porosity, high levels of active redox species, fast ion transport, high number of active sites, short ion diffusion paths and high numbers of charging/discharging cycles, contributing to high energy density and stability of the electrode. TMS possess layered crystal structures, so nanosheets of metal sulfides can provide large specific surface area and interlayer spacing for ion intercalation,7 thereby increasing the capacitance of the electrode. Therefore, TMS are being paid increasing attention; additionally, sulfur can impart properties like porosity and a fast ion transport mechanism8–10 to the electrode. Recent studies on sulfides of molybdenum (MoS2), cobalt (CoS), nickel (NiS), and copper (CuS) show that the pseudocapacitive behaviors of these materials are improved by the presence of sulfur.11,12 Composites like CoS/graphene composite (654 F g−1), nickel sulfide@CoS double-shelled polyhedra (2291 F g−1), MnS nanoclusters (828 F g−1), MnS/rGO (rGO = reduced graphene oxide) (846.4 F g−1), NiCo2S4@polypyrrole core–shell, CC/H–Ni@Al–Co–S, and Co–Al-LDHs (layered double hydroxides)13–19 show the high specific capacitance and stability of metal sulfide-based materials. NiCo2S4 nanostructures17 grown on Ni foam showed a specific capacitance of 1948 mF cm−2, high rate capability and stability compared to NiCoO4, due to their small band gap18 and presence of inherent redox centers for reaction.12 Similarly, NiCo2S4@DCCNF (Double Capillary Carbon Nanofiber), Ni@Ni(OH)2 and Co-doped Ni@Ni3S2, and Ni@Ni–Co–S have shown high electrochemical performance.20–23 Moreover, these multi-TMS surpass their mono-metal sulfide counterparts in terms of electrochemical activity and capacitance and thus find use in electrode fabrication.
From the above literature, it is found that individual/combined TMS like nickel sulfide, cobalt sulfide, manganese sulfide and NiCo2S4 can act as high performance energy storage materials. Here, an effort is made to harness the potential of all these high performance metal (Co, Mn and Ni) sulfides, which may possess rich redox behavior17 compared to single metal sulfides. Electrode materials for supercapacitors can be prepared by various methods like hydrothermal, electrodeposition, sputtering, chemical bath deposition, etc. Among all these methods, the electrodeposition technique23 has a greater advantage in terms of purity, homogeneity and growth time due to the electrochemical mechanism. Therefore, here we have used electrodeposition to synthesize a hierarchical interconnected nanosheets (HIN) composite of CoMnNiS on conductive porous 3D Ni foam for exploring its electrochemical energy storage behavior.
2. Experimental
2.1 Material synthesis
All chemicals used were of high purity, analytical grade, and were used as such without any further purification. In a typical synthesis, Ni foams with size 1 × 1 cm2 were first cleaned by sonication in conc. HCl solution, followed by acetone, ethanol, and deionized (DI) water for 15 min, to remove any surface impurities present. For electrodeposition of CoMnNiS onto Ni foam, 0.01 M cobalt nitrate hexahydrate (Co(NO3)2·6H2O), 0.01 M manganese nitrate hydrate (Mn(NO3)2·xH2O) and 0.01 M nickel nitrate hexahydrate (Ni(NO3)2·6H2O) were transferred to a beaker with an addition of 15 mL DI water, and this solution was kept stirring at 400 rpm for 30 min. Afterwards 0.1 M sodium sulphite (Na2SO3) and 0.01 M potassium chloride (KCl) were added to the above solution and further stirred for 20 min. This solution was then transferred to an electrochemical cell, having Ag/AgCl as the reference electrode, Ni foam as a working electrode and Pt foil as the counter electrode, for carrying out electrodeposition, in chronoamperometry mode. A potential of −1.2 V was applied for 10 min on the working electrode, with the temperature of the electrolyte solution kept at 90 °C. Afterwards, the electrodeposited Ni foil was washed with DI water, and dried for 12 h at 70 °C. The mass (0.4 mg) of active material deposited was calculated from the mass difference of Ni foam after and before the electrodeposition process.2.2 Material characterization
The crystal structure, phase and surface morphology of the samples were characterized by powder X-ray diffraction (Rigaku CuKα radiation, λ = 1.5146 Å) and field scanning electron microscope (FESEM, Supra Zeiss 55), respectively. High resolution micrographs and selected area diffraction patterns (SAED) were taken using high resolution transmission electron microscopy (HRTEM, TECNAI F20 Philips operated at 200 kV). The chemical state of each sample was detected by X-ray photoelectron spectroscopy (VG Multilab 2000-Thermo Scientific, USA, K-Alpha) with a multi-channel detector, which can endure high photonic energies from 0.1 to 3 keV.2.3 Electrochemical measurement
Electrochemical measurements were carried out on an Autolab PGSTAT302N in three-electrode cell configuration, with electrodeposited Ni foam as working electrode, Pt foil as counter electrode and Ag/AgCl as reference electrode in 2 M KOH electrolyte solution. Cyclic voltammetry (CV) was carried out at various scan rates in the range 1–90 mV s−1 in the potential window of −0.1 to 0.4 V. Galvanostatic charge–discharge (GCD) was measured at different current densities in the range 2.5–75 A g−1. The cyclic stability of each sample was tested at a current density of 50 A g−1 for 3600 cycles.Asymmetric devices were fabricated using the CoMnNiS electrodeposited Ni foam and the NiCuO/CNT (CNT = carbon nanotubes) nanostructure on Ni foam with polypropylene film as the separator. An electrolyte of KOH/PVA gel was prepared by dissolving 1 g of PVA and 1 g of KOH in 10 mL of DI water under vigorous stirring at 85 °C. Electrodes of CoMnNiS/NiCuO and CoMnNiS/CNT were soaked in the gel for 5 min and arranged to form a stacked structure which later was dried at 60 °C for 3 h, then the whole structure was wrapped in polymer film for measurement.
3. Results and discussion
3.1 Growth mechanism of the nanostructure by electrodeposition technique
A schematic representation of the nanostructure formation along with the arrangement used for the electrodeposition process is illustrated in Fig. 1(a). Electrodeposition was carried out at −1.2 V on Ni foam for 10 min, resulting in the growth of nanostructures.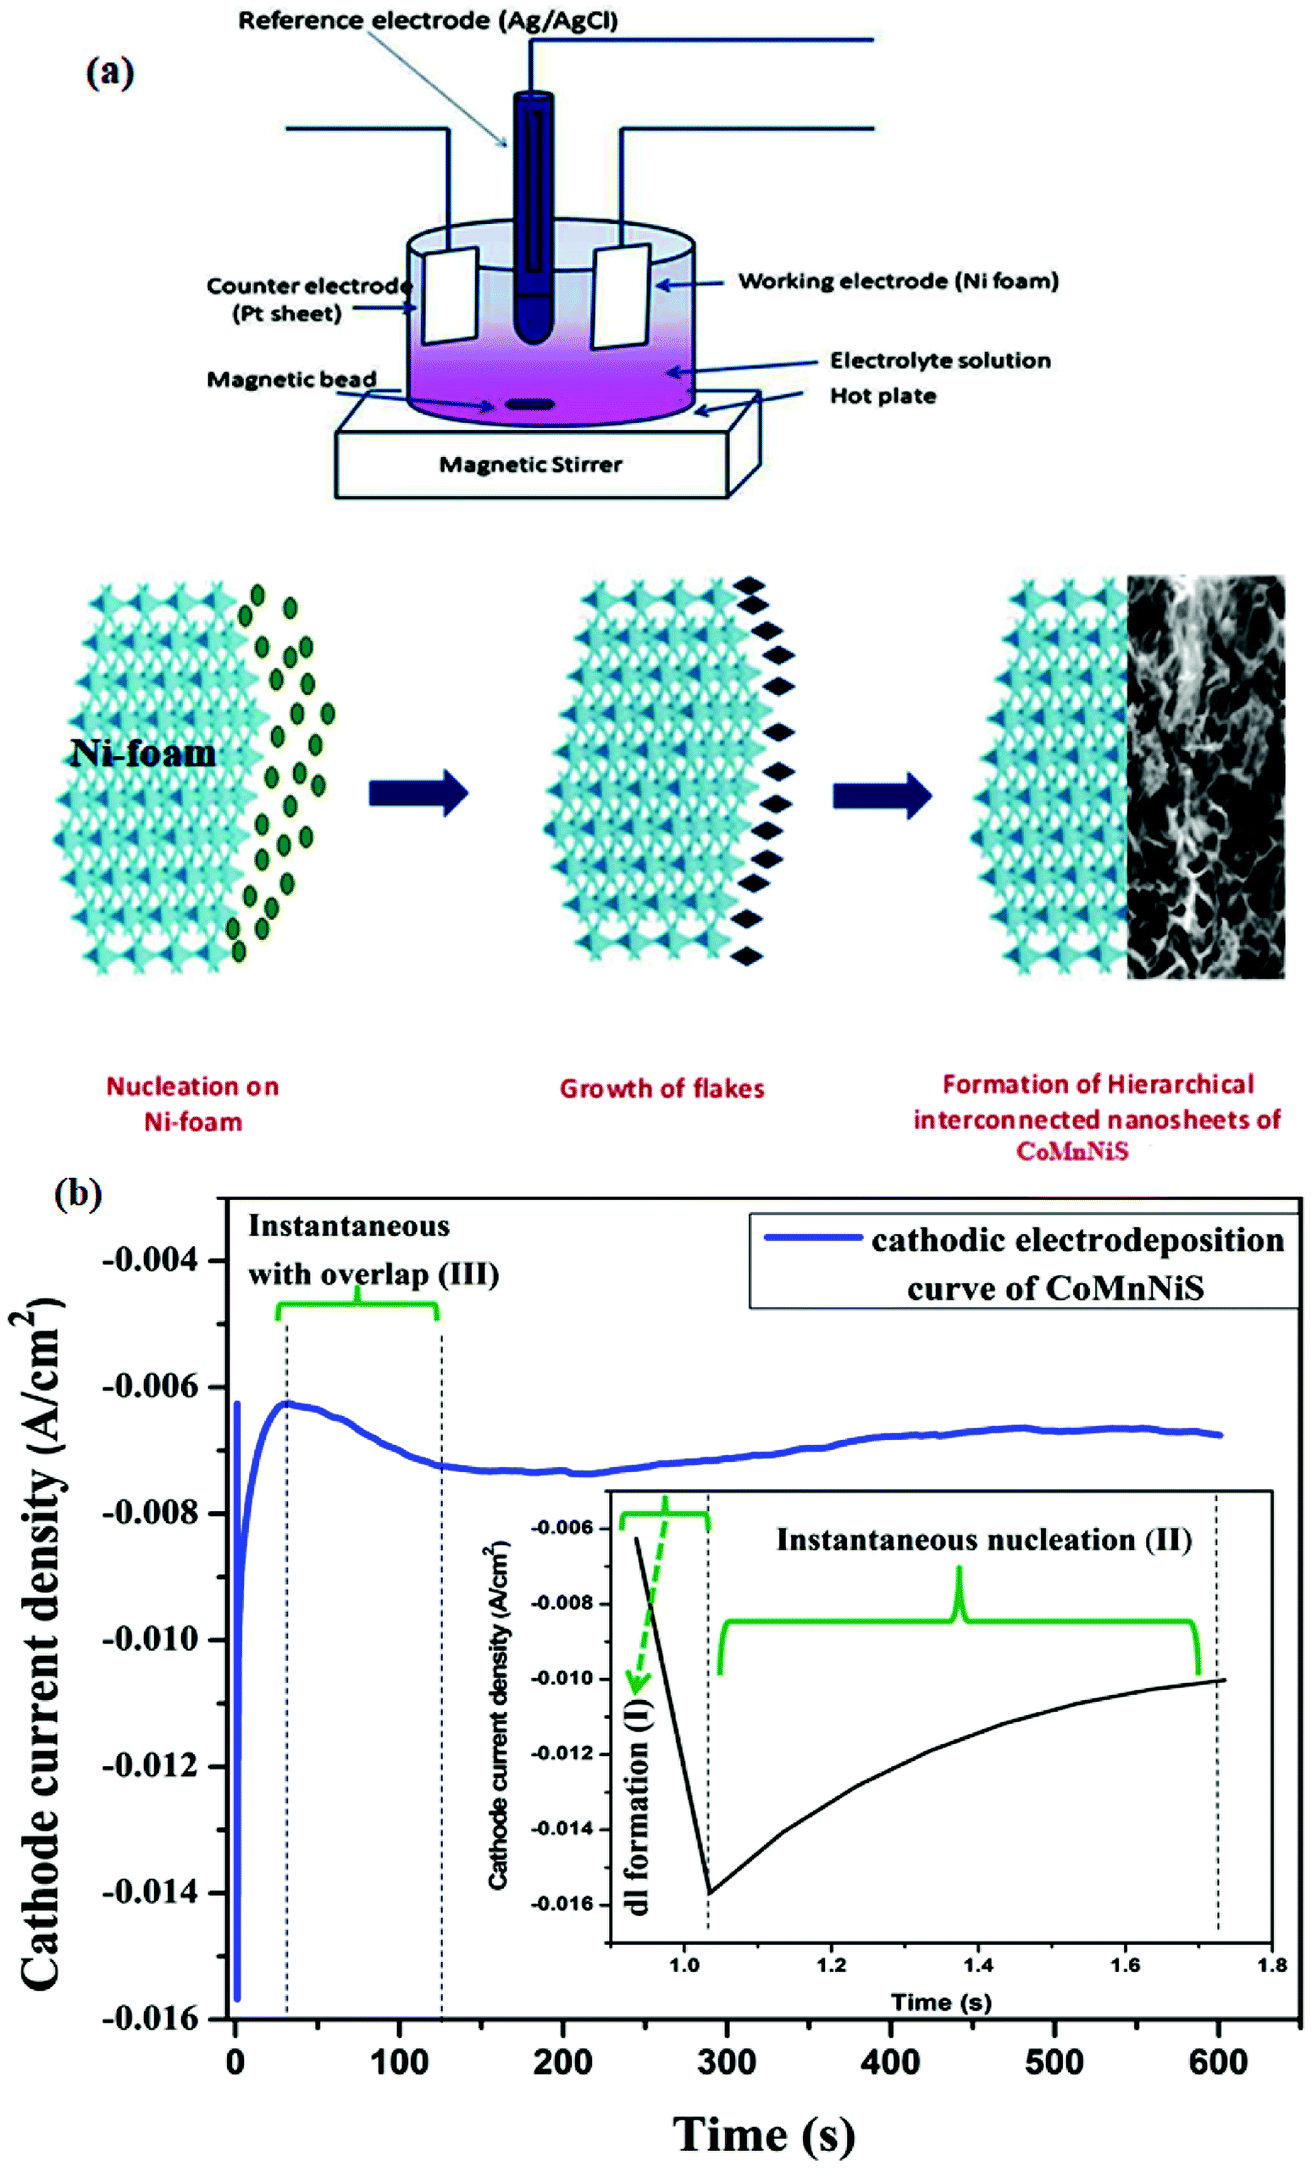 | ||
| Fig. 1 (a) Experimental arrangement for electrodeposition and schematic representation of CoMnNiS formation on Ni foam (b) cathodic electrodeposition curve of 10 min duration (chronoamperometry), indicating various processes taking place during deposition of CoMnNiS on Ni foam; (inset) magnified image of region I & II of the chronoamperometry curve. | ||
Fig. 1(b) shows the variation of transient cathodic current versus time, which essentially comprises three regions: (1) in the first region (I) a sudden drop of current is realized, which is due to double-layer formation at the beginning of the deposition process; (2) the second region (II), showing an electron transfer process with electroactive species i.e. formation of nuclei; and the (3) third region (III), showing growth and overlap, or the formation of an electroactive area after nuclei formation. This trend of the curve can be explained on the basis of instantaneous and progressive nucleation. In the former process nuclei are formed at the beginning of the electric pulse on active surface sites, while in the latter case simultaneous nuclei are formed during a continuous crystal growth process.24–28
The behavior of the curve in region II, shown in the inset of Fig. 1(b) (i vs. t), corresponds to instantaneous nucleation of particles on Ni foam, thereby increasing the total surface area of the working electrode. The maximum current is due to the overlap of diffusion zones formed around growing particles while the decreasing current behavior follows the Cottrell equation for planar diffusion.5 The formation of an HIN of CoMnNiS (SEM micrograph) can be explained on the basis of the applied reduction potential and the additives25 used in the electrodeposition process. By changing the reduction potential, the concentration of OH− ions at the electrode can be changed, which in turn influences pH of the solution as an increase in OH− will increase its pH. Thus the electrostatic field acting on the ions and the reaction kinetics govern the deposition of ions on the irregular 3D Ni foam. The above analysis of the electrodeposition curve confirms the deposition of electrolyte species on Ni foam, allowing further study.
3.2 Structural and phase confirmation by X-ray diffraction (XRD)
The X-ray diffraction (XRD) pattern of electrodeposited CoMnNiS on Ni foam is shown in Fig. 2. Below 2θ = 35° no peaks were seen. The diffraction peaks with 2θ values of 43.86° correspond to planes (422) of NiS2 and (221) of MnS2; those at 51.06° correspond to plane (440) of Co9S8 and (222) of MnS2; and those at 75.78° correspond to plane (422) of MnS2.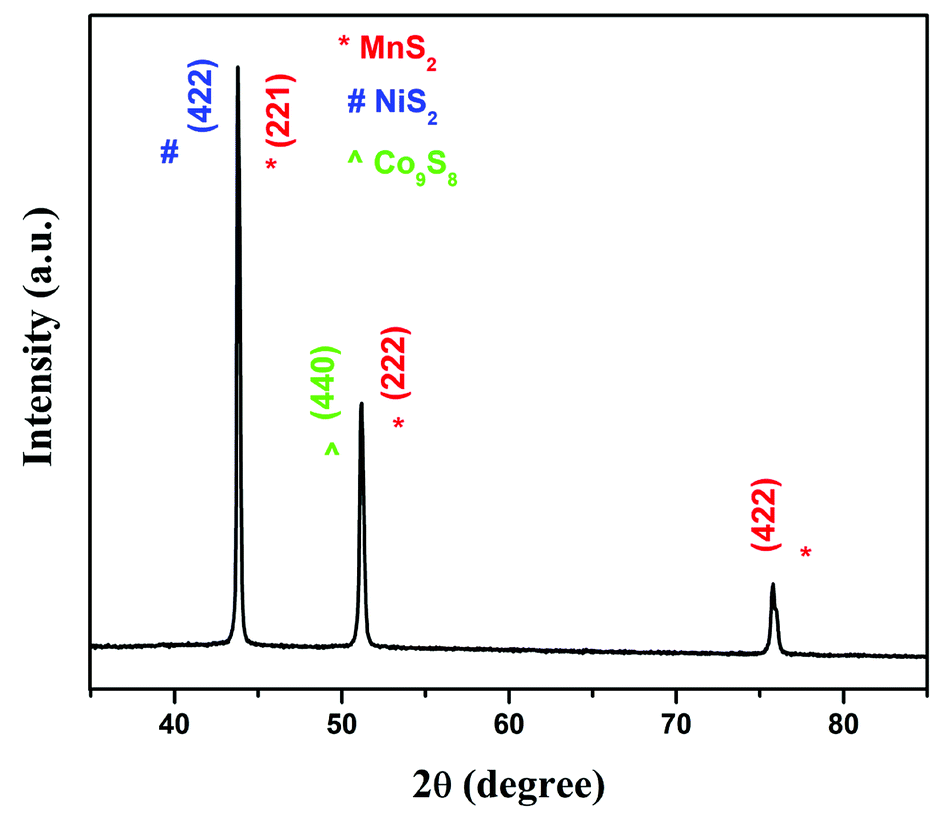 | ||
| Fig. 2 XRD pattern of CoMnNiS sample synthesized by electrodeposition technique. | ||
The crystal structures of all these materials are found to be cubic with calculated lattice constants NiS2: cubic a = b = c = 5.618 Å (JCPDS card no. 01-080-0375); Co9S8: cubic a = b = c = 9.905 Å (JCPDS card no. 01-075-2023) and MnS2: cubic a = b = c = 6.107 Å (JCPDS card no. 01-076-2051). Co, Mn and Ni differ only slightly in their atomic radii, and substitution of one for the other in a sulfide will have little influence on the crystal structure.29 Therefore, the diffraction peaks of sulfides containing Co, Mn and Ni are found to be overlapping. The composite of these metals in sulfide form is expected to favor the formation of more electroactive species involved in electrochemical processes, i.e. oxidation and reduction (states), governing the charge storage behavior of the CoMnNiS electrode.
3.3 Morphology studies by FESEM and HRTEM
The surface morphology of the CoMnNiS electrode was analyzed through FESEM at different magnifications. Fig. 3 shows the formation of an HIN-like structure of CoMnNiS where the HIN structures group to form flower-like structures composed of sheets of thickness 25 nm with porous architecture. The growth of such HIN structures on the surface and in-plane offers large active surface area, favors fast electron transfer and more active sites for electrolyte species for efficient ion/mass transport. The HRTEM micrograph presented in Fig. 4(a) confirms the FESEM image by showing a flake-like structure, which provides high surface area due to the presence of sulfur. Fig. 4(b) presents nano-size metal species and Fig. 4(c) shows the SAED pattern, representing the polycrystalline nature of the sample; the diffraction spots marked (221) and (422) correspond to NiS2 and MnS2, and can be further correlated with the XRD results, supporting the presence of these crystal structures in the sample. These HIN structures are expected to exert a synergetic effect, leading to high electrochemical performance of this material in terms of energy storage.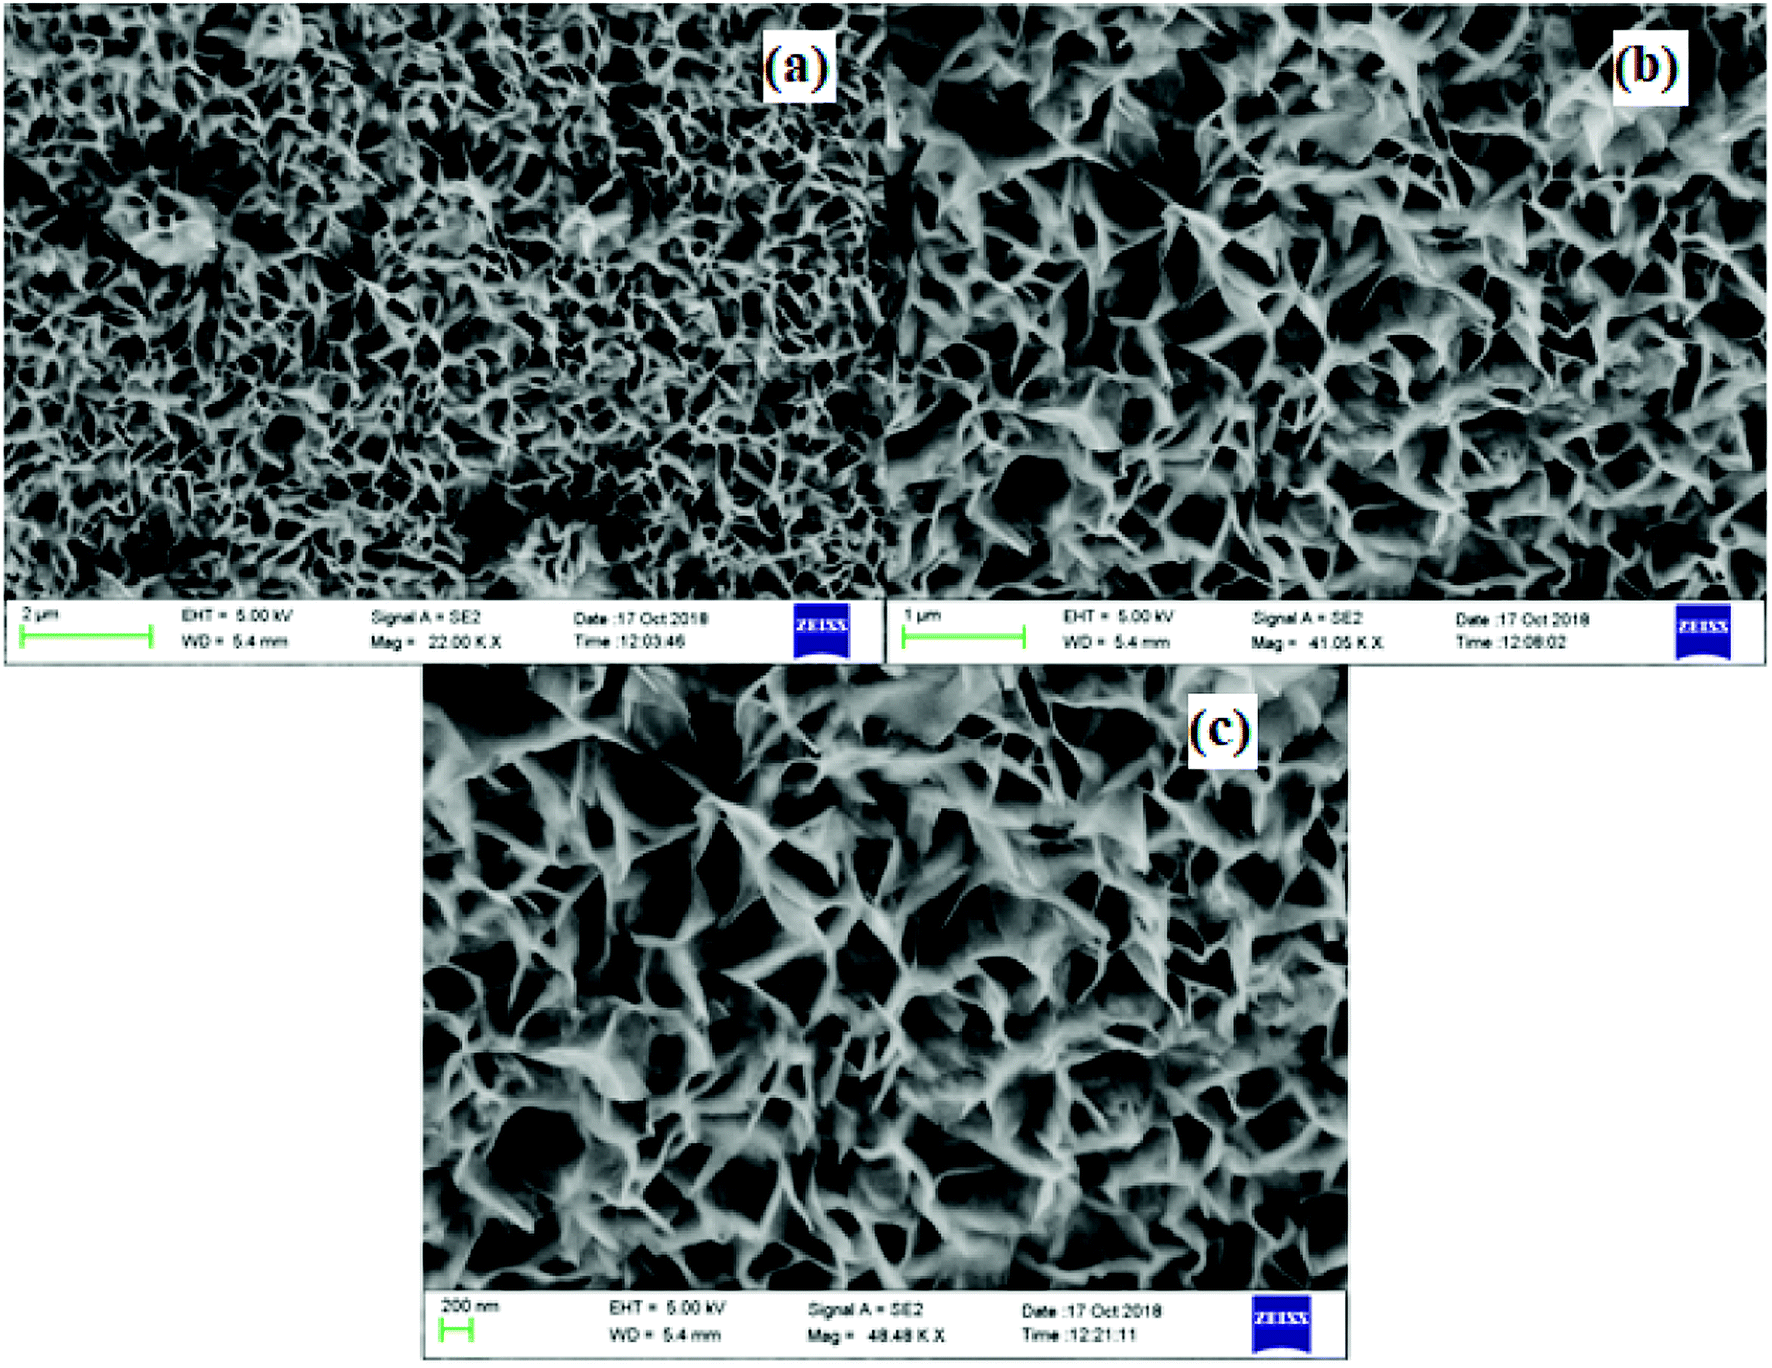 | ||
| Fig. 3 FESEM images (a–c) of CoMnNiS sample showing hierarchical interconnected nanosheets-like morphology at different magnifications (2 μm to 200 nm). | ||
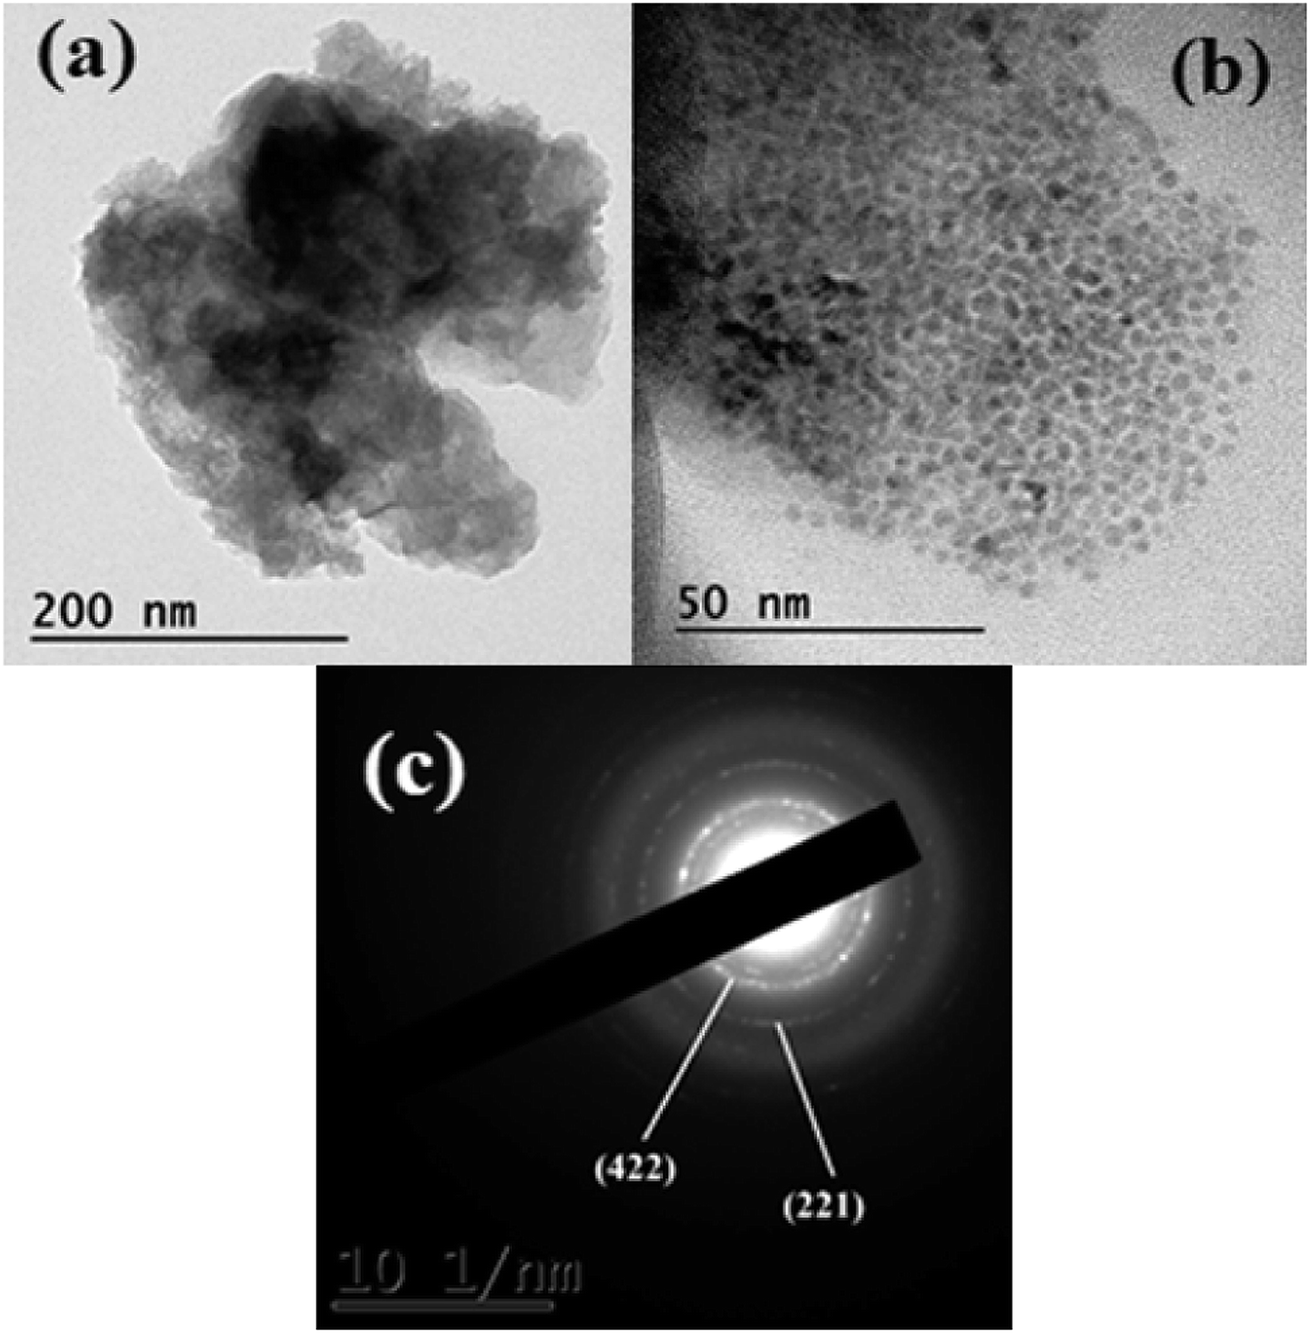 | ||
| Fig. 4 TEM and HRTEM images of CoMnNiS sample (a) high and (b) low resolution (c) SAED pattern showing various diffraction planes, i.e. (221) of NiS2 and (422) of MnS2. | ||
3.4 X-ray photoelectron spectroscopy
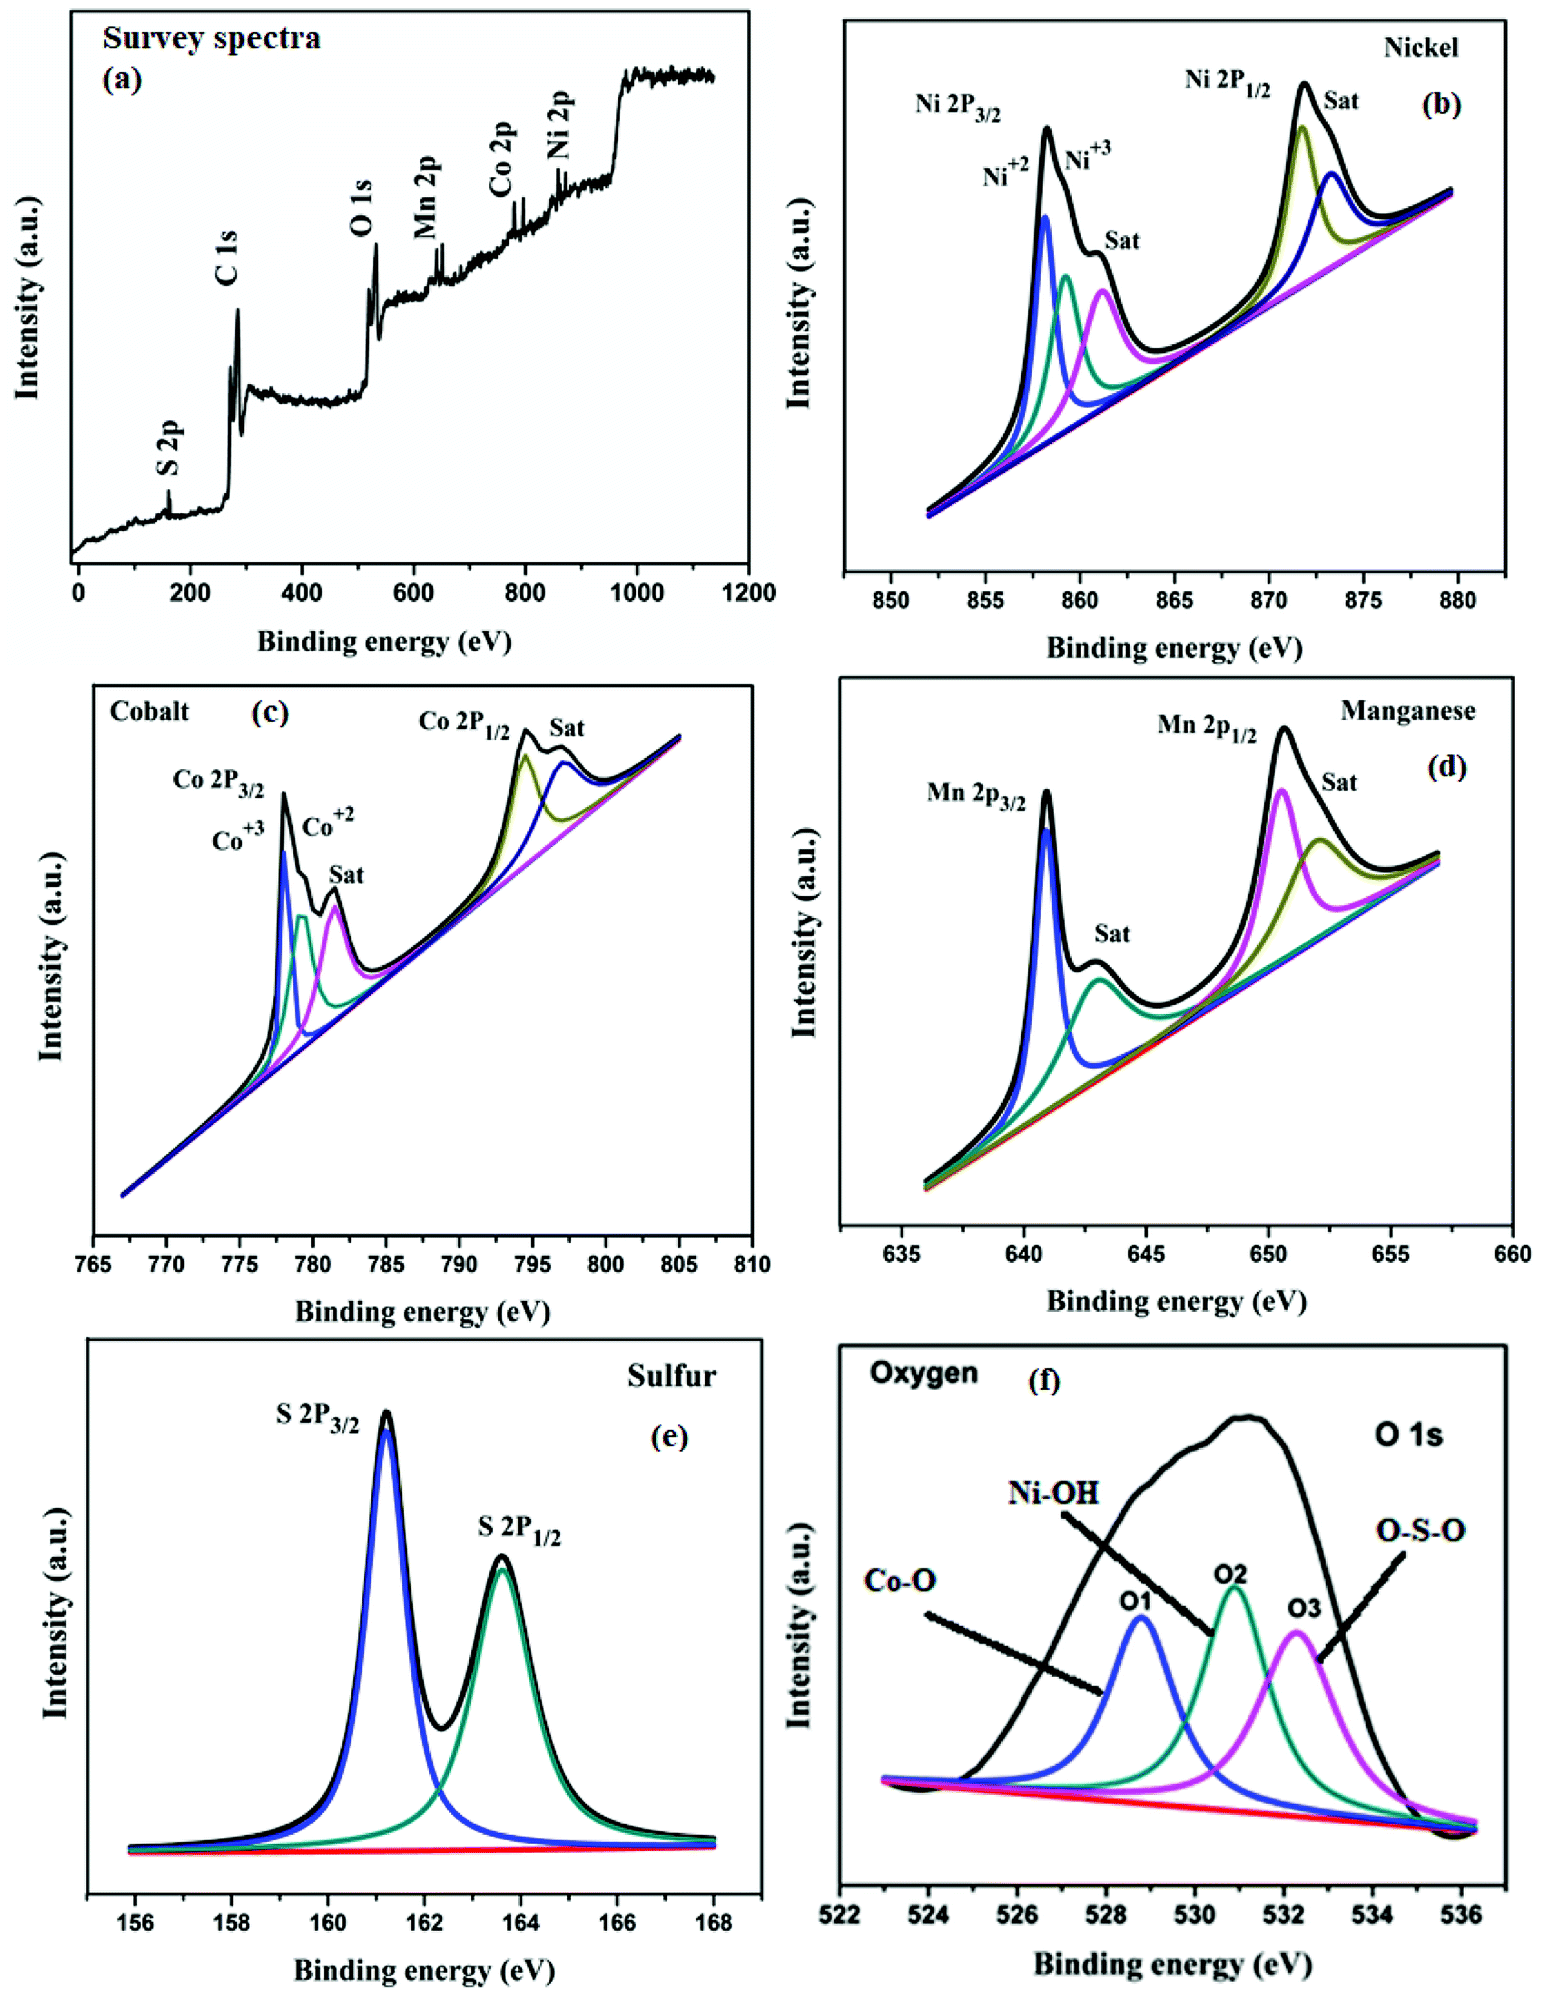
X-ray photoelectron spectroscopy (XPS) was used to investigate the chemical states of the CoMnNiS sample as given in Fig. 5. Fig. 5(a) depicts the survey spectra of the synthesized nanomaterial. It shows the presence of Co, Mn, Ni and S in the sample. In Fig. 5(b), the Ni 2p peak splits as a result of spin–orbit splitting into two intense peaks, 2p3/2 (858.18 eV) and 2p1/2 (871.5 eV), having separation ΔNi = 13.32 eV, thus showing the presence of the Ni2+ state. The multiplet-splitting of the 2p3/2 peak (858 eV) shows the presence of Ni3+, which reveals distinct peaks at 858.1 and satellite peaks located at 861 and 873.8 eV. In Fig. 5(c), Co shows splitting similar to Ni, due to spin–orbit splitting, with the first peaks 2p3/2 at 778.2 eV and 2p1/2 at 794.5 eV representing the presence of Co3+. The band of 2p3/2 at 778.5 eV shows the existence of Co2+ states,30,31 while the lower region of the 2p1/2 peak can be related to the formation of CoNi at 793.5 eV. In Fig. 5(d), Mn shows two distinct peaks corresponding to 2p3/2 and 2p1/2 located at 640.94 and 650.5 eV (ΔMn = 9.58 eV), indicating the presence of Mn2+. In Fig. 5(e), sulfur shows a peak at 161.2 eV corresponding to 2p3/2 of Ni/S and Co/S and a peak at 163.8 eV corresponding to 2p1/2 of MnS. From the above analysis, the existence of multiple oxidation states of Ni and Co can be found. Fig. 5(f) shows the presence of oxygen, and the O 1s core spectra can be fitted with three peaks, which can be mapped as O1 corresponding to NiO and Mn2O3 (528.8 eV); similarly O2 and O3 correspond to Co(OH)2 and Ni(OH)2 (530.8 eV), and to C![[double bond, length as m-dash]](https://www.rsc.org/images/entities/char_e001.gif) O (532.8 eV) and (CH)2SO2, respectively.
O (532.8 eV) and (CH)2SO2, respectively.
 | ||
| Fig. 5 XPS spectra of CoMnNiS sample (a) survey and (b–f) showing various chemical states of the constituent elements including Ni, Co, Mn, S and O present in the sample. | ||
The formation of these species takes place during the electrodeposition process in the KOH electrolyte. The availability of different oxidation states is expected to favor the redox reaction taking place in the electrochemical process, and influences the charge storage behavior of material. Moreover the bonding of NiCo, Ni/S, Co/S and MnS supports the XRD results, i.e. the formation of CoMnNiS material. The atomic percentages (at%) of Mn, Co, Ni, S, C and O calculated from XPS were found to be 0.62, 0.30, 0.18, 0.08, 79.61 and 19.21% respectively.
3.5 Electrochemical studies for energy storage
Cyclic voltammetry (CV) measurements were carried out to study the electrochemical and redox behavior of HIN CoMnNiS electrodeposited on Ni foam in 2 M KOH electrolyte solution. CV scans were conducted at varying scan rates from 1 to 90 mV s−1 in a fixed potential window of −0.1 to 0.4 V, as shown in Fig. 6(a). The CV of the CoMnNiS electrode possesses a non-rectangular shape, asymmetric, having three strong redox peaks, indicating that the capacitive behavior of the electrode is different from an electric double-layer.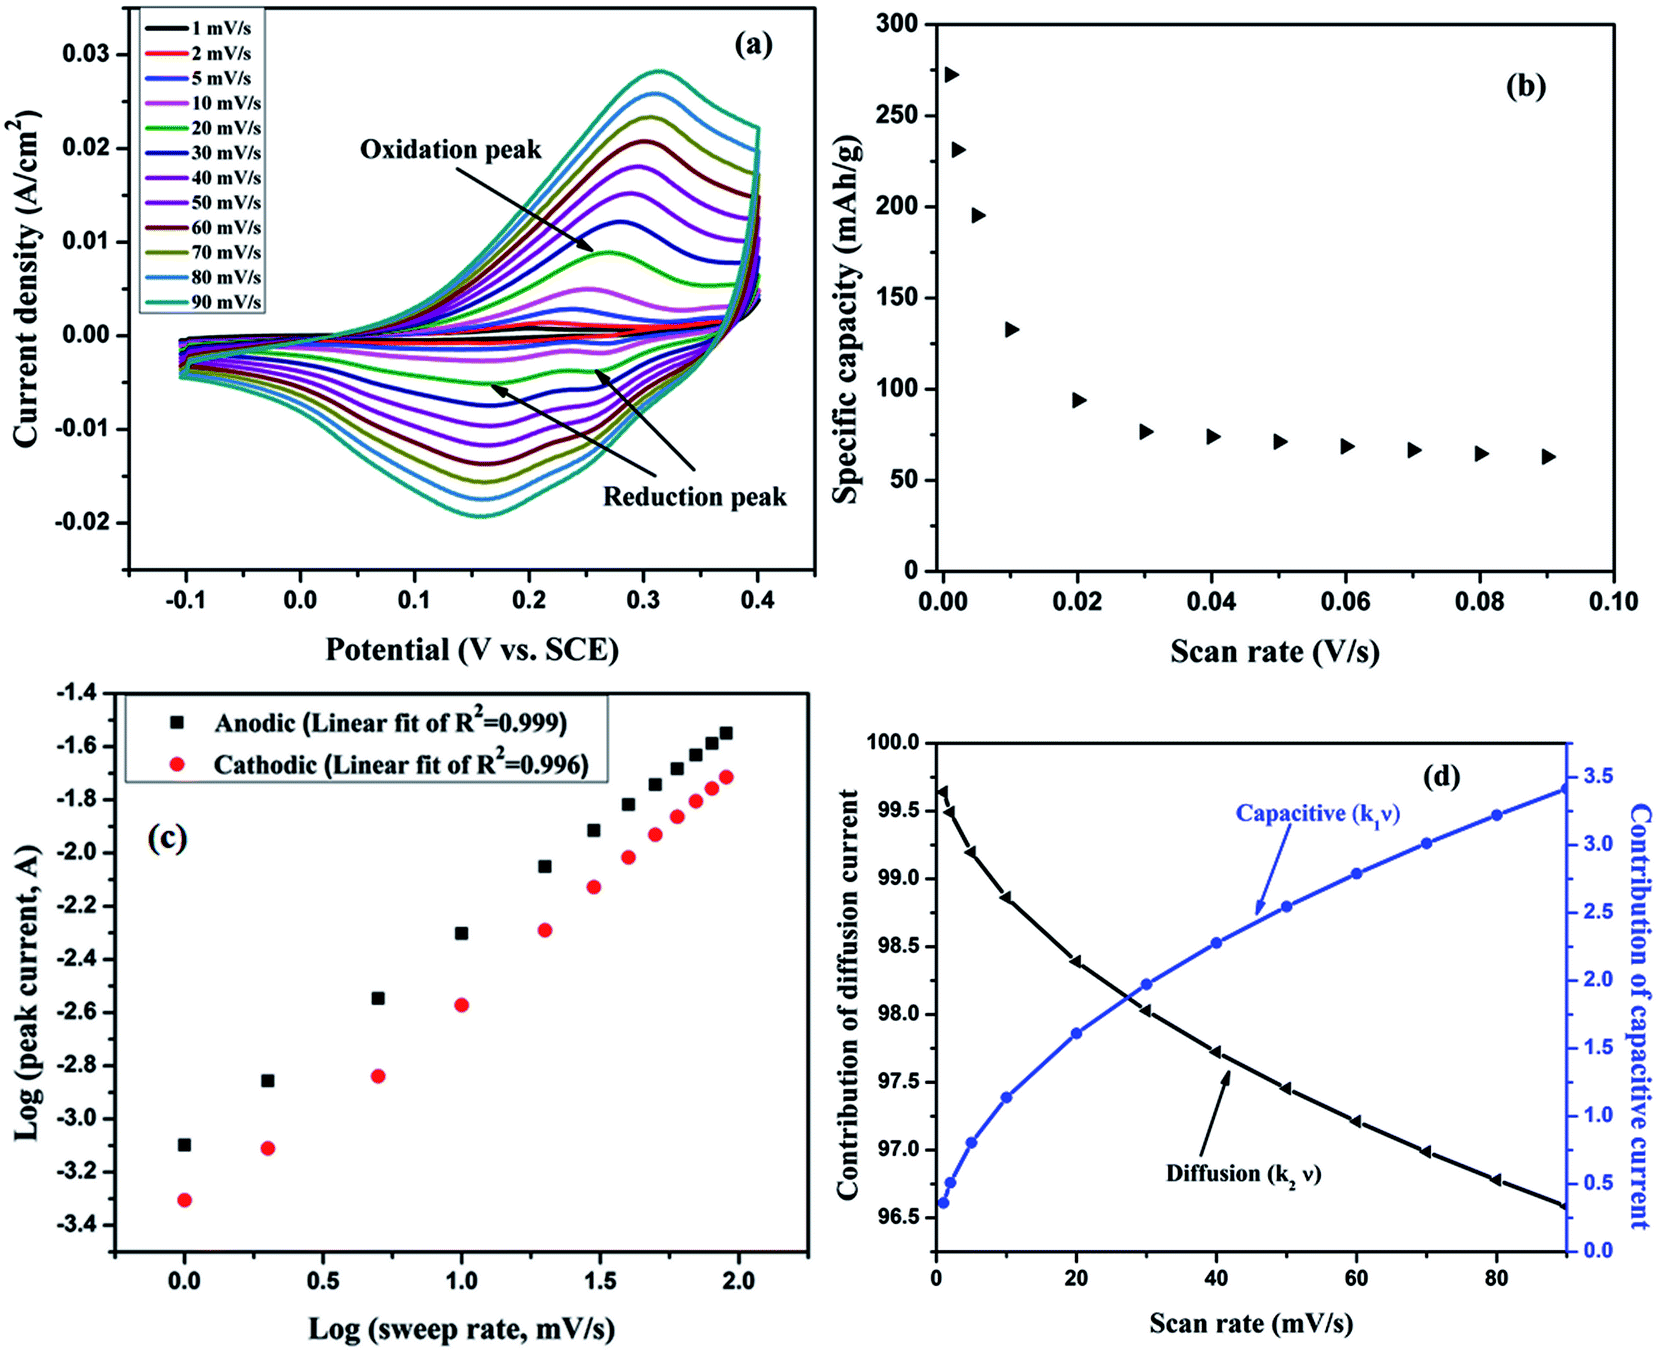 | ||
| Fig. 6 Cyclic voltammetry of CoMnNiS electrode (a) CV curve at various scan rates in the range 1–90 mV s−1 showing oxidation and reduction peaks, (b) plot of variation of specific capacitance vs. scan rate (1–90 mV s−1), (c) plot of log(peak current, A) vs. log(sweep rate, mV s−1) showing linear behavior (d) plot of variation of diffusion and capacitive current vs. scan rate. | ||
The oxidation peak, EPa = 0.23 V, can be related to nickel and similarly the reduction peaks at EPc = 0.16 and 0.27 V correspond to conversion of cobalt32,33 and nickel34 from one state to another (Ni2+ ↔ Ni3+ and Co2+ ↔ Co3+). The small difference ΔEac between anodic and cathodic peaks favors the reversibility and pseudocapacitive property35 of the electrode, leading to a fast reversible redox mechanism. As the scan rate increases, the anodic peak (oxidation) in the CV shifts towards more positive potential, i.e. from 0.225 to 0.3 V, due to a redox reaction mechanism governed by a charge transfer mechanism.5 The cathodic peak (reduction) shows almost no shift; the broad nature of the redox peaks can be related to high conductivity, as seen in conducting polymers,37 and to the intercalation nature of pseudocapacitive materials36 involving a faradaic mechanism without any phase change.
The shape of the CV remains the same with increasing scan rate (1–90 mV s−1), which shows the fast charge–discharge behavior of the material.33 An increase in bounded area with increasing scan rate can be related to the rapid diffusion of ions in KOH electrolyte. The electrochemical reactions taking place can be attributed to a reversible faradaic redox nature. A plausible mechanism can be represented by:
| NiS + OH− ↔ NiSOH + e− |
| NiSOH + OH− ↔ NiSO + H2O + e− |
| MnS + OH− ↔ MnSOH + e− |
| MnSOH + OH− ↔ MnSO + H2O + e− |
| CoS + OH− ↔ CoSOH + e− |
| CoSOH + OH− ↔ CoSO + H2O + e− |
The specific capacity of the HIN CoMnNiS electrode was calculated from the relation shown in ESI.† The variation of specific capacity with different scan rates is shown in Fig. 6(b); the highest value of specific capacity of 272.5 mA h g−1 is obtained at 1 mV s−1, which decreases to 61.3 mA h g−1 at 90 mV s−1. This high value of specific capacity can be attributed to the ultrathin HIN structure of the CoMnNiS electrode, which offers large surface area and highly porous structure for the rapid diffusion of electroactive species during the charge transport process.37 Moreover, the presence of different valence states of Ni, Co and Mn obtained from the XPS results supports the high electrical conductivity of the sample, due to the presence/conversion of more ionic species in the electrolyte and interchange of states. The metals also act as self-dopants due to the very similar ionic radii of the species involved in the electrochemical process. Meanwhile, the decrease in specific capacity with increase in scan rate can be accounted for by the weakened interaction of electrolyte ions with the metal species.
The total peak current measured from the CV scan rates can be divided into diffusion-controlled (idiff) and capacitive current, which are required for charging the double layer at the electrolyte interface or initiating faradaic reactions on the surface of the electrode (icap),37,38 respectively. Therefore the dependence of total peak current (ip) on scan rate (ν) can be expressed by eqn (2)–(5) with parameters a and b, as shown in ESI.36,37† Calculation of b provides information about the type of material i.e. pseudocapacitive or battery. The value of b is obtained from the slope of a linear plot of log(i) versus log(ν), which provides information about the reaction kinetics taking place at the electrode. Generally, b has a value of 1 or 0.5, where a value of b ∼ 1 indicates the role of surface redox reactions and the charging/discharging process of an electric double layer capacitor while b ∼ 0.5 indicates a slow semi-infinite diffusion-controlled faradaic mechanism taking place in bulk material, i.e. battery type behavior.38
The value of b calculated from Fig. 6(c), i.e. plot of log(−i) versus log(ν), is found to be 0.79 for the anodic peak and 0.83 for the cathodic peak. This indicates a greater contribution of capacitive current to the total current, which is also supported by the broad peaks (oxidation/reduction) in the CV of the HIN CoMnNiS electrode. In order to characterize the charge storage mechanism, the total current can be further expressed as a sum of the diffusion-controlled (∝ to ν) and the capacitive process (∝ to ν0.5). The slope of a linear plot of ip(v)/ν0.5 versus ν0.5 at different scan rates can be used to calculate the contribution ratio of capacitive (k1) and diffusive (k2) component to the total current, as shown in Fig. 6(d). It can be seen that as the scan rate increases, the contribution of the capacitive process continually increases while that of the diffusion-controlled process decreases.
GCD measurements of the HIN CoMnNiS electrode were carried out in the potential window of 0–0.37 V at different current densities ranging from 2.5 to 75 A g−1, shown in Fig. 7(a). The charge–discharge profiles of the HIN CoMnNiS electrode show sloped plateaus, i.e. a mixed state of a regular triangular profile (indicating an electric double layer capacitor, EDLC) and a plateau (indicating a pseudocapacitor), with long charging/discharging time. This can be attributed to the mixed pseudocapacitive/battery type behavior of the electrode and can be related to MnS2![[thin space (1/6-em)]](https://www.rsc.org/images/entities/char_2009.gif) 39 possessing a layered structure, enabling diffusion of electrolyte and intercalation of ionic species. The highest specific capacity of 257.4 mA h g−1 (Fig. 7(b)) was achieved at a current density of 2.5 A g−1 (calculated from eqn (6) as shown in ESI†). This high value of specific capacity can be attributed to the HIN structure of the electrode material, which favors high accessible surface area for diffusion of charged species on the surface of the HIN nanosheets of the CoMnNiS electrode. This provides a path for the rapid transport of electrons/ions through intercalation-deintercalation40,41 between sulfide layers.
39 possessing a layered structure, enabling diffusion of electrolyte and intercalation of ionic species. The highest specific capacity of 257.4 mA h g−1 (Fig. 7(b)) was achieved at a current density of 2.5 A g−1 (calculated from eqn (6) as shown in ESI†). This high value of specific capacity can be attributed to the HIN structure of the electrode material, which favors high accessible surface area for diffusion of charged species on the surface of the HIN nanosheets of the CoMnNiS electrode. This provides a path for the rapid transport of electrons/ions through intercalation-deintercalation40,41 between sulfide layers.
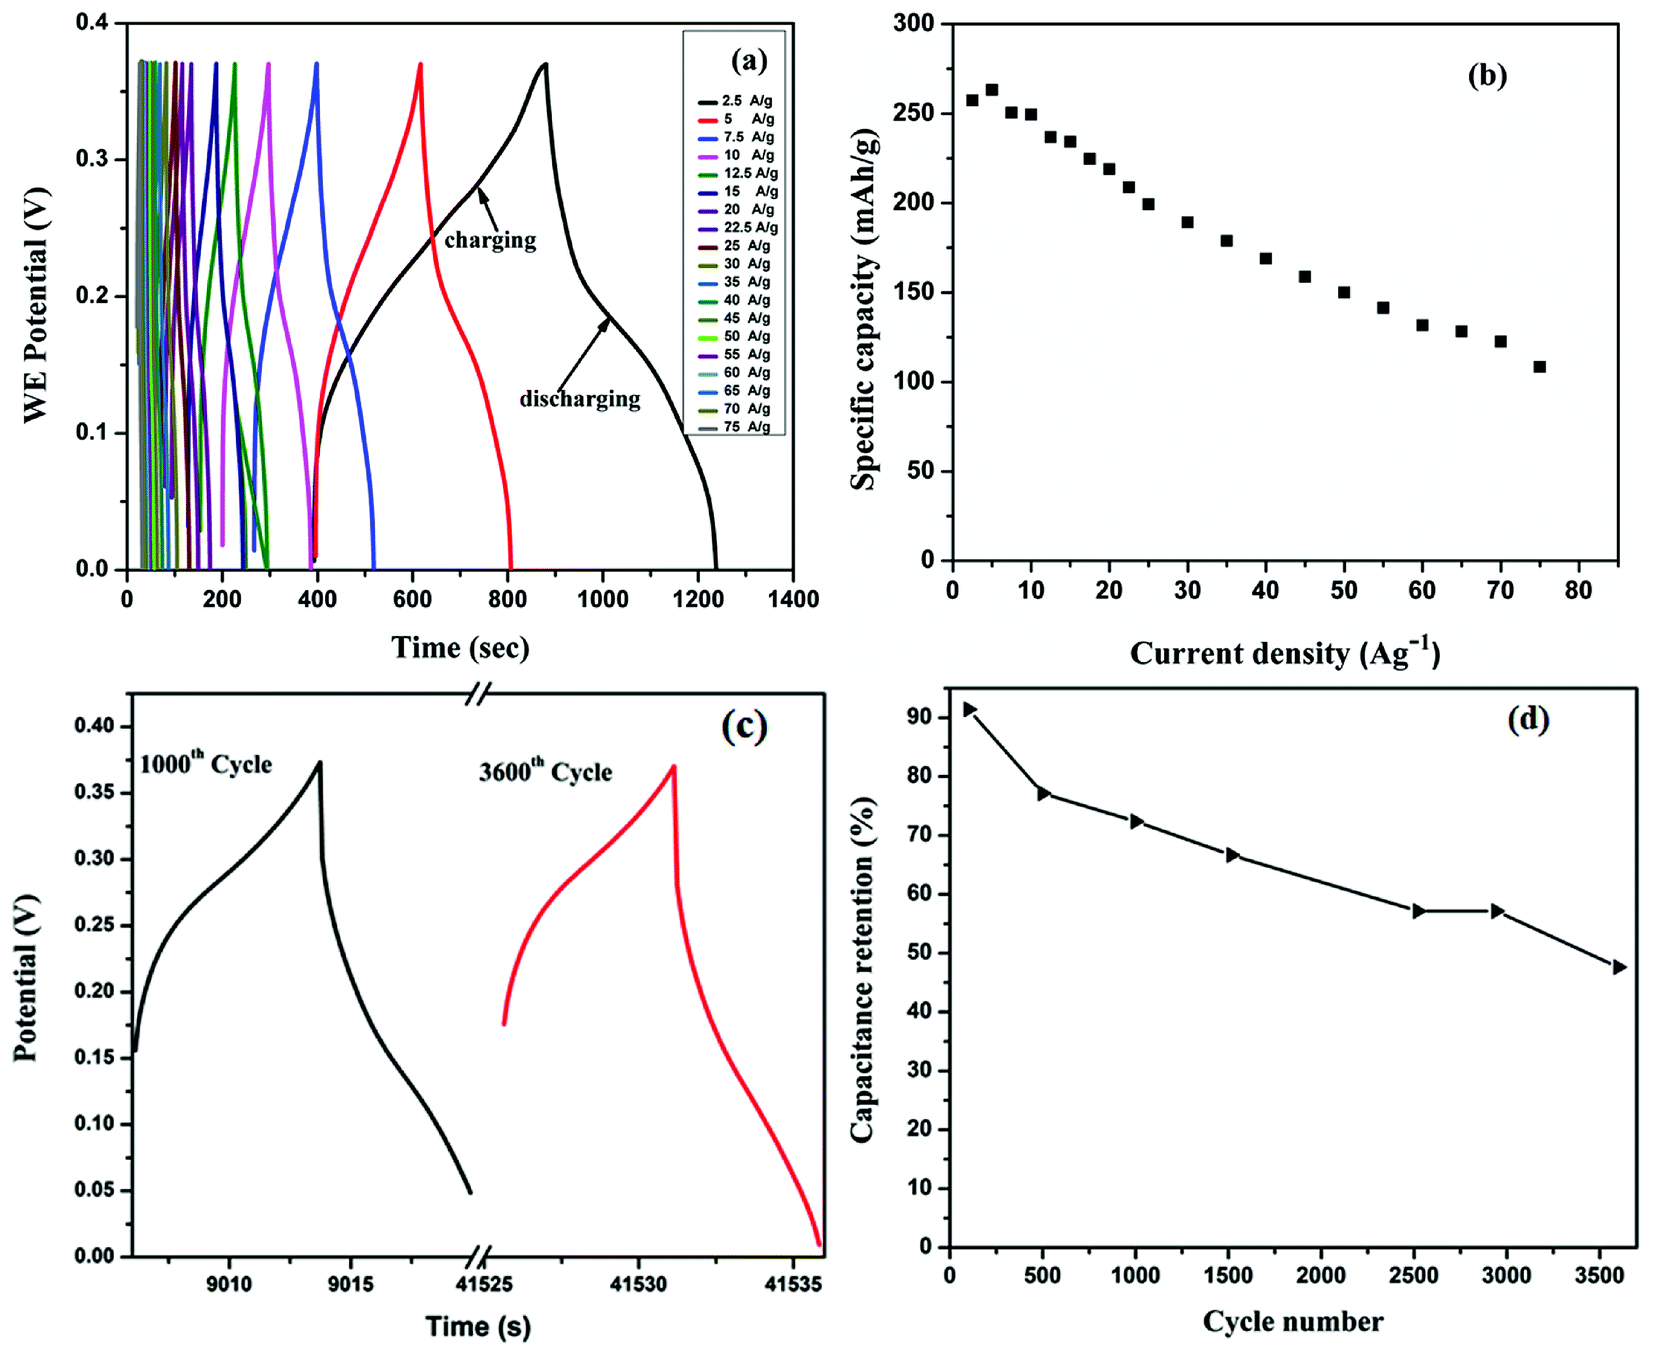 | ||
| Fig. 7 Galvanostatic charge–discharge of CoMnNiS electrode (a) GCD profiles at various current densities (b) plot of specific capacitance vs. current densities (2.5–75 A g−1) (c) cyclic stability curve at different cycles at 50 A g−1 (d) plot of capacitance retention vs. no. of cycles at 50 A g−1. | ||
The rate capability, i.e. relationship between calculated specific capacity and current density, of the CoMnNiS electrode is shown in Fig. 7(b). The electrode delivers a high specific capacity of 257.4, 199.3, 150 and 108.3 mA h g−1, at current densities of 2.5, 25, 50 and 75 A g−1 respectively. This behavior may be related to an incremental decrease in either the voltage or the amount of active material taking part in the redox process at high current densities. It may also be related to the diffusion and transport of OH− ions within the electrode material at high current density.42–44 All these support a high rate capability of 42% at a high current density of 75 A g−1 as calculated.
A difference in the values of specific capacity calculated from the CV and GCD techniques is seen, which can be explained on the basis that the phenomena taking place in the CV and GCD processes are quite different and independent. In CV the ions move rapidly over the surface with respect to the applied scan rate, whereas in GCD the material becomes fully charged to the level of the applied potential and discharges naturally (slowly) in the electrolyte environment. A comparison of the specific capacitance of Co-, Mn-, Ni-, and S-based nanostructured electrodes from the literature has been provided in the ESI Table S1.†
The cyclic stability of the CoMnNiS electrode was measured at a current density of 50 A g−1 for 3600 cycles, as shown in Fig. 7(c and d). The specific capacity of the CoMnNiS electrode remains about 48% after 3600 cycles, thus indicating an excellent performance of the electrode material and long-term stability at a high current density of 50 A g−1. This capacity retention behavior of the CoMnNiS electrode can be attributed to the diffusion length of ions and the long time period for which such high current densities are maintained, thereby reflecting that the external surface area of the electrode plays a major role in charge storage processes.45 Moreover, capacity retention also depends on the crystalline/amorphous nature of the electroactive material.46 Amorphous structures can endure a large structural change during redox reactions, leading to better cycling stability. Similar results were obtained by CV at different scan rates, i.e. the shape of the curve remains the same as its original shape; also, the redox peak maintains the same position, which demonstrates the excellent performance of the CoMnNiS electrode. Moreover, the shapes of the GCD curves remain unchanged with increasing current densities, which is a favorable sign for the high rate capacity and stability of the CoMnNiS electrode.
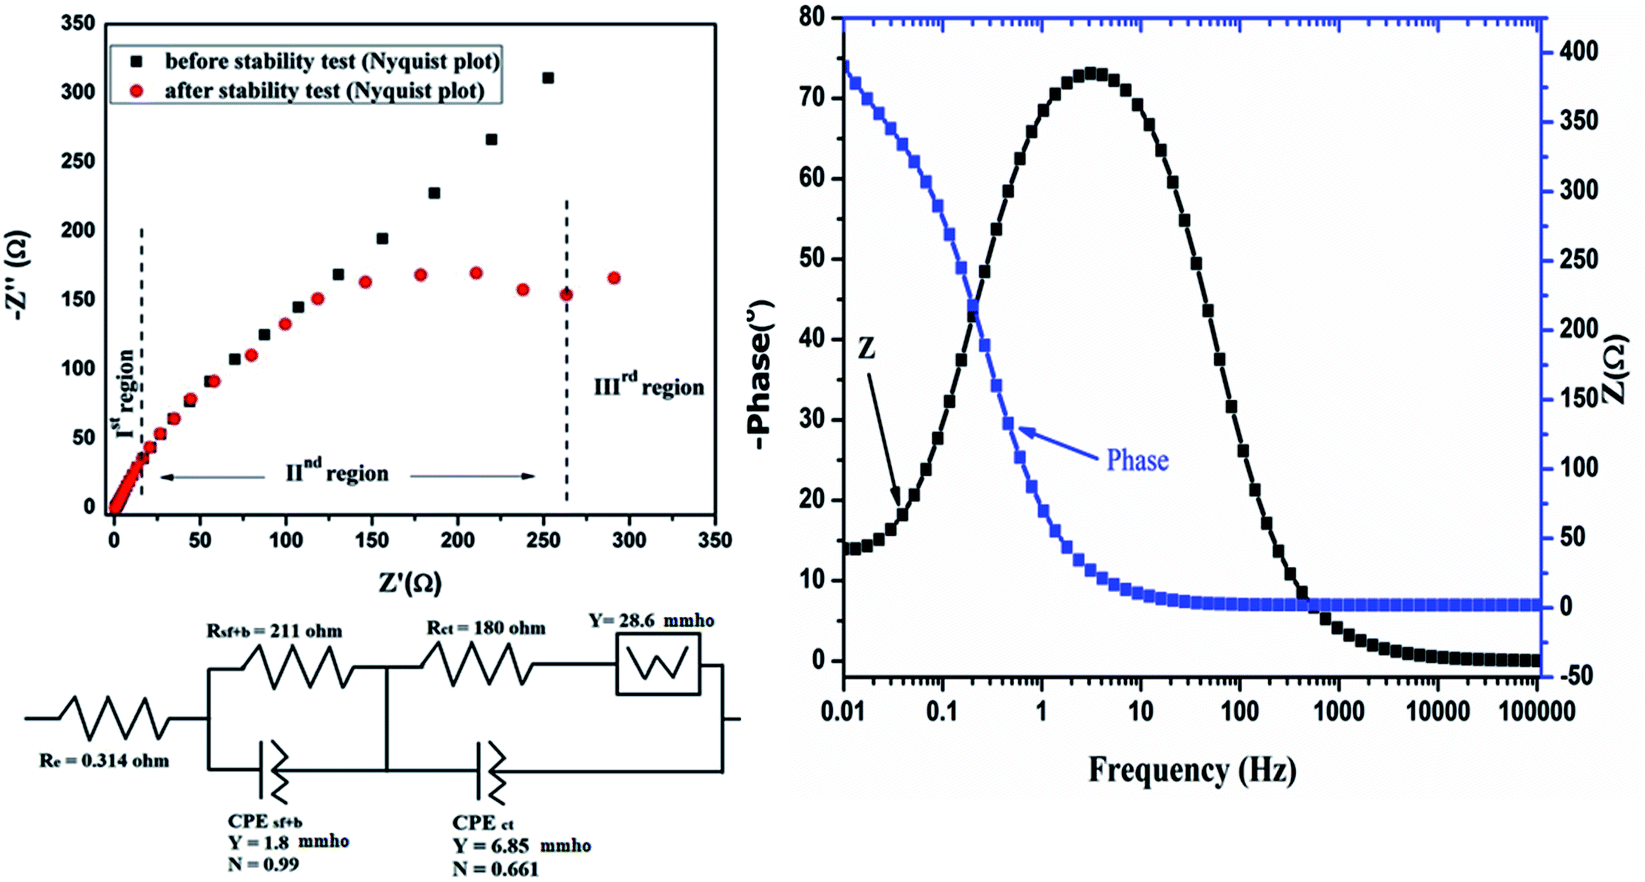
Electrochemical impedance spectroscopy (EIS) of the HIN CoMnNiS electrode was conducted before and after 3600 cycles of charge and discharge to gain an insight into the performance. Frequencies in the range within 100 kHz to 0.01 Hz with an imposed AC voltage of 10 mV in an open circuit model were applied to the CoMnNiS electrode. The Nyquist plot in Fig. 8(a) can be divided into three regions: the first region from 100 kHz to 0.1169 Hz (high frequency region), second region from 0.1169 to 0.0131 Hz and finally the remaining region.
 | ||
| Fig. 8 (a) EIS (Nyquist) plot of CoMnNiS electrode before/after stability measurement and Randles fitted circuit to after stability data (b) Bode plot showing the variation of Z and phase of CoMnNiS electrode with frequency. | ||
The fresh CoMnNiS electrode has almost linear behavior of Z′ vs. Z′′ with a small Warburg region. The CoMnNiS electrode after cyclic testing shows two semicircles, one in the high frequency region due to the porous nature of the surface of the electrode,47 and the other semicircle at the low frequency region showing a charge transfer process due to the electrode–electrolyte interface, and has a larger Warburg region.
Accordingly, the contribution to resistance can be divided into three regions of interest. The first is due to the electrolyte and cell (Re = 0.314 Ω), the second arises from the surface film and constant phase element (Rsf+b‖Csf+b i.e. 211 Ω‖1.8 mmho) (the latter part being due to the non-homogeneity of the CoMnNiS electrode) and the third is due to resistance transfer (Rct‖Cdl i.e. 180‖6.85 mmho) or diffusion processes. The low frequency region (for the electrode after the stability test) has scattered points showing an undeveloped Warburg region (28.6 mmho) due to a high charge transfer contribution. This is also supported by an increase of the diffusion current component as shown in Fig. 5(d). The small diameter of the EIS semicircle before the stability test shows the high conductivity of the CoMnNiS electrode; the values of the circuit elements fitted to the above data are shown in Fig. 8 below the EIS curve. A higher value of Rct after the cyclic test shows that the material is in a state of fast degradation, which can also be found from the shape of the EIS curve and from the variation of specific capacity vs. number of cycles (stability curve). A Bode plot of the HIN CoMnNiS electrode is illustrated in Fig. 8(b), showing the variation of Z and phase angle with frequency. A rise in phase angle to −66.25°, close to 90°, shows the capacitive behavior of the CoMnNiS electrode material. The above EIS results support the high performance of the CoMnNiS electrode in terms of charge transfer kinetics/electron transport behavior.
Asymmetric supercapacitor devices, based on the HIN CoMnNiS and NiCuO/CNT nanostructures, were tested; the CV and GCD profiles are shown in Fig. 9(a–d). The CoMnNiS/NiCuO device showed a maximum discharging time of 30.2 s at a current of 1 mA, Fig. 9(b). This device showed a maximum specific capacity of 20.8 mA h g−1 at 0.5 A g−1, which decreased to 1.5 mA h g−1 at 2 A g−1 (Fig. 9(e)), calculated from eqn (6) as shown in ESI.† Similarly, a CoMnNiS/CNT device was tested, which provided a specific capacity of 50.8 mA h g−1 at 0.63 A g−1, as shown in Fig. 9(e). The energy density and power density of the asymmetric HIN CoMnNiS/NiCuO device were calculated from eqn (7) and (8) as given in ESI† and shown in Fig. 9(f). The Ragone plot shows an energy density of 8.4 W h kg−1 corresponding to a power density of 985 W kg−1 at 0.5 A g−1, which decreases to 0.6 W h kg−1 with a power density of 3940.5 W kg−1 at 2 A g−1. Similarly, the CoMnNiS/CNT device shows an energy density of 6.3 W h kg−1 and power density of 211 W kg−1 at 0.63 A g−1.
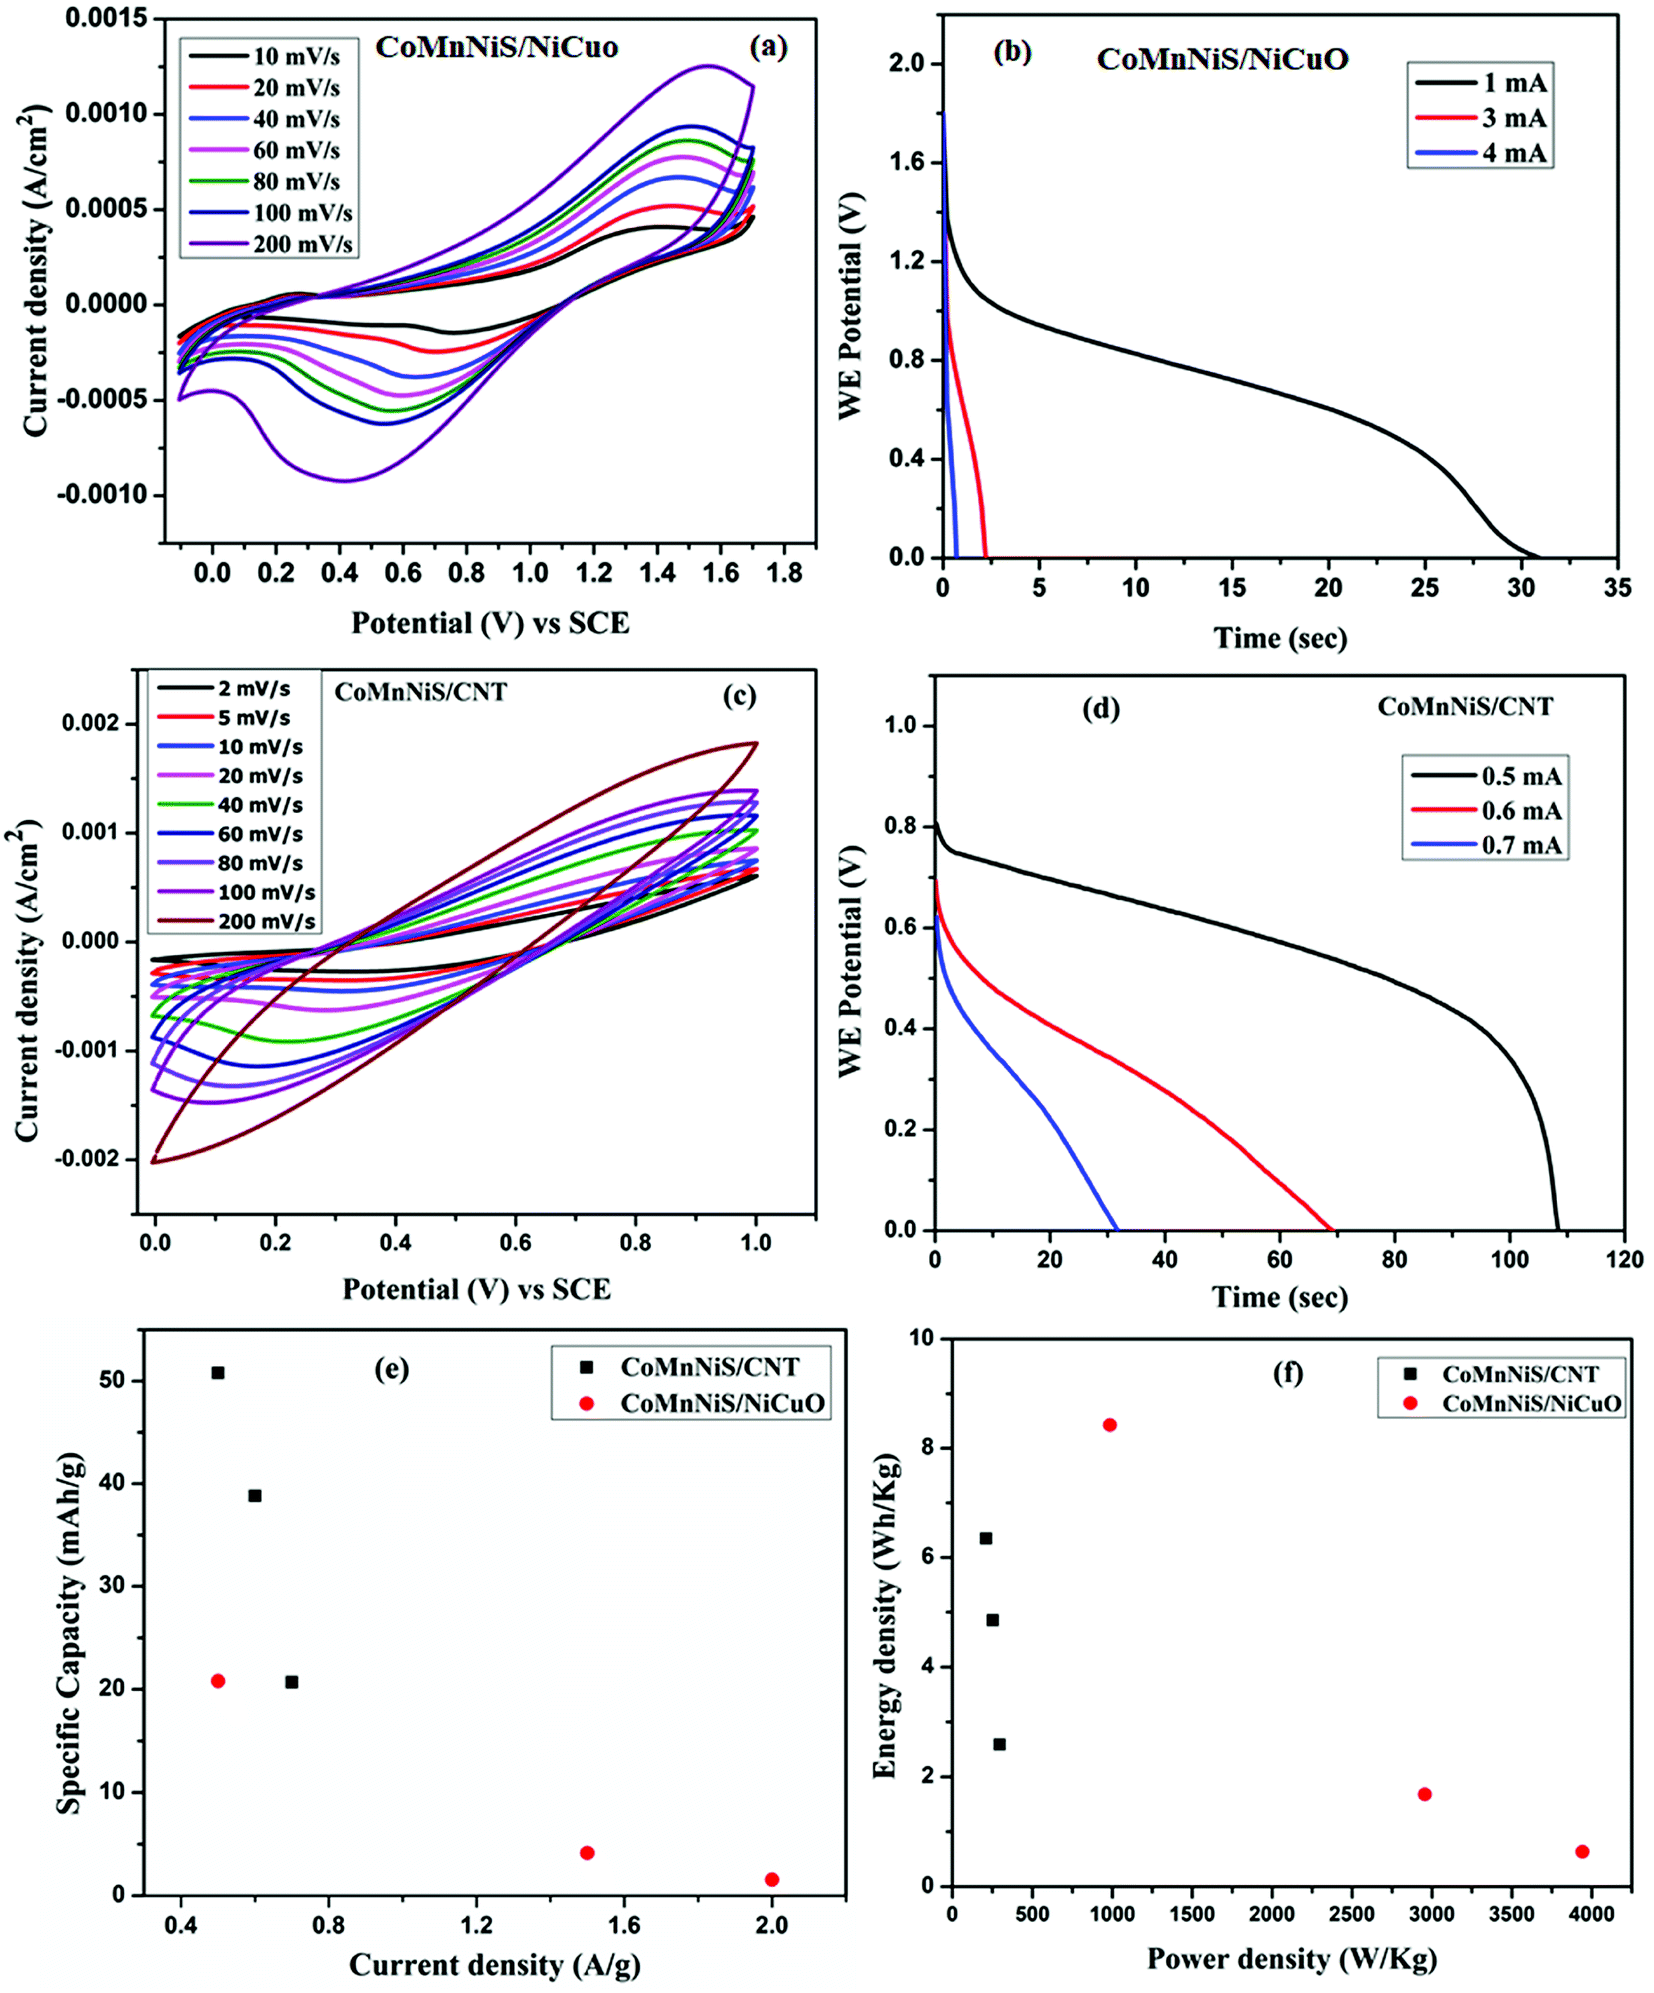 | ||
| Fig. 9 Asymmetric device (a) cyclic voltammogram and (b) discharge curves, at different scan rates and current for CoMnNiS/NiCuO (c) cyclic voltammogram and (d) discharge curves, at different scan rates and current for CoMnNiS/CNT. Comparison of the variation of (e) specific capacity with current density (f) energy density with power density (Ragone plot) of both the nanomaterials. | ||
The above-mentioned results of the HIN CoMnNiS electrode can be attributed to void spaces lying between the hierarchical interconnected structures, which confine the electrolyte between them. These open spaces also act as an ion/electrolyte reservoir, favoring electrolyte diffusion/rapid ion transport through them and allowing the device to withstand the volume change taking place during charge/discharge to retain high CoMnNiS electrode performance.
4. Conclusion
In summary, an HIN of CoMnNiS was synthesized by a simple and economical electrodeposition technique for energy storage. XRD of the nanostructure shows the presence of NiS2, MnS2 and Co9S8 in the cubic phase. FESEM and TEM images confirm an interconnected flower-like structure made from flakes having thickness of 25 nm, which possesses high surface area, porosity and high electrical conductivity. The CoMnNiS electrode showed high specific capacities of 272.5 mA h g−1 at a scan rate of 1 mV s−1 and 257.4 mA h g−1 at 2.5 A g−1 with capacity retention of 48% at 50 A g−1 after 3600 cycles of continuous charge–discharge. The CoMnNiS/NiCuO asymmetric supercapacitor device showed a specific capacity of 20.8 mA h at 0.5 A g−1 with an energy density of 8.4 W h kg−1 at a power density of 958 W kg−1. Similarly, the CoMnNiS/CNT device showed specific capacity of 50.8 mA h at 0.63 A g−1 with an energy density of 6.3 W h kg−1 at a power density of 211 W kg−1. These results show the influence of the surface charge storage mechanism along with mixed pseudocapacitance/battery type behavior of the CoMnNiS electrode.Conflicts of interest
Authors declare no conflict of interest.Acknowledgements
This work is funded through financial support received from CSIR, New Delhi (India) vide research grant no. 03(1349)/16/EMR-II. MV acknowledges fellowship of CSIR. Authors thank Director, Prof. Pradeep Mathur, IIT Indore, for motivating the research and SIC-IIT Indore for providing XRD and FESEM facilities.References
- R. Miller and P. Simon, Science, 2008, 321, 651–652 CrossRef PubMed.
- P. Simon, Y. Gogotsi and B. Dunn, Science, 2014, 343, 1210–1211 CrossRef CAS PubMed.
- J. R. Miller and A. F. Bruke, Electrochem. Soc. Interface, 2008, 17, 53 CAS.
- R. Kotz and M. Carlen, Electrochim. Acta, 2000, 45, 2483–2498 CrossRef CAS.
- P. Simon and Y. Gogotsi, Nat. Mater., 2008, 7, 845–854 CrossRef CAS PubMed.
- H. Zhang, X. Yu, D. Guo, B. Qu, M. Zhang, Q. Li and T. Wang, ACS Appl. Mater. Interfaces, 2013, 5, 7335–7340 CrossRef CAS PubMed.
- X. Huang, Z. Y. Zeng and H. Zhang, Chem. Soc. Rev., 2013, 42, 1934–1946 RSC.
- X. Meng, J. Deng, J. Zhu, H. Bi, E. Kan and X. Wang, Sci. Rep., 2016, 6, 21717 CrossRef CAS PubMed.
- M. Sathish, S. Mitani, T. Tomai and I. Honma, J. Phys. Chem. C, 2012, 116, 12475–12481 CrossRef CAS.
- X. Y. Yu and X. W. Lou, Adv. Energy Mater., 2018, 8, 1701592 CrossRef.
- R. N. Bulakhe, S. Sahoo, T. T. Nguyen, C. D. Lokhande, C. Roh, Y. R. Lee and J. J. Shim, RSC Adv., 2016, 6, 14844–14851 RSC.
- Z. Lv, N. Mahmood, M. Tahir, L. Pan, X. Zhang and J. J. Zou, Nanoscale, 2016, 8, 18250–18269 RSC.
- W. Kong, C. Lu, W. Zhang, J. Pu and Z. Wang, J. Mater. Chem. A, 2015, 3, 12452–12460 RSC.
- X. Li, J. Shen, N. Li and M. Ye, J. Power Sources, 2015, 282, 194–201 CrossRef CAS.
- M. Yan, Y. Yao, J. Wen, L. Long, M. Kong, G. Zhang, X. Liao, G. Yin and Z. Huang, ACS Appl. Mater. Interfaces, 2016, 8, 24525–24535 CrossRef CAS PubMed.
- S. Peng, L. Li, C. Li, H. Tan, R. Cai, H. Yu, S. Mhaisalkar, M. Srinivasan, S. Ramakrishna and Q. Yan, Chem. Commun., 2013, 49, 10178–10180 RSC.
- J. Xiao, L. Wan, S. Yang, F. Xiao and S. Wang, Nano Lett., 2014, 14, 831–838 CrossRef CAS PubMed.
- J. Huang, J. Wei, Y. Xiao, Y. Xu, Y. Xiao, Y. Wang, L. Tan, K. Yuan and Y. Chen, ACS Nano, 2018, 12, 3030–3041 CrossRef CAS PubMed.
- J. Zai, Y. Liu, X. Li, Z. Ma, R. Qi and X. Qian, Nano-Micro Lett., 2017, 9, 21 CrossRef PubMed.
- Y. Xiao, J. Huang, Y. Xu, H. Zhu, K. Yuan and Y. Chen, J. Mater. Chem. A, 2018, 6, 9161–9171 RSC.
- S. Xu, X. Li, Z. Yang, T. Wang, W. Jiang, C. Yang, S. Wang, N. Hu, H. Wei and Y. Zhang, ACS Appl. Mater. Interfaces, 2016, 8, 27868–27876 CrossRef CAS PubMed.
- S. Xu, T. Wang, Y. Ma, W. Jiang, S. Wang, M. Hong, N. Hu, Y. Su, Y. Zhang and Z. Yang, ChemSusChem, 2017, 10, 4056–4065 CrossRef CAS PubMed.
- S. Xu, C. Su, T. Wang, Y. Ma, J. Hu, J. Hu, N. Hu, Y. Su, Y. Zhang and Z. Yang, Electrochim. Acta, 2018, 259, 617–625 CrossRef CAS.
- P. M. Shirage, D. D. Shivagan, L. A. Ekal, N. V. Desai, S. B. Mane and S. H. Pawar, Appl. Surf. Sci., 2001, 182, 403–406 CrossRef CAS.
- D. D. Shivagan, P. M. Shirage and S. H. Pawar, Semicond. Sci. Technol., 2004, 19, 323–332 CrossRef CAS.
- P. M. Shirage, D. D. Shivagan and S. H. Pawar, Supercond. Sci. Technol., 2004, 17, 853–862 CrossRef CAS.
- P. M. Shirage, D. D. Shivagan, Y. H. Kim and S. H. Pawar, Appl. Surf. Sci., 2006, 253, 1836–1842 CrossRef CAS.
- C. V. Manzano, O. C. Calero, S. Hormeno, M. Penedo, M. Luna and M. S. M. Gonzalez, J. Phys. Chem. C, 2013, 117, 1502–1508 CrossRef.
- L. Mi, W. Wei, S. Huang, S. Cui, W. Zhang, H. Houb and W. Chen, J. Mater. Chem. A, 2015, 3, 20973–20982 RSC.
- P. Bhojane, S. Sen and P. M. Shirage, Appl. Surf. Sci., 2016, 377, 376–384 CrossRef CAS.
- L. Sinha, S. Pakhira, P. Bhojane, S. Mali, C. K. Hong and P. M. Shirage, ACS Sustainable Chem. Eng., 2018, 6, 13248–13261 CrossRef CAS.
- J. Yu, H. Wan, J. Jiang, Y. Ruan, L. Miao, L. Zhang, D. Xia and K. Xu, J. Electrochem. Soc., 2014, 161, 996–1000 CrossRef.
- B. Wang, J. Park, D. Su, C. Wang, H. Ahn and G. Wang, J. Mater. Chem., 2012, 22, 15750–15756 RSC.
- J. Zheng, W. Zhou, Y. Ma, W. Cao, C. Wanga and L. Guo, Chem. Commun., 2015, 51, 12863–12866 RSC.
- B. E. Conway, J. Electrochem. Soc., 1991, 138, 1539–1548 CrossRef CAS.
- R. Liu, S. Cho and S. B. Lee, Nanotechnology, 2008, 19, 215710 CrossRef PubMed.
- L. Yu, L. Zhang, H. B. Wu and X. W. Lou, Angew. Chem., Int. Ed., 2014, 53, 3711–3714 CrossRef CAS PubMed.
- J. Come, P. L. Taberna, S. Hamelet, C. Masquelier and P. Simon, J. Electrochem. Soc., 2011, 158, 1090–1093 CrossRef.
- T. Chen, Y. Tang, Y. Qiao, Z. Liu, W. Guo, J. Song, S. Mu, S. Yu, Y. Zhao and F. Gao, Sci. Rep., 2016, 6, 23289 CrossRef CAS PubMed.
- M. Toupin, T. Brousse and D. Belanger, Chem. Mater., 2004, 16, 184–3190 CrossRef.
- P. Bhojane, L. Sinha, R. S. Devan and P. M. Shirage, Nanoscale, 2018, 10, 1779–1787 RSC.
- H. Jiang, T. Zhao, C. Li and J. Ma, J. Mater. Chem., 2011, 21, 3818–3823 RSC.
- P. Bhojane, A. Sharma, M. Pusty, Y. Kumar, S. Sen and P. Shirage, J. Nanosci. Nanotechnol., 2017, 17, 1387–1392 CrossRef CAS PubMed.
- R. S. Kalubarme, C. J. Park and P. M. Shirage, J. Nanosci. Nanotechnol., 2015, 15, 1253–1260 CrossRef CAS PubMed.
- Z. Tang, C. Tang and H. Gong, Adv. Funct. Mater., 2012, 22, 1272–1278 CrossRef CAS.
- H. Li, Y. Gao, C. Wang and G. Yang, Adv. Energy Mater., 2015, 5, 1401767 CrossRef.
- D. Aurbach, J. Power Sources, 2000, 89, 206–218 CrossRef CAS.
Footnote |
| † Electronic supplementary information (ESI) available. See DOI: 10.1039/c8ra07471b |
| This journal is © The Royal Society of Chemistry 2018 |