
 Open Access Article
 This Open Access Article is licensed under a
 Creative Commons Attribution 3.0 Unported Licence
High-capacity and selective ammonium removal from water using sodium cobalt hexacyanoferrate†
Yong Jiangab,
Kimitaka Minamib,
Koji Sakuraib,
Akira Takahashib,
Durga Parajulib,
Zhongfang Lei a,
Zhenya Zhanga and
Tohru Kawamoto*b
a,
Zhenya Zhanga and
Tohru Kawamoto*b
aGraduate School of Life and Environmental Sciences, University of Tsukuba, 1-1-1, Tennodai, Tsukuba, Ibaraki 305-8572, Japan
bNanomaterials Research Institute, National Institute of Advanced Industrial Science and Technology (AIST), 1-1-1 Higashi, Tsukuba 305-8565, Japan. E-mail: tohru.kawamoto@aist.go.jp
First published on 8th October 2018
Abstract
A new NH4+ adsorbent with high capacity and selectivity, sodium cobalt(II) hexacyanoferrate(II) (NaCoHCF, NayCo(II) [Fe2+(CN)6]x·zH2O), was prepared. The adsorption performance was investigated by varying the mixing ratio of [Fe(CN)6]4− to Co2+ during synthesis, Rmix. The ammonia capacity was found to be proportional to Rmix, indicating that the NH4+ capacity can be increased by increasing the Na+-ion content in NaCoHCF. To conduct a detailed study, we prepared homogeneous nanoparticles by flow synthesis using a micromixer with Rmix = 1.00. Even on the addition of a saline solution (NaCl) with an Na+-ion concentration of 9350 mg L−1, the capacity was maintained: qmax = 4.28 mol kg−1. Using Markham–Benton analysis, the selectivity factor, defined by the ratio of equilibrium constants for NH4+ to that for Na+, was calculated to be α = 96.2, and 4.36 mol kg−1 was found to be the maximum capacity. The high selectivity of NaCoHCF results in good NH4+-adsorption performance, even from seawater. In comparison with other adsorbents under the same conditions and even for a NH4Cl solution, NaCoHCF showed the highest capacity. Moreover, the coexisting Na+ caused no interference with the adsorption of ammonium by NaCoHCF, whereas the other adsorbents adsorbed ammonia only slightly from the saline solution. We also found that the pores for NH4+ adsorption changed their sizes and shapes after adsorption.
1. Introduction
Ammonium, NH4+, is a widely synthesized chemical, most of which is used as a fertilizer. This distributed ammonium is oxidized to nitrite, NO2−, and then further converted to nitrate, NO3−, in rivers, lakes, and oceans through nitrification processes. When humans and animals drink water containing ammonia (NO3− ≥ 45 mg L−1 or NO3–N ≥ 10 mg L−1),1 they can become ill or even die. In aquatic systems, especially those near densely populated settlements or large-scale livestock facilities, the high concentrations of ammonia in water cause concern. Excess ammonia in aquatic systems can cause eutrophication, harmful algal blooms, and anoxic conditions in estuaries, rivers, and even the coastal environment. Consequently, biodiversity, fisheries, and overall ecosystem health are adversely affected by this N nutrient imbalance.2–4 Furthermore, N2O,1 a byproduct of ammonium oxidation, is an important greenhouse gas and ozone-depleting agent. The Intergovernmental Panel on Climate Change (IPCC) has estimated that the N2O emissions from the open ocean represent 3.8 Tg N per year, 35% of the total natural emissions.5In fact, various nations have set standards for ammonia in effluent or environmental water. For example, the U.S. Environmental Protection Agency (EPA) lowered the limit in 2013 for aquatic life in ambient water bodies to 17 and 1.9 mg L−1 total ammonia nitrogen one-hour and 30 day averages, respectively.6 China and India have also established standards for effluents of 15–50 and 50 mg L−1 ammonium nitrogen.7,8 Reducing the ammonium concentration is also important for biogasification technology with anaerobic digestion because the digestion is inhibited by high concentrations of ammonium. Depending on the conditions, 1500–5000 mg L−1 of total ammonium nitrogen can cause the slow down or failure of digestion.9,10 For the removal of NH4+ from wastewater or digestion liquids, methods for the selective removal of NH4+ are necessary because various ions coexist in these solutions.
For the uptake of NH4+, removal with an adsorbent is an easily controllable and highly efficient method. Strong acid cation (SAC) exchange resins, analogs of Amberlite IR-120 (Alfa Aesar, UK), show the highest adsorption capacity, reaching 5.34 mol kg−1 for aqueous solution without coexisting cations and using glass-packed bed columns.11 Nevertheless, SAC resins have low selectivity to NH4+ when other competing ions are present. He et al. studied alkaline-activated and lanthanum-impregnated zeolites12 and found a maximum adsorption capacity, qmax, of 1.54 mol kg−1 in a pure water solution. However, the removal efficiency, PR, decreased from 90% to 36% in the presence of Na+. Soetardji et al. reported that sodium-hydroxide-modified zeolite mordenite has qmax = 3.0 mol kg−1 in aqueous solution and that PR decreased from 81% to 66.9% when competing with other ions.13 Guaya et al. studied a hydrated aluminum-oxide-modified zeolite,14 which showed qmax = 2.14 mol kg−1 in aqueous solution and PR = 12% with coexisting Na+ ions.
Thus, conventional adsorbents have lower selectivity. As mentioned above, for the removal of NH4+ from wastewater or the digestion liquids, adsorbents with high-selectivity are crucial. In particular, for digestion liquids, a large capacity is also essential because the NH4+ concentration is quite high. For these reasons, the development of new adsorbents with both large capacity and high selectivity is desirable.
In our earlier study, we found that potassium copper hexacyanoferrate, KCuHCF, has a high ammonium adsorption capacity of 1.94 mol kg−1, as well as high selectivity for dissolved ammonia.15 Potassium copper hexacyanoferrate (KCuHCF), a metal hexacyanoferrate (MHCF), is a Prussian blue analog. MHCFs have the chemical composition of AyM[Fe(CN)6]1−x·zH2O, where A and M, respectively, denote alkali and transition metals, and x indicates the concentration of [Fe(CN)6] vacancies. With respect to MHCFs, many researchers have studied their use in catalysis,16–18 electrodes in secondary batteries,19–22 electrochromism,23–27 sensors,28,29 gas storage,30–32 photomagnets,33–35 and adsorbents for radioactive Cs+ ions.36–40 The ionic radii of hydrated Cs and NH4 are similar (3.29 and 3.31 Å, respectively). Therefore, assuming a size-based adsorption model, MHCFs could also have substantial adsorption capability for NH4+.41
The NH4+-adsorption mechanism is affected by the porous network in MHCFs. The crystal structure of MHCF is shown in Fig. 1, where two kinds of adsorption sites exist. One is an interstitial site, a cubic confined space surrounded by eight metal sites and twelve cyano-groups. Its pore size is less than 0.5 nm. The other is a vacancy site, represented as [Fe(CN)6] vacancies. In the case of KCuHCF, both K+ and NH4+ are located in the interstitial sites, as shown by Rietveld analysis of the X-ray diffraction (XRD) patterns.15 In addition, NH4+ is adsorbed via the ion-exchange with the A+ ions (K+ in the case of KCuHCF).15 Therefore, to enhance the adsorption capacity, [Fe(CN)6] vacancies should be eliminated. This is because the number of A+ ions increases as the number of vacancies decreases because of charge balance. The other reason is that the vacancy site does not play a role in NH4+ adsorption.
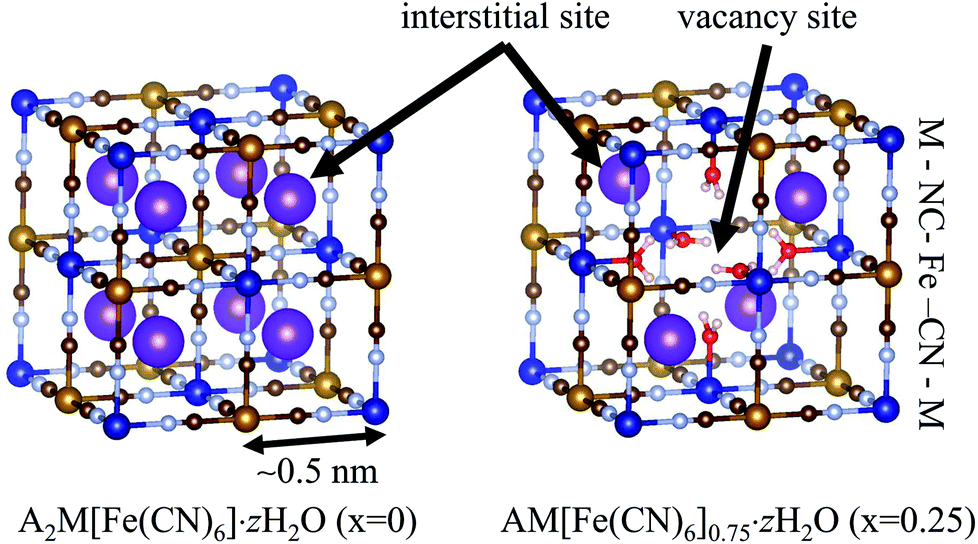 | ||
| Fig. 1 The crystal structure of metal hexacyanoferrate (MHCF, AyM[Fe(CN)6]1−x·zH2O) with different vacancy concentrations, x. Purple spheres represent A+ cations, the ion-exchange species in NH4+ adsorption. | ||
Based on these considerations, in this paper, we investigated the use of another MHCF, sodium cobalt hexacyanoferrate (NaCoHCF), to enhance the adsorption capacity. The most important difference between KCuHCF and NaCoHCF is the difference between Cu and Co. In the case of KCuHCF, KCuHCF with fewer [Fe(CN)6]4− vacancies causes material instability in the aqueous solution.42 However, with substitution with Co, the introduction of a small number of [Fe(CN)6]4− vacancies becomes possible. Additionally, the affinity of MHCF for the mono-cation is known to depend on the hydrated radius, implying that utilization of Na+ instead of K+ can increase the NH4+ adsorption performance.
Our study has two parts. The first is a composition-dependent study. Five kinds of NaCoHCF-nanoparticles (NaCoHCF-NPs), NayCo[Fe(CN)6]x·zH2O, were synthesized by changing the molar concentration ratio of the reagent solution (Rmix) using a batch method. The second part is a detailed study of Rmix = 1.00. Quantitative analysis into the adsorption capacity and selectivity was conducted. The changes to the crystal structure are also discussed. By comparison with earlier studies, we found that our NaCoHCF exhibits the a very high capacity when using the batch-adsorption method. Particularly for NH4+ adsorption from saline solutions, the benefits of NaCoHCF are enhanced by its high selectivity. We also demonstrate its potential for recyclability.
2. Experimental section
2.1 Synthesis of NaCoHCF-NPs
First, NaCoHCF-NPs with compositions of Na4x−2Co[Fe(CN)6]x (water omitted) were prepared according to the following chemical reaction.| Co(NO3)2 + xNa4[Fe(CN)6] → Na4x−2Co[Fe(CN)6]x + 2NaNO3 |
To study the composition dependence, the NaCoHCF-NPs were synthesized using a batch method by mixing two aqueous solutions of Na4[Fe(CN)6]·10H2O (Wako Pure Chemical Ind., Ltd.) and CoCl2·6H2O (special grade from Wako Pure Chemical Ind., Ltd.) with different molar concentration ratios (Rmix = 0.50, 0.75, 1.00, 1.50, and 2.00). Here, Rmix represents the mixing ratio of the concentration of [Fe(CN)6]4− to that of Co2+. The suspension was shaken using a multi shaker (SI-300C; AS One Corp.) for 3 min at 1700 rpm and room temperature. After shaking, the slurry solutions were centrifuged. The slurries were washed at least five times with Milli-Q water. They were dried under vacuum at 60 °C for 48 h.
For detailed studies conducted with a fixed composition, we prepared NaCoHCF-NP samples using a flow synthesis method to guarantee the homogeneity of the particle size and chemical composition.36 The NaCoHCF-NPs, denoted Flow-1.00, was synthesized by mixing 0.4 mol L−1 solutions of the Na4[Fe(CN)6]·10H2O and Co(NO3)2·6H2O (special grade from Wako Pure Chemical Ind., Ltd.) in a Y-type micro-mixer with a hole of Φ 250 μm, as shown schematically in Scheme 1. The mixed concentrations were the same as those for Batch-1.00. The flow rates of the two solutions were set to be equal. The total flow rate was 40 mL min−1. The obtained slurries were washed using a hollow fiber rinse system (DBW-24; OCT Science Co., Ltd.) to remove the NaNO3 byproduct. Then, the NaCoHCF-NPs were dried in vacuum at 60 °C for 72 h.
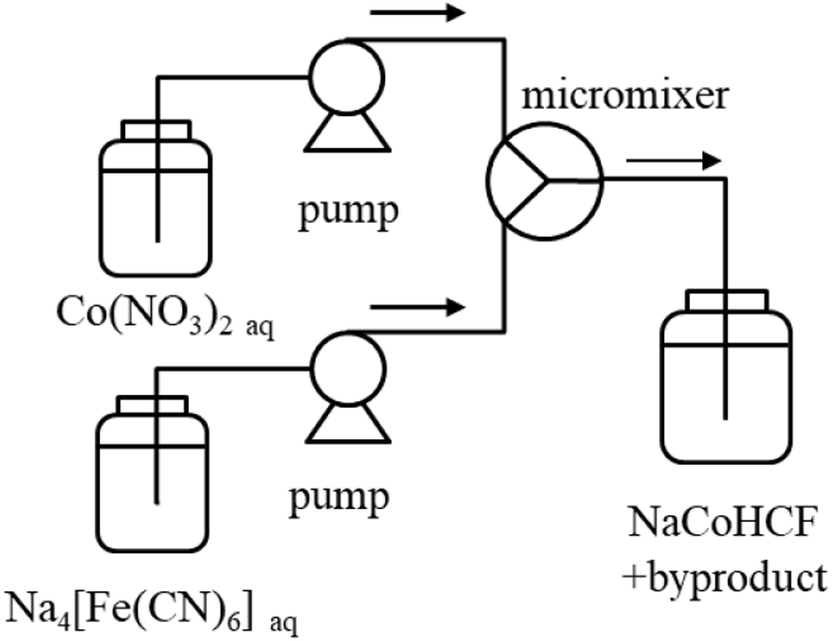 | ||
| Scheme 1 Schematic view of the synthesis of NaCoHCF by a micromixer. | ||
2.2 Characterization of NaCoHCF-NPs
The crystal structures of Flow-1.00 were studied before and after NH4+ adsorption using an X-ray diffractometer (D2 Phaser; Bruker Analytik GmbH, Germany) with Cu Kα (λ = 1.54 Å) radiation in the 2θ range of 5–60° at 30 kV and 10 mA. A Si (311) double-crystal monochromator was used to monochromatize the incident beam while reducing the high harmonics of the monochromatic beam. The XRD patterns were analyzed using the Pawley method to determine the space group and the lattice constants. For adsorption, a 500 mg L−1 NH4+ aqueous solution was used. Other conditions are described in Section 2.3. The crystallite sizes were estimated using Scherrer analysis of the XRD patterns, assuming a Scherrer constant of 0.94.43 Sample images were obtained using a field-emission scanning electron microscope (FE-SEM, S-4800; Hitachi Hitec Corp.) with 5 kV accelerating voltage after Pt–Pd coating using an ion sputter coater (E-1030; Hitachi Ltd., Japan). The chemical compositions and leaching concentration of CN− into treated water were determined using a Microwave Plasma-Atomic Emission Spectrometer (MP-AES, 4100; Agilent Technologies Inc., USA) with pre-decomposition using microwaves (MW, Multiwave 3000; PerkinElmer Inc., USA). The hydration numbers in each sample were ascertained through thermogravimetric analysis (Thermo Plus EVO2; Rigaku Corp.). The specific surface areas of several samples were estimated by fitting the Brunauer, Emmett, and Teller (BET) equation to the N2 adsorption isotherms obtained at 77 K. The typical pre-treatment condition was 100 °C for 24 h.2.3 NH4+ adsorption tests
To evaluate the composition dependence, a batch-shaking method was used to evaluate the NH4+ adsorption capacity of the NaCoHCF-NPs, as shown schematically in Fig. S1(a).† The method was conducted as follows: 40 mg of an NaCoHCF sample (Batch-0.50, 0.75, 1.00, 1.50, or 2.00) was added to a 40 mL aqueous solution of NH4Cl with a NH4+ concentration of 90 mg L−1. The suspension was shaken using a multi shaker (SI-300C; AS One Corp.) at 600 rpm for 180 min at 30 °C. After shaking, the supernatant was obtained via centrifuging and further separation using a 0.45 μm filter (MCE syringe filter; Membrane Solutions). The NH4+ concentration in the supernatant was evaluated using ion chromatography (IC, 883 Basic IC plus; Metrohm AG).For a detailed study using a fixed composition, the conditions were the same except that the NH4+ concentration was changed to 1–1000 mg L−1 in the NH4Cl aqueous solution and saline solution. The saline solution was prepared with 9350 mg L−1 of Na+ ions (NaCl, special grade from Wako Pure Chemical Ind., Ltd.), where the Na+ concentration was set to match that of Daigo's artificial seawater SP (Wako Pure Chemical Ind., Ltd.), 9348 mg L−1.
For comparison, the NH4+ adsorption properties of synthetic zeolite (A-3, powder, through 75 μm, Wako Pure Chemical Industries Ltd.), sepiolite (Omi Mining Co., Ltd., Japan), and Amberlite IR-120 (H) (Alfa Aesar, UK) were also investigated. All samples were produced with no pretreatment, such as drying, before the adsorption testing. The NH4+ concentration in the aqueous NH4Cl and in the saline solution were both set to 500 mg L−1. To remove the effects of Na+ from the NH4+ measurements, all saline solutions were diluted and distilled to trap only NH4+ ions before measurement by IC. When the concentration of NH4+ was higher than 150 mg L−1 after distillation, the solutions were diluted five times for IC measurement. Other solutions were measured directly by IC.
2.4 Evaluation of recyclability
The potential for recyclability was also investigated. The experimental setup is shown in Fig. S1(b).† A membrane filter with NaCoHCF-NPs was prepared for the flow test. The Flow-1.00 powder was mixed with 2 mL Milli-Q (3.76 mg mL−1) using an ultrasonic cleaner (W-113MK-II; Honda). Then, 100 μL solutions were dropped on the membrane filter (Φ 25 mm, 0.45 μm pore size, JHWP01300; Merck), followed by drying at 60 °C for 2 min. Thus prepared, the solutions were set on a circular plastic plate of Φ 25 mm with a hole of Φ 5 mm in the middle. They were pasted on the film for effective adsorption–desorption. An FT-IR spectrometer (iD1 transmission iS5; Nicolet Biomedical Inc.) was used to confirm adsorption and desorption of NH4+. For the adsorption test, the NH4+ solution of 500 mg L−1 was flowed through the NaCoHCF-NP-dipped membrane for 30 min at the rate of 0.2 mL min−1. For the desorption test, a NaCl solution of 5 mol L−1 was similarly flowed for 2 h at a rate of 1 mL min−1.3. Results and discussion
3.1 Composition dependence
The dependence of the chemical composition on the mixing ratio, Rmix, is presented in Table 1. For Rmix < 1.00, x is an almost equal to Rmix. The value of y, the number of Na+ ions in NaCoHCF, also increased. In contrast, when Rmix > 1.00, the chemical composition was almost unchanged, demonstrating that the composition can be controlled by changing the reaction Rmix to x < 1.| Samples | Rmix | x | y | z | Chemical compositions | Space group | a (Å) | b (Å) | c (Å) |
|---|---|---|---|---|---|---|---|---|---|
| Batch-0.50 | 0.50 | 0.57 | 0.49 | 3.64 | Na0.49Co1.00[Fe(CN)6]0.57·3.64H2O | P21/m | 11.83 | 9.52 | 7.47 |
R![[3 with combining macron]](https://www.rsc.org/images/entities/char_0033_0304.gif) c c |
12.77 | 12.77 | 29.06 | ||||||
| Batch-0.67 | 0.67 | 0.63 | 0.74 | 3.41 | Na0.74Co1.00[Fe(CN)6]0.63·3.41H2O | P21/m | 11.66 | 9.27 | 7.28 |
| Rc |
12.97 | 12.97 | 25.77 | ||||||
| Batch-1.00 | 1.00 | 0.87 | 1.65 | 2.84 | Na1.65Co1.00[Fe(CN)6]0.87·2.84H2O | Rc |
7.43 | 7.43 | 17.46 |
| Batch-1.33 | 1.33 | 0.90 | 1.71 | 3.00 | Na1.71Co1.00[Fe(CN)6]0.90·3.00H2O | Rc |
7.45 | 7.45 | 17.45 |
| Batch-2.00 | 2.00 | 0.90 | 1.75 | 3.36 | Na1.75Co1.00[Fe(CN)6]0.90·3.36H2O | Rc |
7.43 | 7.43 | 17.46 |
| Flow-1.00 | 1.00 | 0.82 | 1.46 | 3.79 | Na1.46Co1.00[Fe(CN)6]0.82·3.79H2O | Rc |
7.39 | 7.39 | 17.55 |
| Flow-1.00 after ads. | 1.00 | Fmm |
10.16 | 10.16 | 10.16 |
The crystal structure of NaCoHCF depends on the chemical composition (see Fig. S2†). When Rmix ≥ 1.00, the crystal structure is rhombohedral (R), as reported.44,45 On the other hand, the structure for Rmix = 0.50 is unclear. Earlier reports described the space group as monoclinic (P2/m or P21/m)46 or cubic (Pmm).47,48 In our case, the XRD pattern is explained as a mixture of Rc and P21/m structures, as shown in Table 1. The NaCoHCF with Rmix = 0.67 is also explainable as a mixture. Such a mixture could be the result of the batch synthesis because homogeneous synthesis is difficult using the batch method, resulting in the fluctuation of the chemical composition.
The BET surface areas of Batch-0.50, −0.67, and 1.00 were evaluated to be 28, 76, and 46 m2 g−1, respectively. The N2 isotherms are shown in Fig. S3 in the ESI.† These values are much smaller than those of other Prussian blue analogs synthesized for gas adsorption. For example, that of Co[Fe(CN)6]0.60 was 848 m2 g−1. The smaller surface area originated from the inclusion of Na+ cations. Because the interstitial sites of NaCoHCF are fully or partially occupied by Na+, it would be impossible for N2 to penetrate into the NaCoHCF lattice. This presumption is also supported by the fact that the averaged pore diameter is comparable to the particle size, as shown later in the analysis of Flow-1.00.
Fig. 2(a) shows that the NH4+ adsorption capacity improved with increasing Rmix. The amount of adsorbed ammonia of Batch-2.00 is about twice that of Batch-0.5. Fig. 2(b) shows that the amount of Na+ from the adsorbent has an almost linear correlation with the NH4+ adsorption amount, indicating the NH4+ adsorption occurred through ion exchange with Na+. These results demonstrate that the increase in the Na+ composition in NaCoHCF enhances the NH4+ adsorption capacity, and that NaCoHCF retains its structure even after long-term shaking in water. However, for Rmix > 1.00, the adsorption capacity increased by only 2.9–3.9% from Rmix = 1.00 because the upper limit of x is 1.0.
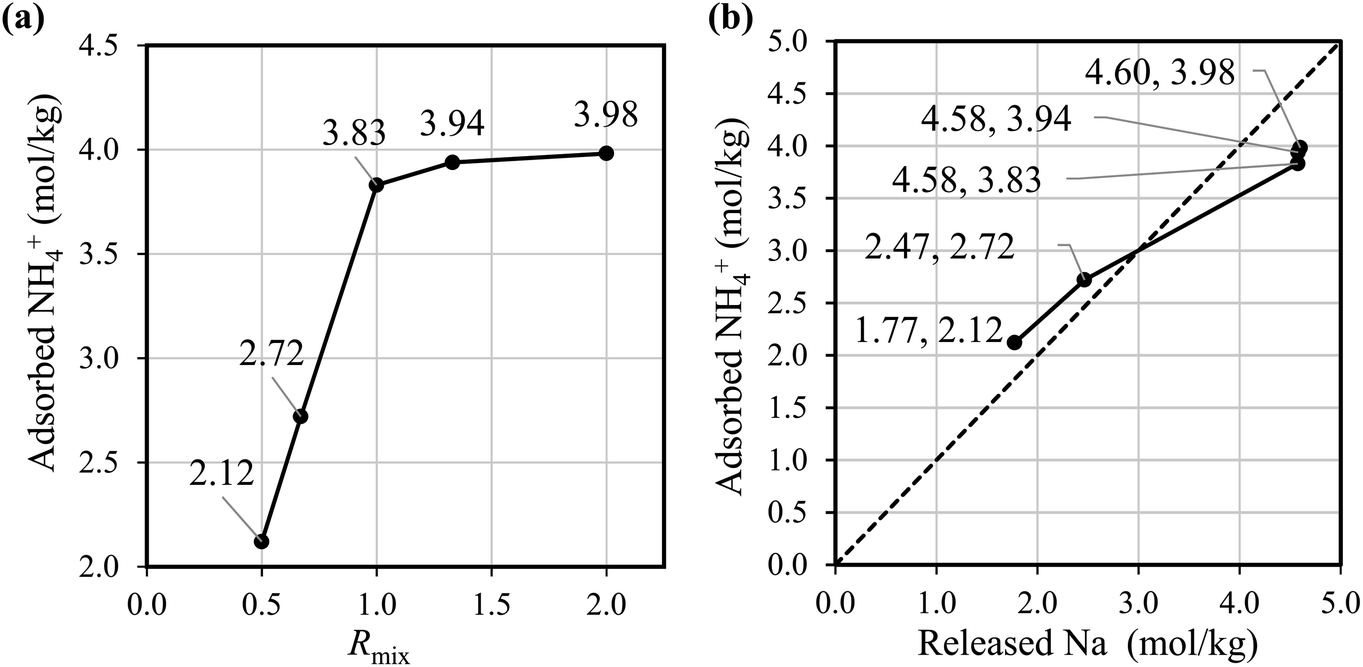 | ||
| Fig. 2 (a) Amount of adsorbed NH4+ by the batch-synthesized NaCoHCF with different compositions. (b) The relationship between adsorbed NH4+ and released Na+. The adsorption experiment was conducted at initial NH4+ of 90 mg L−1, 30 °C, and at 600 rpm for 3 h. | ||
3.2 Detailed study with flow-synthesized NaCoHCF with Rmix = 1.00
Based on results of the composition dependence of the NH4+ capacity, we chose to conduct a detailed study of NaCoHCF-NPs with Rmix = 1.00 because we obtained the desired chemical composition by using this value of Rmix and because it showed sufficiently high capacity. For our detailed study, we used the flow-synthesized sample, Flow-1.00, to avoid the fluctuation of the chemical composition and particle size. Table 1 shows that the chemical composition of Flow-1.00 is almost identical to that of Batch-1.00. The adsorption kinetics was studied at an initial NH4+ concentration of 500 mg L−1, 30 °C, and at 600 rpm for 8 h (see Fig. S4†). The results showed that the NH4+ adsorption was almost completed in 30 min. Such fast adsorption is similar to the case of KCuHCF.15Using BET analysis, we estimated the surface area to be 53 m2 g−1, which is also comparable to that of Batch-1.00, 46 m2 g−1. As described before, this value is not very high because the interstitial sites of NaCoHCF are filled with Na+, preventing the penetration of N2 into the porous network in the crystal. The average pore size was estimated to 31 nm for Flow-1.00, consistent with the size of the crystallites, as shown later.
After NH4+ adsorption, the crystal structure was maintained, except for a slight trigonal distortion. Fig. 3 shows the XRD patterns obtained before and after NH4+ adsorption. Some splitting of the Bragg peaks is apparent. The slight structural transformation observed is the same as that in the case of ion exchange between Na+ and K+.45 Before adsorption, NaCoHCF had a rhombohedral (Rc) structure. However, after NH4+ adsorption, it changed to a cubic lattice (Fmm; Z = 4). Thus, the ion exchange reversibly changed the structure.
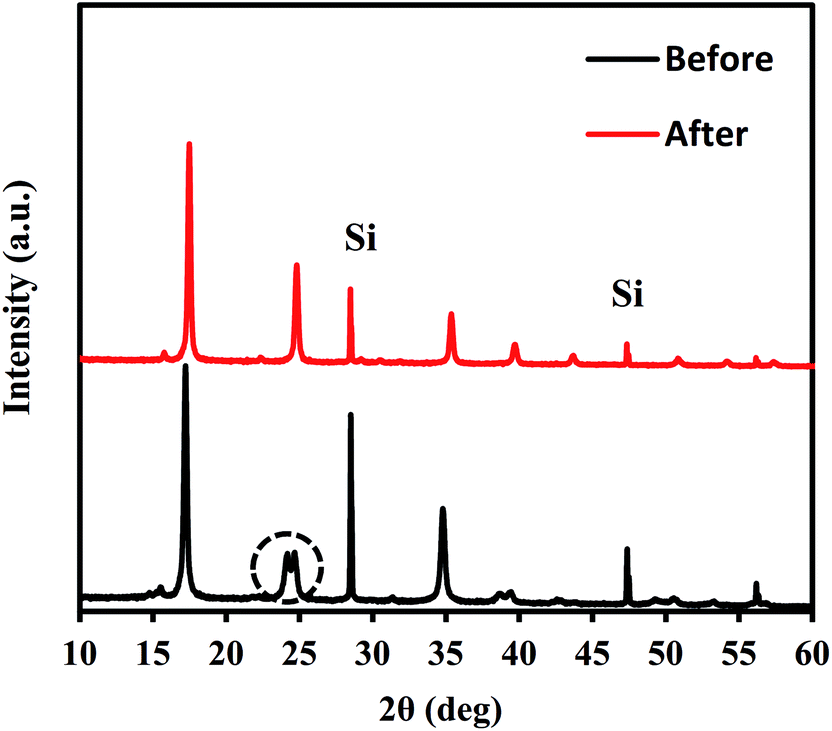 | ||
| Fig. 3 XRD patterns for Flow-1.0 with before and after adsorption with an aqueous NH4Cl solution containing 500 mg L−1 of NH4+. | ||
The structural change also influenced the shape and size of the interstitial sites in which Na+ or NH4+ are located. The lattice parameters of the crystal are shown in Table 1. A schematic view of the relationship between the interstitial site and the lattice distortion is shown in Fig. 4. Note that the crystal symmetry is different before and after the NH4+ adsorption. Before adsorption, the lattice has the rhombohedral symmetry with slight distortion from the cubic lattice. That is, it was compressed along the (1,1,1) direction. In contrast, after adsorption, the crystal maintained the cubic structure. This difference is consistent with previous reports of the ion exchange between Na+ and K+ but not NH4+.45
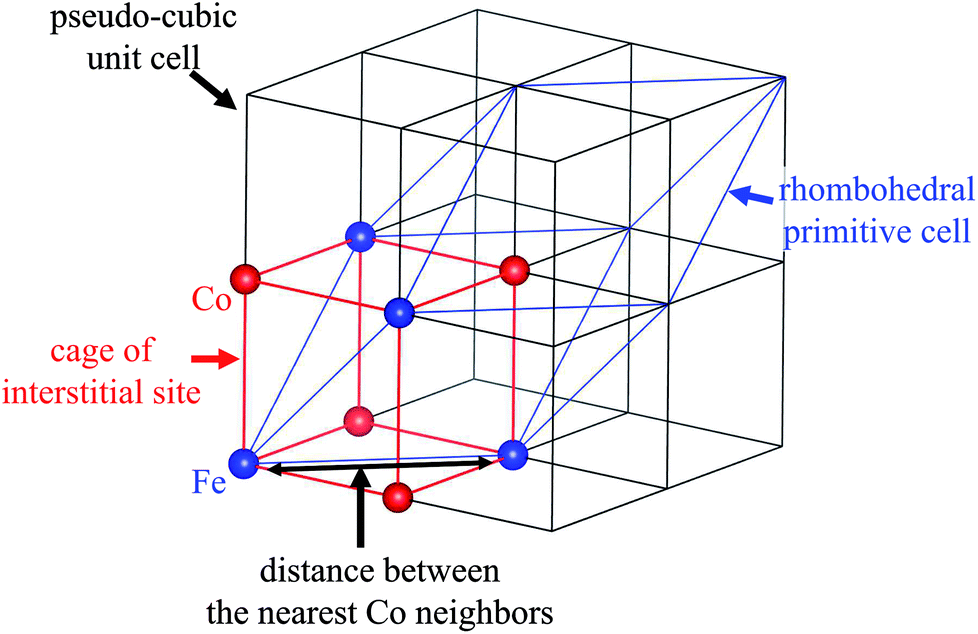 | ||
| Fig. 4 Schematic view of the relationship between the cage of the interstitial site, the cubic unit cell, and the primitive cell of the rhombohedral symmetry. | ||
Because the symmetry of the crystal is different before and after NH4+ adsorption, we investigated the distance between the nearest Co neighbors and the volume of the (pseudo)-cubic cage of the interstitial site to evaluate the changes to the interstitial sites. Before NH4+ adsorption, the distance between the nearest Co neighbors was calculated as the length of the unit vector of the rhombohedral primitive cell, 7.24 Å. On the other hand, after NH4+ adsorption, the separation was reduced to 7.18 Å, resulting in reduction in the volume of the cage from 138 to 131 Å3. It is interesting that the cage became smaller although the ionic radius of NH4+ is larger than that of Na+. This could be due to the difference in the H2O accompanying the cations. Because the interaction with H2O is stronger with Na+ than that with NH4+. Therefore, before NH4+ adsorption, H2O is adsorbed along with Na+, even if cage expansion is energetically disadvantageous. This is consistent with the previous studies of the electrochemical injection of Na+ into copper hexacyanoferrate thin films.49
No nanoparticle degradation occurred during adsorption. The crystallite sizes estimated by Scherrer analysis of the XRD patterns (Fig. 3) before and after sorption were, respectively, 37.9 and 51.7 nm. This result is consistent with the SEM images in Fig. 5. The particle sizes estimated using SEM images were 33 ± 10 and 47 ± 13 nm. The data indicate no degradation, but there is a possibility of some particle growth. The reason for the growth remains unclear, but it could be due to the immobilization of the Co2+ and [Fe(CN)6]4− ions eluted from the adsorbent onto the other part of the adsorbent. If so, the adsorbent would retain the eluted species. The surface morphology in SEM images shows no marked change after adsorption. Furthermore, we also evaluated the release of CN− after adsorption. The concentration of CN− in solution was only 0.33 mg L−1, sufficiently smaller than effluent standard in Japan, 1 mg L−1.50
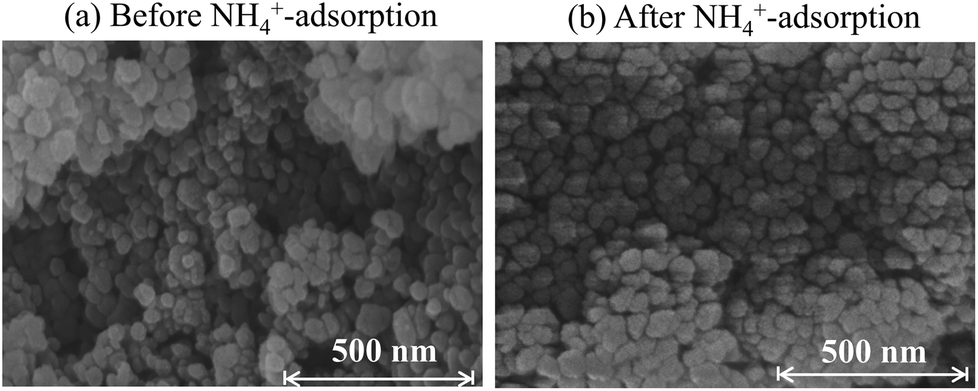 | ||
| Fig. 5 SEM images for Flow-1.00 (a) before and (b) after adsorption of 500 mg L−1 NH4+ in pure water solution. | ||
Fig. 6 shows the NH4+ adsorption isotherms in aqueous NH4Cl solution and that in aqueous saline solution. In the saline solution, the concentration of the Na+ solution was set to 9350 mg L−1, the same as that of artificial seawater. The curves fit to the Langmuir, Freundlich, and Markham–Benton equations are also shown in Fig. 6. The fitting parameters for each equation are shown in Table 2. Concerning the Langmuir and Freundlich equations, individual fitting parameters were obtained for the NH4Cl(aq) and saline solutions.
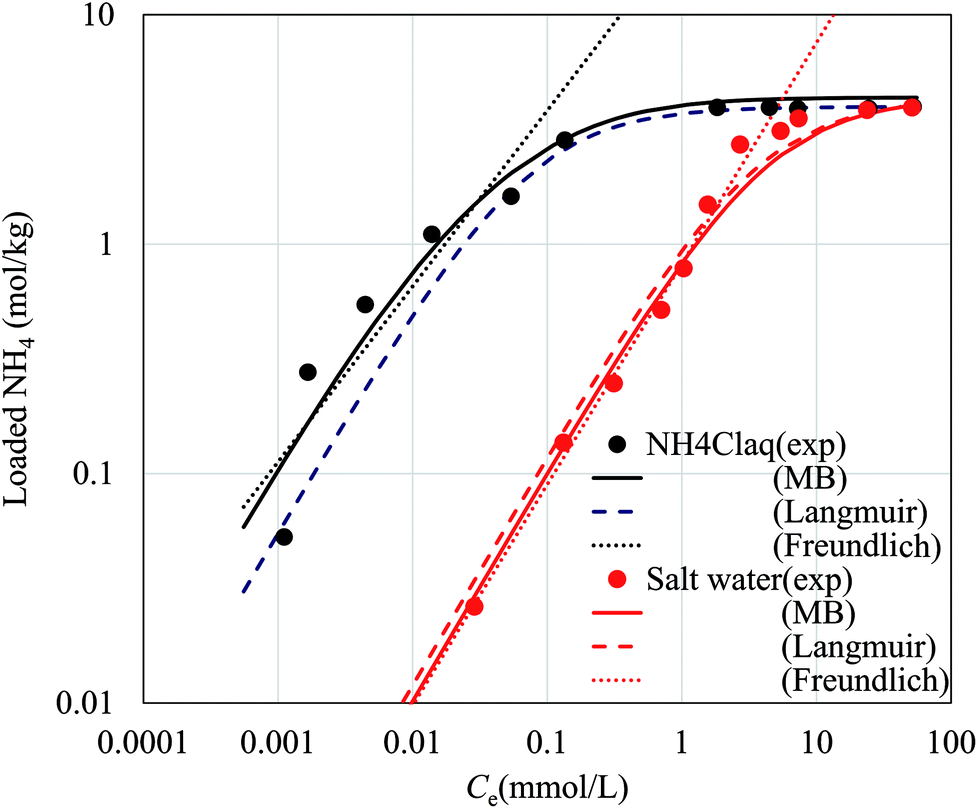 | ||
| Fig. 6 Adsorption behavior of NH4+ by the flow-synthesized NaCoHCF with Rmix = 1.00 with curves fit to the Markham–Benton (solid lines), Langmuir (broken line), and Freundlich (dotted line) equations. The experimental points are represented by closed circles. Black and red symbols represent NH4Cl aqueous solution and salt water, respectively. | ||
| Langmuir | Freundlich | Markham–Benton | ||||||||
|---|---|---|---|---|---|---|---|---|---|---|
| NH4Cl(aq) | Saline | NH4Cl(aq) | Saline | NH4Cl(aq) & saline | ||||||
| K (L mol−1) | qmax (mol kg−1) | K (L mol−1) | qmax (mol kg−1) | Kf (mol kg−1) | 1/n | Kf (mol kg−1) | 1/n | qmax (mol kg−1) | K (L mol−1) | K′ (L mol−1) |
| 13.99 | 3.97 | 0.28 | 4.28 | 22.27 | 0.77 | 0.82 | 0.96 | 4.36 | 24.84 | 0.26 |
The Langmuir equation is given by
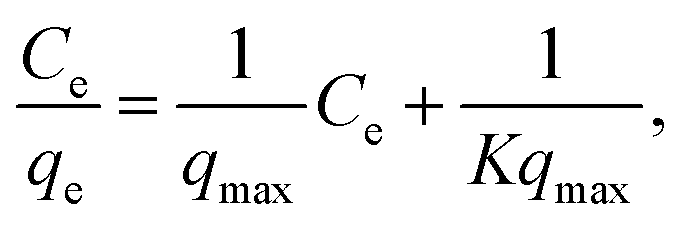 | (1) |
| qe = KfC1/n. | (2) |
For the Freundlich equation, only the region where the loaded NH4+ concentration was less than 1.95 mol kg−1, about a half the maximum capacity, was considered because the Freundlich equation is only suitable far from saturated loading. However, in this region, the Freundlich equation also well reproduced the experimental data.
In the fitting of the Langmuir or Freundlich equations, we used different parameters for NH4Cl(aq) and the salt solutions because the effect of the coexistent Na+ ions can only be modeled by changing the fitting parameters. For a more quantitative evaluation of the effect of the coexistent Na+ ions, we also considered the Markham–Benton model for a solution with multi-alkali cations. As a type of extended Langmuir equation, the Markham–Benton equation51 was used to examine adsorption isotherms for multiple components to estimate the ease of desorption of the adsorbents. The results also provide some understanding of the selectivity of the sorbents for some ions. The Markham–Benton equation is
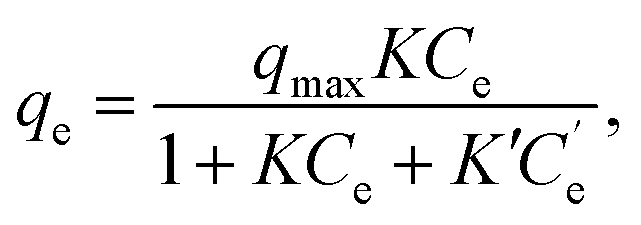 | (3) |
 and K′ respectively denote the Na+ ion concentration in equilibrium and the equilibrium constant.
Considering the Na+-ion exchange for NH4+ ions, i.e., even in NH4Cl aqueous solution, an equal amount of Na+ ions would be exchanged out, adversely affecting the adsorption capacity. When we consider both sources of Na+ ions (those in NaCoHCF and that in the solution), the equation can be expressed by as
 | (4) |
 , m, and V respectively denote the initial Na+ ion concentration in solutions, adsorbent mass, and solution volume.
The fitting parameters, qmax, K, and K′, are shown in Table 2. Fig. 6 shows that the experimental data were well fitted using the Markham–Benton model. Again, with the Markham–Benton model, we use the same parameter set for NH4Cl(aq) and the saline solutions. A selectivity factor, α, defined by the ratio of equilibrium constants for NH4+ to that for Na+ was calculated to be α = 96.2, indicating the high selectivity of NH4+ against Na+.
Such high selectivity is expected to lead to extremely high capacity, even in an aqueous saline solution. To clarify the high capacity of NaCoHCF among the various adsorbents, we used two approaches. First, we surveyed and compared results with those of earlier studies, and we also conducted experimental investigations to assess the adsorption capacity of adsorbents in identical conditions. For the literature survey, we picked reports of adsorption tests carried out using a batch style because column-style tests generally report higher capacities, rendering a comparison of results difficult between batch-style tests and column tests.
Information from earlier studies is presented in Table 3 for the adsorption capacity of adsorbents for NH4+ from aqueous solution in batch style, indicating that the NaCoHCF (Flow-1.00) capacity exceeds that of all earlier reports. However, as described above, SAC resins have been reported to have high capacities, although these values were achieved using the column method without coexistent cations. For comparison under the same conditions, we evaluated the respective adsorption capacities of a synthetic zeolite, Amberlite IR-120(H) as a representative SAC, sepiolite, and NaCoHCF (Flow-1.00). Even in the NH4Cl aqueous solution (500 mg L−1-NH4), NaCoHCF exhibited the highest capacity, whereas Amberlite adsorbed only 1.29 mol kg−1. This result is due to the difference between column and batch tests. The capacity evaluated with a batch test sometimes larger than that with a column test, and sometimes smaller. When the contact time is short in the column test, the capacity would be underestimated. On the other hand, with bad selectivity of the adsorbent, the capacity in a batch test would be smaller than that in a column test. In the batch test, the cations A+ are exchanged into the solution on the NH4+ adsorption and remain in the system, resulting in the possibility of the reverse reaction (A+ adsorption–NH4+ desorption).
| Adsorbent | Maximum capacity (mol kg−1) | Ref. |
|---|---|---|
| Alkaline activated and lanthanum-impregnated zeolite | 1.54 | 12 |
| Sodium hydroxide modified zeolite mordenite | 3.0 | 13 |
| Natural zeolite | 2.36 | 14 |
| Modified natural zeolite | 2.14 | 14 |
| Dowex 50w-x8 | 2.64 | 52 |
| Sepiolite | 3.70 | 53 |
| Carbon nanotubes | 0.95 | 54 |
| Poly ligand exchanger resin | 2.51 | 55 |
| Cation exchange resin | 0.81 | 56 |
| KCuHCF | 1.94 | 15 |
| NaCoHCF (Flow-1.00) | 4.36 | This study |
The benefits of NaCoHCF were amplified in the case of aqueous saline solution with 9350 mg L−1-Na and 500 mg L−1-NH4. Fig. 7 shows that NaCoHCF has an adsorption capacity that is almost identical to that of the case without Na+, whereas the other adsorbents showed little adsorption.
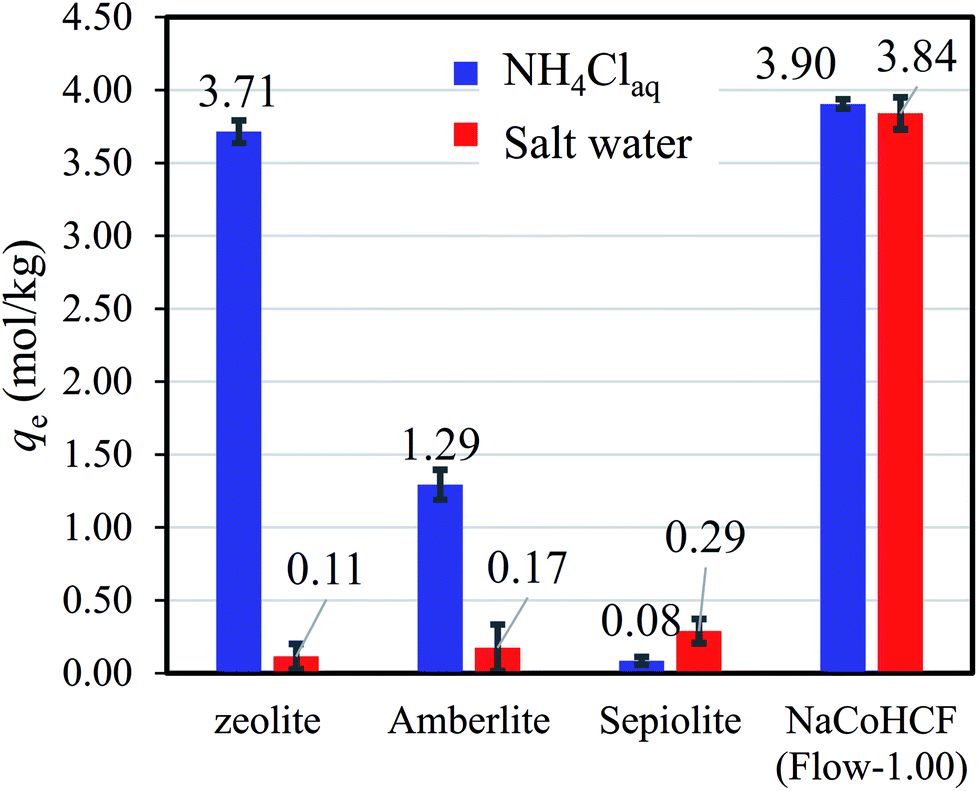 | ||
| Fig. 7 Adsorption capacity of various adsorbents in NH4Cl aqueous solution (500 mg L−1-NH4+) and saline solution with a concentration fixed at 9350 mg L−1-Na. | ||
Although our main aim, the preparation of an NH4-adsorbent with high capacity and high selectivity, has been achieved, the recyclability of the adsorbent is also important for practical use. Therefore, finally, we demonstrate the potential for recyclability by attempting desorption tests. Fig. 8 shows that the adsorption–desorption–adsorption process was confirmed by measuring the infrared absorption corresponding to NH4-vibration mode at around 1415 cm−1.15 Using the continuous flow of NaCl solution for desorption, the peak height was found to decrease to 28% the original value before flow, indicating the potential for NaCoHCF recyclability. Next, further study on the sorption performances, including the column sorption, quantitatively reusability test would be conducted.
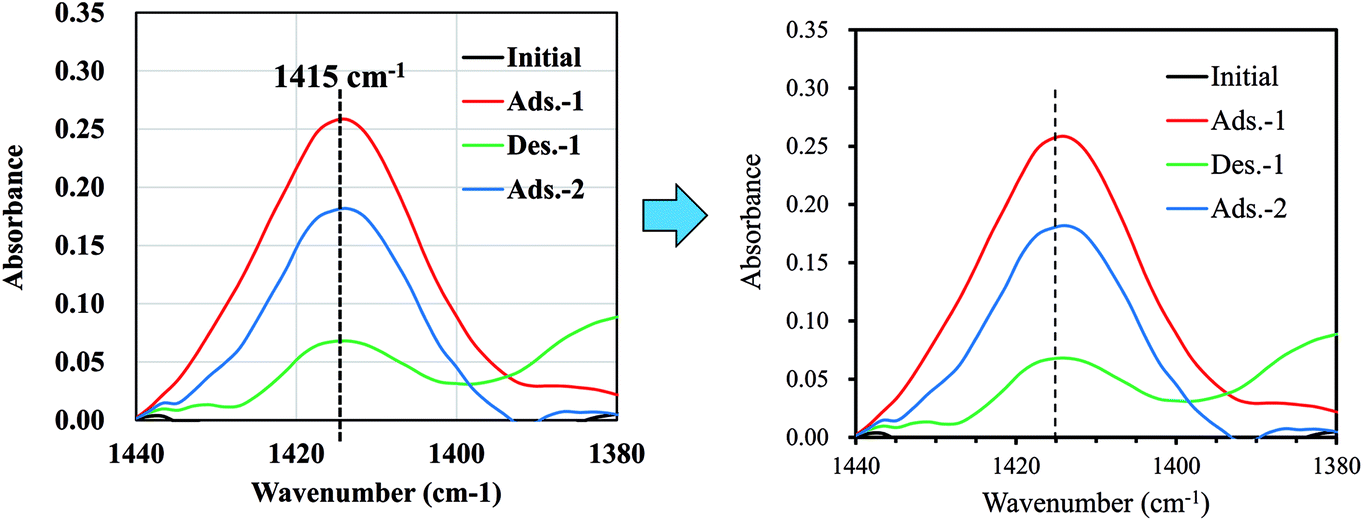 | ||
| Fig. 8 FT-IR spectra showing the changes in the peak-height of NH4+ adsorbed onto Flow-1.00 with sorption and desorption. | ||
Finally, we mention concerning the cost of the materials. As mentioned above, NaCoHCF is synthesized only mixing two solutions immediately, resulting in the suppression of the manufacturing cost. For NH4 removal from salt water, NaCoHCF would be cost effective in comparison with Amberlites and zeolites, despite the utilization of the cobalt, one of the rare metals. This is because the amount of the adsorbent can be drastically decreased with its high selectivity.
4. Conclusions
NayCo[Fe(CN)6]x·zH2O (NaCoHCF) was synthesized using a batch method and various chemical compositions. Synthesis was also carried out using a flow method and a fixed composition. The adsorption capacity increased as the number of [Fe(CN)6] vacancies decreased and the material was stable in water. Such stability is unlike that of copper hexacyanoferrate. We compared the NH4+ adsorption performance with other high-capacity adsorbents under the same conditions: zeolites, Amberlite ion-exchange resin, and sepiolite. The results show that NaCoHCF exhibited the highest capacity in NH4Cl aqueous solution. Using aqueous saline solutions with a Na+ ion concentration of 9350 mg L−1, the benefits of using NaCoHCF are enhanced drastically. The Markham–Benton model revealed the high selectivity for NH4+ against coexisting Na+. In addition, ammonium desorption from the adsorbent (enabling recycling) was demonstrated using an NaCl aqueous solution.Author contributions
The manuscript was written through contributions of all authors. All authors have given approval to the final version of the manuscript.Conflicts of interest
The authors declare no competing financial interest.Abbreviations
| SAC | Strong acid cation |
| MHCFs | Metal hexacyanoferrates |
| NaCoHCF-NPs | NaCoHCF-nanoparticles |
Acknowledgements
The authors thank Ms Keiko Noda for the SEM training given to Y. J. The authors also thank Ms Ying Wang for the valuable discussion related to the Langmuir equation.References
- A. M. Fan and V. E. Steinberg, Regul. Toxicol. Pharmacol., 1996, 23, 35–43 CrossRef CAS PubMed.
- J. N. Galloway, J. D. Aber, J. W. Erisman, S. P. Seizinger, R. W. Howarth, E. B. Cowling and B. J. Cosby, Bioscience, 2003, 53, 341 CrossRef.
- R. W. Howarth, Harmful Algae, 2008, 8, 14–20 CrossRef CAS.
- L. Olsen, M. Holmer and Y. Olsen, Perspectives of nutrient emission from fish aquaculture in coastal waters, 2008 Search PubMed.
- IPCC, working group I, Climate change 2013: The physical Science Basis, http://www.climatechange2013.org/images/uploads/WG1AR5_CLAsLAsREsAnnexEditors_FINAL.pdf, (accessed 5 October 2018) Search PubMed.
- Aquatic Life Ambient Water Quality Criteria for Ammonia - Freshwater (2013) Fact Sheet, https://www.epa.gov/sites/production/files/2015-08/documents/fact_sheet_aquatic-life-ambient-water-quality-criteria-for-ammonia-freshwater-2013.pdf, accessed 1 May 2018 Search PubMed.
- The Environment (Protection) Rules, http://cpcb.nic.in/GeneralStandards.pdf, accessed 1 May 2018 Search PubMed.
- Maximum Allowable Discharge Concentrations for Other Pollutants in China, https://chinawaterrisk.org/wp-content/uploads/2011/05/Maximum-Allowable-Discharge-Concentrations-For-Other-Pollutants-in-China.pdf, accessed 1 May 2018 Search PubMed.
- H. Chen, W. Wang, L. Xue, C. Chen, G. Liu and R. Zhang, Energy Fuels, 2016, 30, 5749–5757 CrossRef CAS.
- O. Yenigün and B. Demirel, Process Biochem., 2013, 48, 901–911 CrossRef.
- A. Malovanyy, H. Sakalova, Y. Yatchyshyn, E. Plaza and M. Malovanyy, Desalination, 2013, 329, 93–102 CrossRef CAS.
- Y. He, H. Lin, Y. Dong, Q. Liu and L. Wang, Chemosphere, 2016, 164, 387–395 CrossRef CAS PubMed.
- J. P. Soetardji, J. C. Claudia, Y.-H. Ju, J. A. Hriljac, T.-Y. Chen, F. E. Soetaredjo, S. P. Santoso, A. Kurniawan and S. Ismadji, RSC Adv., 2015, 5, 83689–83699 RSC.
- D. Guaya, C. Valderrama, A. Farran, C. Armijos and J. L. Cortina, Chem. Eng. J., 2015, 271, 204–213 CrossRef CAS.
- D. Parajuli, H. Noguchi, A. Takahashi, H. Tanaka and T. Kawamoto, Ind. Eng. Chem. Res., 2016, 55, 6708–6715 CrossRef CAS.
- X. Li, J. Wang, A. I. Rykov, V. K. Sharma, H. Wei, C. Jin, X. Liu, M. Li, S. Yu, C. Sun and D. D. Dionysiou, Catal. Sci. Technol., 2015, 5, 504–514 RSC.
- X. Li, A. I. Rykov, B. Zhang, Y. Zhang and J. Wang, Catal. Sci. Technol., 2016, 6, 7486–7494 RSC.
- X. Li, A. I. Rykov and J. Wang, Catal. Commun., 2016, 77, 32–36 CrossRef CAS.
- V. D. Neff, J. Electrochem. Soc., 1985, 132, 1382 CrossRef CAS.
- M. Okubo, D. Asakura, Y. Mizuno, J.-D. Kim, T. Mizokawa, T. Kudo and I. Honma, J. Phys. Chem. Lett., 2010, 1, 2063–2071 CrossRef CAS.
- M. Takachi, T. Matsuda and Y. Moritomo, Appl. Phys. Express, 2013, 6, 4–7 Search PubMed.
- M. Pasta, R. Y. Wang, R. Ruffo, R. Qiao, H.-W. Lee, B. Shyam, M. Guo, Y. Wang, L. A. Wray, W. Yang, M. F. Toney and Y. Cui, J. Mater. Chem. A, 2016, 4, 4211–4223 RSC.
- V. D. Neff, J. Electrochem. Soc., 1978, 125, 886–887 CrossRef CAS.
- L.-C. Chen, Y.-H. Huang and K.-C. Ho, J. Solid State Electrochem., 2002, 7, 6–10 CrossRef CAS.
- R. J. Kulesza, M. A. Malik, K. Miecznikowski, A. Wolkiewicz and P. J. Kulesza, J. Electrochem. Soc., 1996, 143, L10 CrossRef.
- T.-C. C. Liao, W.-H. H. Chen, H.-Y. Y. Liao and L.-C. C. Chen, Sol. Energy Mater. Sol. Cells, 2016, 145, 26–34 CrossRef CAS.
- E. Kholoud, H. Watanabe, A. Takahashi, M. M. Emara, B. A. Abd-El-Nabey, M. Kurihara, K. Tajima and T. Kawamoto, J. Mater. Chem. C, 2017, 5, 8921–8926 RSC.
- R. Pauliukaite, M. Florescu and C. M. A. Brett, J. Solid State Electrochem., 2005, 9, 354–362 CrossRef CAS.
- W.-R. Cai, G.-Y. Zhang, T. Song, X.-J. Zhang and D. Shan, Electrochim. Acta, 2016, 198, 32–39 CrossRef CAS.
- S. S. Kaye and J. R. Long, J. Am. Chem. Soc., 2005, 127, 6506–6507 CrossRef CAS PubMed.
- A. Takahashi, H. Tanaka, D. Parajuli, T. Nakamura, K. Minami, Y. Sugiyama, Y. Hakuta, S. Ohkoshi and T. Kawamoto, J. Am. Chem. Soc., 2016, 138, 6376–6379 CrossRef CAS PubMed.
- L. Hu, P. Zhang, Q.-W. Chen, J.-Y. Mei and N. Yan, RSC Adv., 2011, 1, 1574 RSC.
- O. Sato, T. Iyoda, A. Fujishima and K. Hashimoto, Science (80- ), 1996, 272, 704–705 CrossRef CAS.
- S. I. Ohkoshi and K. Hashimoto, J. Am. Chem. Soc., 1999, 121, 10591–10597 CrossRef CAS.
- V. Escax, a. Bleuzen, C. Cartier dit Moulin, F. Villain, a. Goujon, F. Varret and M. Verdaguer, J. Am. Chem. Soc., 2001, 123, 12536–12543 CrossRef CAS PubMed.
- A. Takahashi, N. Minami, H. Tanaka, K. Sue, K. Minami, D. Parajuli, K.-M. Lee, S. Ohkoshi, M. Kurihara and T. Kawamoto, Green Chem., 2015, 17, 4228–4233 RSC.
- D. Parajuli, A. Kitajima, A. Takahashi, H. Tanaka, H. Ogawa, Y. Hakuta, K. Yoshino, T. Funahashi, M. Yamaguchi, M. Osada and T. Kawamoto, J. Environ. Radioact., 2015, 151, 233–237 CrossRef PubMed.
- a. Nilchi, R. Saberi, M. Moradi, H. Azizpour and R. Zarghami, Chem. Eng. J., 2011, 172, 572–580 CrossRef CAS.
- J. Causse, A. Tokarev, J. Ravaux, M. Moloney, Y. Barré and A. Grandjean, J. Mater. Chem. A, 2014, 2, 9461 RSC.
- M. Ishizaki, S. Akiba, A. Ohtani, Y. Hoshi, K. Ono, M. Matsuba, T. Togashi, K. Kananizuka, M. Sakamoto, A. Takahashi, T. Kawamoto, H. Tanaka, M. Watanabe, M. Arisaka, T. Nankawa and M. Kurihara, Dalton Trans., 2013, 42, 16049–16055 RSC.
- E. R. Nightingale, J. Phys. Chem., 1959, 63, 1381–1387 CrossRef CAS.
- A. Takahashi, H. Tanaka, K. Minami, K. Noda, M. Ishizaki, M. Kurihara, H. Ogawa and T. Kawamoto, RSC Adv. Search PubMed , accepted.
- P. Scherrer, Nachr. Ges. Wiss. Göttingen, 1918, 26, 98 Search PubMed.
- Y. Moritomo, K. Igarashi, T. Matsuda and J. Kim, J. Phys. Soc. Jpn., 2009, 78, 074602 CrossRef.
- T. Matsuda, J. Kim and Y. Moritomo, J. Am. Chem. Soc., 2010, 132, 12206–12207 CrossRef CAS PubMed.
- M. Avila, L. Reguera, J. Rodríguez-Hernández, J. Balmaseda and E. Reguera, J. Solid State Chem., 2008, 181, 2899–2907 CrossRef CAS.
- S. Adak, L. L. Daemen, M. Hartl, D. Williams, J. Summerhill and H. Nakotte, J. Solid State Chem., 2011, 184, 2854–2861 CrossRef CAS.
- S. Adak, M. Hartl, L. Daemen, E. Fohtung and H. Nakotte, J. Electron Spectrosc. Relat. Phenom., 2017, 214, 8–19 CrossRef CAS.
- M. Asai, A. Takahashi, K. Tajima, H. Tanaka, M. Ishizaki, M. Kurihara and K. Tohru, RSC Adv. Search PubMed , submitted.
- National Effluent Standards in Japan, https://www.env.go.jp/en/water/wq/nes.html, accessed 21 September 2018 Search PubMed.
- E. C. Markham and A. F. Benton, J. Am. Chem. Soc., 1931, 53, 497–507 CrossRef CAS.
- T. C. Jorgensen and L. R. Weatherley, Water Res., 2003, 37, 1723–1728 CrossRef CAS PubMed.
- S. Balci, Water Res., 2004, 38, 1129–1138 CrossRef CAS PubMed.
- O. Moradi and K. Zare, Fullerenes, Nanotub. Carbon Nanostructures, 2013, 21, pp. 449–459 Search PubMed.
- Q. Chen, K. Zhou, Y. Chen, A. Wang and F. Liu, RSC Adv., 2017, 7, 12812–12823 RSC.
- N. Imchuen, Y. Lubphoo, J.-M. Chyan, S. Padungthon and C.-H. Liao, Sustainable Environ. Res., 2016, 26, 156–160 CrossRef CAS.
Footnote |
| † Electronic supplementary information (ESI) available. See DOI: 10.1039/c8ra07421f |
| This journal is © The Royal Society of Chemistry 2018 |