 Open Access Article
Studies on structure-function relationships of acetolactate decarboxylase from Enterobacter cloacae
Fangling Ji†
 *a,
Yanbin Feng†b,
Mingyang Lia,
Yongliang Yanga,
Tianqi Wanga,
Jingyun Wang
 a,
Yongming Baoac and
Song Xue
 *b
*b
aSchool of Life Science and Biotechnology, Dalian University of Technology, Dalian, Liaoning 116024, P. R. China. E-mail: fanglingji@dlut.edu.cn
bMarine Bioengineering Group, Dalian Institute of Chemical Physics, Chinese Academy of Sciences, Dalian, Liaoning 116023, P. R. China. E-mail: xuesong@dicp.ac.cn
cSchool of Food and Environment Science and Engineering, Dalian University of Technology, Panjin, Liaoning 12422, P. R. China
First published on 20th November 2018
Abstract
Acetoin is an important bio-based platform chemical with wide applications. Among all bacterial strains, Enterobacter cloacae is a well-known acetoin producer via α-acetolactate decarboxylase (ALDC), which converts α-acetolactate into acetoin and is identified as the key enzyme in the biosynthetic pathway of acetoin. In this work, the enzyme properties of Enterobacter cloacae ALDC (E.c.-ALDC) were characterized, revealing a Km value of 12.19 mM and a kcat value of 0.96 s−1. Meanwhile, the optimum pH of E.c.-ALDC was 6.5, and the activity of E.c.-ALDC was activated by Mn2+, Ba2+, Mg2+, Zn2+ and Ca2+, while Cu2+ and Fe2+ significantly inhibited ALDC activity. More importantly, we solved and reported the first crystal structure of E.c.-ALDC at 2.4 Å resolution. The active centre consists of a zinc ion coordinated by highly conserved histidines (199, 201 and 212) and glutamates (70 and 259). However, the conserved Arg150 in E.c.-ALDC orients away from the zinc ion in the active centre of the molecule, losing contact with the zinc ion. Molecular docking of the two enantiomers of α-acetolactate, (R)-acetolactate and (S)-acetolactate allows us to further investigate the interaction networks of E.c.-ALDC with the unique conformation of Arg150. In the models, no direct contacts are observed between Arg150 and the substrates, which is unlikely to maintain the stabilization function of Arg150 in the catalytic reaction. The structure of E.c.-ALDC provides valuable information about its function, allowing a deeper understanding of the catalytic mechanism of ALDCs.
Introduction
In microbes, acetoin (3-hydroxy-2-butanone, AC) is the in-between product of the 2,3-butanediol (BD) fermentation pathway. With the growing demand in recent years, the production method of AC has been widely addressed. At present, commercially available AC is mainly chemically synthesized from fossil materials, such as 2,3-butanediol (2,3-BD), butanone and diacetyl. However, due to environmental problems in chemical processes, large-scale production of AC is still limited. Based on microbial fermentation and enzymatic catalysis, biotechnological production provides an alternative environmentally friendly method, but the final product is usually a mixture. The mixture contains by-products, such as 2,3-BD, acetic acid and lactic acid, resulting in the difficult separation of AC in microbial fermentation. Usually, the separation of high purity acetoin from the mixtures is very expensive.To date, many bacterial strains, such as Bacillus subtilis,1 Klebsiella pneumoniae,2 Enterobacter aerogenes3 and Enterobacter cloacae,4 have been discovered and engineered to produce AC. Among these microorganisms, the most promising microorganism for biological production of AC is Enterobacter cloacae. Enterobacter cloacae subsp. dissolvens strain SDM grows rapidly in a simple medium and metabolizes the major lignocellulose-derived sugars glucose and xylose into AC.4 However, AC exists in two stereoisomeric forms: (R)-AC and (S)-AC. The efficient use of AC, especially in the asymmetric synthesis of valuable chiral chemicals, requires optically active AC. However, owing to a lack of knowledge about stereoisomer formation mechanisms, the production of optically active AC using these strains has been difficult to achieve. Industrial chiral AC production by using these promising microorganisms has not been reported to date.
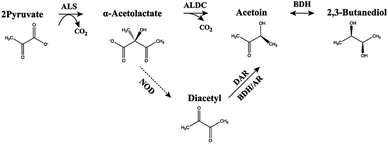
Three enzymes involved in AC biosynthesis from pyruvate through α-acetolactate (AL) to AC include α-acetolactate synthase (ALS, encoded by budB), α-acetolactate decarboxylase (ALDC, encoded by budA), and acetoin reductases (ARs, also called DRs or BDHs, encoded by budC and gdh) (Scheme 1). ALDC (EC 4.1.1.5) catalyses α-acetolactate to form AC and carbon dioxide via decarboxylation.5 In some cases, the decarboxylation of α-acetolactate by ALDC is assumed to be a rate-limiting step in generating 2,3-BD.6,7 Immobilized ALDC has been applied in the traditional beer brewing process.8 During fermentation, ALDC significantly increases the production rate and decreases the adverse flavour caused by diacetyl.9 Apart from the catabolic degradation of α-acetolactate to acetoin, ALDC also participates in the biosynthesis of branched-chain amino acids.10–12
Up to now, the functionally characterized and structurally solved ALDCs are those from Bacillus subtilis (B.s.-ALDC),13 Bacillus brevis (B.b.-ALDC),14 Brevibacillus brevis9 and Lactococcus lactis subsp. lactis.11 X-ray crystal structures of ALDCs from Bacillus subtilis13 and Bacillus brevis15 show that both of the ALDCs feature a two-domain α/β tertiary structure, in which the N-terminal domain is composed of a seven-stranded mixed β-sheet. In the asymmetric unit cell, the dimer assembly is composed of the seven-stranded mixed β-sheet, which extends into the equivalent β-sheet of the two-fold symmetry-related molecule, forming a fourteen-stranded β-sheet. The structures of a series of designed transition state analogues in complex with B.b.-ALDC suggest a catalytic mechanism. ALDC catalyses not only the decarboxylation of the favoured (S)-AL but also the isomerization via carboxyl migration and subsequent decarboxylation of the less-favoured (R)-substrate.15 In addition, two groups16 simulated the catalytic processes using the hybrid quantum mechanical/molecular mechanical (QM/MM) calculations. Even though the amino sequence identities between B.b.-ALDC and B.s.-ALDC are very low (only 30%), the active centre is well-conserved. By docking the two enantiomers of AL into the crystal structure of B.s.-ALDC, Ji et al. simulated the binding interaction of the substrates and investigated the substrate preference. A more stable binding of (S)-AL versus (R)-AL is revealed by the lower binding free energy.13
Due to less structural knowledge of ALDCs, the determination of the structural characteristics of the E.c.-ALDC is essential to obtain new insights into its catalytic reaction. We thus cloned, expressed and characterized the ALDC from Enterobacter cloacae. Here, we report the crystal structure of E.c.-ALDC at a resolution of 2.4 Å, which provides an original view of the structural features of E.c.-ALDC and investigate the structure-function relationship of E.c.-ALDC. In the active site, the conserved His199, His201 and His212 residues preserve the overall structure of the ALDC, except Arg150, which orients away from the active site, forming hydrogen bonds with residues at the C-terminus. Additionally, Arg150 was proven to maintain the same conformation and showed no contacts with the substrates though molecular docking complexes of E.c.-ALDC with (S)-AL and (R)-AL. The fully characterized activities and structure of the enzyme provide insights into ALDCs for the bioproduction of acetoin.
Results and discussion
Enzymatic and kinetic properties of E.c.-ALDC
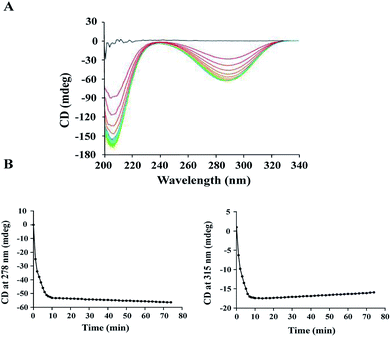
The activity of ALDC was previously studied using the Voges–Proskauer (VP) assay.29 However, it was challenging to obtain reproducible results using this assay since the substrate and the colour regent are not stable during the reaction. To avoid this problem, we carried out an enzymatic assay on B.s.-ALDC using CD as our research technique.13 The CD spectra of (S)-AL and (R)-AC are reported30–32 and are sufficiently different to allow for the monitoring of the enzyme activity assay. At the beginning, no CD signal was observed due to the racemic substrate, whereas the spectra for (R)-AL and (R)-AC appeared in addition to the enzyme. The signal for (R)-AL was observed because the enzymatic turnover of (S)-AL produces an excess of (R)-AL (Fig. 1A). Two wavelengths at 278 nm and 315 nm were identified to monitor the assay reaction. As presented in Marlow's work, at 278 nm, the formation of (R)-AC can be monitored. At this point, the CD signal for (S)-AL crosses the axis and has no signal. Though the slope is negative because of the negative peak, but it is proportional to the formation rate of (R)-AC. At 315 nm the CD signal for (R)-AC is zero and only the tail of a positive (S)-AL peak is observed. This is the disappearance of a positive peak so the rate observed reflects the loss of (S)-AL over time. At 278 nm, the formation of (R)-AL can be observed initially at a faster rate, followed by a slower rate (Fig. 1B, left). At 315 nm, the (±)-AL signal initially started at zero, and the rapid formation of a negative peak formed due to an excess of (R)-AL from the enzymatic turnover of (S)-AL. Subsequently, the peak begins to disappear at a slower rate as the enzyme turnover for the remaining (R)-AL slows (Fig. 1B, right). As the signal for (R)-AC was stronger than that for (±)-AL, the activity was calculated using the signals at 278 nm, and the specific activity of E.c.-ALDC (±)-AL was 1024.37 U mg−1. The rate was converted from units of mdeg s−1 into units of mM s−1 by using molar ellipticity and then into specific activity with units of μmol mg−1 min−1.Kinetic studies were conducted on E.c.-ALDC over a concentration range of (±)-AL. Kinetic data were calculated based on curve fitting to the Lineweaver–Burk double reciprocal curve for three replicates. The calculated Michaelis–Menten constant (Km) and turnover number (kcat) values of E.c.-ALDC were 12.19 mM and 0.96 s−1, respectively. In our previous work studying B.s.-ALDC, the Km and kcat values of B.s.-ALDC were 21 mM and 2.21 s−1.13 However, in the kinetic analysis of B.s.-ALDC, Marlow and his coworker15 simultaneously measured B.s.-ALDC kinetic parameters by the NADH method with (±)-AL and the CD method with (S)-AL, yielding Km = 0.25 ± 0.08 mM and kcat = 5.99 ± 0.95 s−1 for the former and Km = 4.31 ± 1.14 mM and kcat = 29.59 ± 2.96 s−1 for the latter. ALDC activity has been detected only among certain bacterial species, such as Bacillus sp. and Lactobacillus sp.,33 and the ALDCs from different bacteria displayed different physical and chemical properties. In the thermophilic cell-free cascade enzymatic reaction for acetoin synthesis from pyruvate, Jia et al. used creatine and α-naphthol with the Vmax and Km values for pyruvate by B.s.-ALDC were 2.34 ± 0.03 μmol min−1 mg−1 and 60.51 ± 2.67 mM, respectively, under the optimum conditions.34
Optimization of the decarboxylation conditions
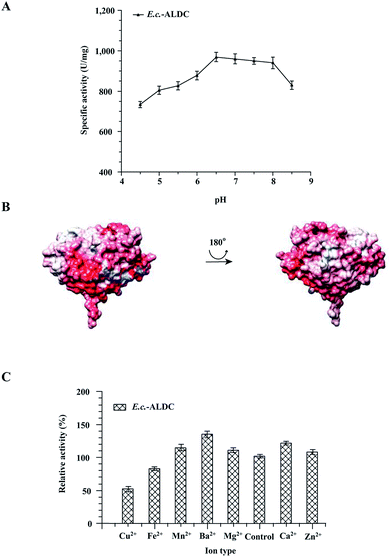
To test the impact of pH changing the enzyme activity of E.c.-ALDC, the activity assays were carried out with pH levels ranging from 4.5 to 8.5, and the results are presented in Fig. 2A. The highest activity of E.c.-ALDC enzyme was observed at pH 6.5, and the activity was 963 ± 28 U mg−1. At pH values ranging from 4.5 to 6.0, the activity of E.c.-ALDC dropped dramatically. As indicated by the results, E.c.-ALDC activity is more effectively inhibited at an acidic pH than at an alkaline pH. These results suggest that the secondary interaction (ionic and polar interactions, hydrogen bonding) within the enzyme was stable, resulting in improved ALDC tolerance to alkaline conditions.35 The ALDC from Bacillus subtilis exhibited the maximum activity at pH 5.0.13 The ALDC from Lactobacillus casei DSM 2547 showed a relatively high activity at pH 4.5 to 5.0.36 The ALDC from Lactococcus lactis had an optimum pH of pH 6.0.37 Moreover, the electrostatic surface properties of E.c.-ALDC were investigated (Fig. 2B) with an environmental pH of 7.0. The calculated theoretical isoelectric point (pI) of E.c.-ALDC was 5.4. The E.c.-ALDC revealed two differently charged faces. One face was mostly neutral with two negatively charged areas, while the second face was highly negatively charged.As is reported in the crystal structures of ALDCs, Zn2+ plays a very important role in stabilizing the substrates and is involved in electron transfer. The effects of various metal ions on E.c.-ALDC were investigated. EDTA was used to chelate the metal ions of E.c.-ALDC, which were then measured by an inductively coupled plasma (ICP) technique. As indicated in Fig. 2C, Mn2+, Ba2+, Mg2+, Zn2+ and Ca2+ greatly improved the activity of E.c.-ALDC, while Fe2+ inhibited the activity of E.c.-ALDC. Cu2+ significantly decreased the activity of E.c.-ALDC. In fact, the function of many decarboxylases requires a divalent ion as a cofactor. ALDC from Lactococcus lactis DX was activated by Fe2+, Zn2+, Mg2+, Ba2+ and Ca2+ and was significantly inhibited by Cu2+.38 Some of the metal ions do not function as catalytic centres. For example, the Zn2+ ion in the biotin-dependent decarboxylases helped to properly orient the substrate, while the Mg2+ ion in the ThDP-dependent decarboxylases assisted in binding the thiamine cofactor.39,40 For NAD(P)+-dependent decarboxylases, such as malic enzymes, a divalent metal ion (Mn2+ or Mg2+) presented significant influences on both catalysis and structural stability.41
Overall structure of E.c.-ALDC
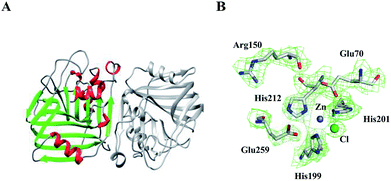
The crystal structure of E.c.-ALDC comprises two domains of α/β tertiary structure, in which each domain contains a seven-stranded mixed β-sheet. This is essentially the same as the already described crystal structures of B.s.-ALDC13 and B.b.-ALDC.42 These two β-sheets form a nearly parallel intramolecular surface (back-to-back) (Fig. 3A). In-between this surface, the shortest distance of all Cα atoms of the backbone chain is 6.2 Å between Ile72 and His201. The N-terminal domain consists of a seven-stranded mixed β-sheet, whereas the C-terminal domain consists of a five-stranded β-sheet, two of which elongate with a 180 degree turn generating two β-sheet strands. Two ALDC molecules are present in the asymmetric unit, and they exhibit an average pairwise backbone atom root mean square deviation (RMSD) value of 0.26 Å, exhibiting highly structural consistency. The seven-stranded mixed β-sheet on the N-terminal domain of E.c.-ALDC extends into the equivalent β-sheet of the two-fold symmetry-related molecule, resulting in a fourteen-stranded β-sheet that spans the physiologically relevant dimeric assembly, with the same structures as B.b.-ALDC42 and B.s.-ALDC,15 which might shed light on the dimer formation (Fig. 3A).In the structure of E.c.-ALDC, the electron density for the active centre residues is well resolved (Fig. 3B). A Zn2+ ion coordinated by His199, His201 and His212 together with Glu259 from the C-terminal tail, and these residues are highly conserved in ALDCs (Fig. 2B). In addition, the other two highly conserved Glu70 and Arg150 are also presented in this structure. In the catalytic domain of B.s.-ALDC, molecular docking results exhibit a similar conservative structure, a Zn2+ ion coordinated by His191, His193 and His201. Glu251, Glu62 and Arg142 interact with the substrate through hydrogen bonds. Three histidine-coordination of a metal ion is widely found in the structures of enzymes, for instance, manganese in oxalate decarboxylase,5 copper in quercetin 2,3-dioxygenase,43 and zinc in carbonic anhydrase.44 In the transition state, analogue structures of B.b.-ALDC with (2S,3S)-2,3-dihydroxy-2-methylbutanoic acids (PDB ID: 4BT4) and (2S,3R)-2,3-dihydroxy-2-methylbutanoic acids (PDB ID: 4BT5), the Glu65, Arg145, and Glu253 residues contact the analogues through hydrogen bonds, and the inhibitors adopt essentially identical conformations. Meanwhile, Glu65 and Arg145 also form stabilizing hydrogen bonds with the analogues.15
Comparisons of ALDC structures
We compared the structures of E.c.-ALDC, B.b.-ALDC (PDB ID: 4BT2) and B.s.-ALDC (PDB ID: 5NXE). Despite the low sequence identities of E.c.-ALDC with B.s.-ALDC and B.b.-ALDC, the superimposition of the overall structure of E.c.-ALDC onto that of B.b.-ALDC (Fig. 4B, upper left) and B.s.-ALDC (Fig. 4B, upper right) yields an average pairwise RMSD value of 0.712 Å and 0.752 Å, respectively, for the backbone atoms. The evolutionary tree of these three ALDCs is shown in Fig. 4A. The low RMSD value indicates that the overall structure of the E.c.-ALDC is similar to the structures of B.b.-ALDC and B.s.-ALDC. We also superimposed the highly conserved amino acid residues in the active site (His199, His201 His212, Glu70, Glu259, Arg150 and Thr63) onto those of B.b.-ALDC (Fig. 4B, lower left) and B.s.-ALDC (Fig. 4B, lower right). Apart from Arg150, the coordinates of the side chains of the remaining residues overlay well.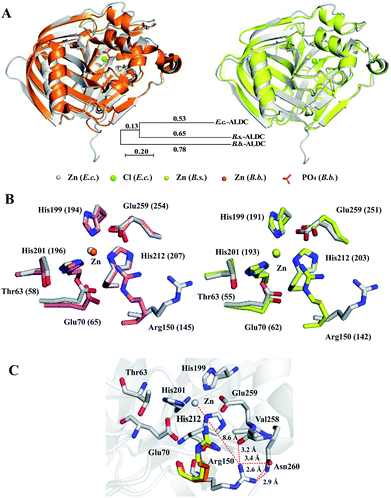 | ||
| Fig. 4 Crystal structure comparisons within E.c.-ALDC, B.s.-ALDC and B.b.-ALDC. (A) The crystal structure of E.c.-ALDC (grey) is superimposed onto B.b.-ALDC (pink, PDB ID: 4BT7) and B.s.-ALDC (yellow, PDB ID: 5XNE). (B) Active site superimposed between E.c.-ALDC and B.b.-ALDC (pink, PDB ID: 4BT7) and between E.c.-ALDC and B.s.-ALDC (yellow, PDB ID: 5XNE), including Thr63, His199, His201, His212, Glu70, Glu255, and Arg150. (B.b.-ALDC: Thr58, His194, His196, His207, Glu65, Glu254, and Arg145), (B.s.-ALDC: Thr55, His191, His193, His204, Glu62, Glu251, and Arg142). (C) Intramolecular interactions of Arg150 (grey, E.c.-ALDC; Arg145, pink, B.b.-ALDC; Arg142, yellow, B.s.-ALDC) with Val258, Glu259 and Asn260. | ||
The orientation of the side chain of Arg150 in the structure of E.c.-ALDC differs from the arginine in B.s.-ALDC and in B.b.-ALDC. In E.c.-ALDC, the side chain of Arg150 orients away from the active site centre with an angle of 50 degrees. In addition to the highly conserved Thr58 and Glu65 in B.b.-ALDC, arginine at the corresponding site is also highly conserved in the vicinity of the metal. Likewise, in E.c.-ALDC, the distance between the zinc ion and the NH2 group of the side chain of Arg150 is 8.6 Å; however, in B.s.-ALDC and B.b.-ALDC, this distance is extremely smaller, 4.0 Å and 3.9 Å, respectively. In fact, both of the NH2 groups in the side chain of the arginine residue (Arg142 in B.s.-ALDC and Arg145 in B.b.-ALDC) forms hydrogen bonds with the oxygen atom of the glutamate residue (Glu250 in B.s.-ALDC and Glu253 in B.b.-ALDC). In E.c.-ALDC, the NH2 group of Arg150 forms a hydrogen bond with the oxygen atom of the backbone of Val258 (3.2 Å). The NH2 group of Arg150 is in close proximity to the ND2 group of Asn260 with a distance of 2.9 Å (Fig. 4C). It is possible that the unique conformation of Arg150 causes a loss of function in stabilizing the substrate.
The glutamate at the active centre plays a significant role during the decarboxylation reaction. The highly conserved Glu259 in E.c.-ALDC conducted a similar structure conformation as the corresponding glutamate structure in B.s.-ALDC and B.b.-ALDC. The distance between the carbonyl group of the side chain and the zinc ion of Glu259 is 3.6 Å, while in the structures of B.s.-ALDC and B.b.-ALDC, the distances are 3.5 Å and 4.0 Å, respectively. In the crystal structure of B.b.-ALDC in complex with transient intermediate analogues, glutamate forms a hydrogen bond with the analogues.15 Meanwhile, in the docking models of B.b.-ALDC with (S)-AL, the carboxyl group of Glu253 forms a hydrogen bond with Arg145 in the active site.9 In the rearrangement process, the hydrogen bond between Glu253 and the carboxyl of (R)-AL is critical when the carboxyl rearranges to the adjacent carbonyl carbon to form (S)-AL.16
Molecular docking with substrate
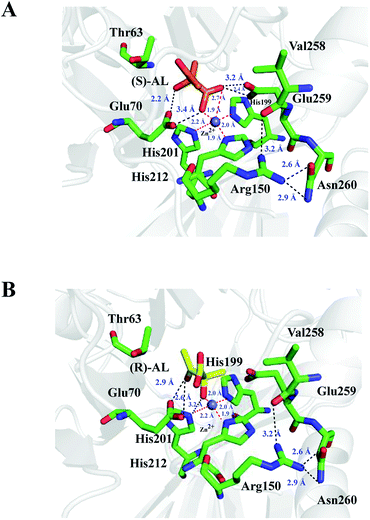
The complex structures of E.c.-ALDC with (S)-AL and (R)-AL were prepared on the basis of crystal structures of B.b.-ALDC in complex with two transition state analogues. The energy optimized structures are displayed in Fig. 5. In the complex structure of (S)-AL and E.c.-ALDC, the Zn2+ ion forms a pentacoordinated structure with the nearby His199, His201 and His212 at distances of 1.9, 2.0 and 2.2 Å, respectively, and with the oxygen atoms on the carboxyl and hydroxyl groups of (S)-AL at distances of 1.9 and 2.7 Å, respectively; this indicates a strong coordination interaction of the Zn2+ ion with the three histidine residues and the substrate (Fig. 5A). These interaction networks are also presented in the models of B.s.-ALDC with (S)-AL13 and B.b.-ALDC with (S)-AL9,16 via the molecular docking method. The role of the Zn(II), as a Lewis acid, is best understood in terms of the reverse reaction of acetoin carboxylation. The mode of binding for the (R,R)-dihydroxy-2-methylbutanoic acids (PDB ID: 4BT5) isomer supports the proposed decarboxylation mechanism for the natural (S)-enantiomer, also involving transient binding of the departing CO2 to the zinc ion. In addition, the side chain of Glu70 (Glu65 in B.s.-ALDC and Glu62 in B.b.-ALDC) has polar interactions with (S)-AL. Likewise, Arg150 maintains the interactions with Val258, Glu259 and Asn260 as in the apo structure of E.c.-ALDC and did not change its unique conformation in the presence of (S)-AL. Thus, Arg150 is not able to preserve the critical role in stabilizing the Zn2+ ion, which differs from the corresponding arginines in B.b.-ALDC and B.s.-ALDC. In the transition state, analogue structures of B.b.-ALDC in complex with (2S,2S)-2,3-dihydroxy-2-methylbutanoic acid (PDB ID: 4BT4) and (2S,2R)-2,3-dihydroxy-2-methylbutanoic acid, Arg145 contacts the analogues through hydrogen bonds, and the inhibitors adopt essentially identical conformations. Arg145 is well positioned to potentially assist delivery of the proton, which creates a new chiral centre in B.b.-ALDC.15 In the docking model of B.s.-ALDC with (S)/(R)-AL, a hydrogen bond between the OH of (R)-AL and the side chain of Arg142 is observed, while no hydrogen bond formed in B.s.-ALDC with (S)-AL.13 In the transition state of analogue structures of B.b.-ALDC in complex with (2S,2S)-dihydroxy-2-methylbutanoic acid (PDB ID: 4BT4) and (2S,2R)-dihydroxy-2-methylbutanoic acid, Arg145 contacts the analogues through hydrogen bonds, and the inhibitors adopt essentially identical conformations.The binding mode of E.c.-ALDC with (R)-AL slightly differs from the binding mode of (S)-AL. As shown in Fig. 5B, (R)-AL adopts a perpendicular conformation to that of (S)-AL in E.c.-ALDC with its polar groups facing Glu259. The hydroxyl and carboxyl groups of (R)-AL are further from Glu259, forming hydrogen bonds with the OE1 and OE2 groups of Glu259 at a distance of 2.7 and 4.2 Å, respectively. Thus, the Zn2+ ion only forms a tetracoordinated structure with His199, His201, His212 and the substrate, with binding distances of 1.9, 2.0, 2.2 and 2.0 Å, respectively. These hydrogen bonds stabilize the substrate in the active site of the enzyme. Arg150 in this model exhibits no conformational changes without interacting with (R)-AL. Again, Arg150 is unlikely to stabilize the substrate or deliver the proton in the catalytic function of E.c.-ALDC. To our knowledge, (R)-AL is not the natural substrate of ALDCs, while (S)-AL is. Correspondingly, in the cocrystallized complexes of B.b.-ALDC with the substrate analogues, the promoting carboxylate rearrangement mechanism of (R)-AL into (S)-AL was observed and proposed.42
Experimental
Materials and methods
The kinetic parameters (Km and kcat values) of E.c.-ALDC were calculated by measuring enzyme activity using various initial concentrations (53.4, 26.7, 17.8, 13.3, 10.7, 8.9, 7.6, 6.7, 5.9 and 5.3 mM) of (±)-AL at 30 °C and pH 6 and fitting to a double reciprocal curve by a Lineweaver–Burk plot. The process was monitored by CD as described above.
![[thin space (1/6-em)]](https://www.rsc.org/images/entities/char_2009.gif) 23 and PHENIX.24 The stereochemical quality of the final model was assessed with MolProbity.25 In total, 96% and 4% of all residues are located in the favoured and allowed regions of the Ramachandran plot, respectively, and no residues were found in the disallowed region. The atomic coordinates and structure factor for E.c.-ALDC have been deposited in the Protein Data Bank (accession code 5YHO). All structure figures were prepared using PyMOL.26 A summary of the data-collection processing and structure-refinement statistics is given in Table 1.
23 and PHENIX.24 The stereochemical quality of the final model was assessed with MolProbity.25 In total, 96% and 4% of all residues are located in the favoured and allowed regions of the Ramachandran plot, respectively, and no residues were found in the disallowed region. The atomic coordinates and structure factor for E.c.-ALDC have been deposited in the Protein Data Bank (accession code 5YHO). All structure figures were prepared using PyMOL.26 A summary of the data-collection processing and structure-refinement statistics is given in Table 1.
| a Values for the highest resolution bin are given in parentheses. | ||
|---|---|---|
| Data collection | ||
| Space group | P1211 | |
![[thin space (1/6-em)]](https://www.rsc.org/images/entities/char_2009.gif) |
||
| Cell dimensions | ||
| a, b, c (Å) | 45.832, 59.981, 80.818 | |
| α, β, γ (°) | 90.00, 108.17, 90.00 | |
| Total reflections | 64![[thin space (1/6-em)]](https://www.rsc.org/images/entities/char_2009.gif) 798 (6054) 798 (6054) |
|
| Unique reflections | 16![[thin space (1/6-em)]](https://www.rsc.org/images/entities/char_2009.gif) 057 (1551) 057 (1551) |
|
| Resolution (Å) | 47.27–2.40 | (2.49–2.40) |
| Rmerge | 0.075 | (0.244) |
| 〈I/σI〉 | 23.47 | (8.58) |
| Completeness (%) | 97.69 | (88.35) |
| 〈Redundancy〉 | 4.0 | (3.9) |
![[thin space (1/6-em)]](https://www.rsc.org/images/entities/char_2009.gif) |
||
| Refinement | ||
| Resolution (Å) | 47.27–2.40 | (2.46–2.40) |
| No. reflections | 16![[thin space (1/6-em)]](https://www.rsc.org/images/entities/char_2009.gif) 044 044 |
(1538) |
| Rwork/Rfree | 0.211/0.272 | (0.223/0.251) |
![[thin space (1/6-em)]](https://www.rsc.org/images/entities/char_2009.gif) |
||
| No. atoms | ||
| Protein | 3742 | |
| Water | 111 | |
![[thin space (1/6-em)]](https://www.rsc.org/images/entities/char_2009.gif) |
||
| B-factors | ||
| Protein | 40.20 | |
| Water | 37.00 | |
![[thin space (1/6-em)]](https://www.rsc.org/images/entities/char_2009.gif) |
||
| RMSD | ||
| Bond lengths (Å) | 0.004 | |
| Bond angles (°) | 0.97 | |
Conclusions
In this study, we report the enzymatic characterizations and original structure of ALDC from Enterobacter cloacae. Despite its high affinity for substrates at a Km of 12.19 mM, the enzyme presented low catalytic efficiency. The structure of E.c.-ALDC preserved the typical conservative conformation of known ALDCs. Surprisingly, Arg150 exhibits a tilted orientation away from the active centre and loses its interaction with the zinc ion. Furthermore, by docking the substrates into the structure of E.c.-ALDC, no direct contacts are observed between Arg150 and the substrates. Thus, we believe that the unique conformation of Arg150 might explain the lower enzymatic activity of E.c.-ALDC compared to that of the previously characterized ALDCs. However, further experimental cocrystallization studies are needed in the future to prove our hypothesis and in silico calculations. Our E.c.-ALDC structure provides very important clues to the catalytic mechanism of ALDCs.Conflicts of interest
There are no conflicts of interest to declare.Acknowledgements
Feida Long helped with the docking work. Additionally, we would like to thank the financial support from the National Science Foundation of China with grant number 21506025 and the Dalian University of Technology Science Foundation with grant number DUT8LK08.Notes and references
- B. Zhang, X. L. Li, J. Fu, N. Li, Z. Wang, Y. J. Tang and T. Chen, PLoS One, 2016, 11, e0159298 CrossRef PubMed.
- J. W. Jang, H. M. Jung, D. G. Kim and M. K. Oh, Korean Chem. Eng. Res., 2017, 55, 237–241 CAS.
- J. W. Jang, H. M. Jung, D. K. Im, M. Y. Jung and M. K. Oh, Enzyme Microb. Technol., 2017, 106, 114 CrossRef CAS PubMed.
- L. Zhang, Q. Liu, Y. Ge, L. Li, C. Gao, P. Xu and C. Ma, Green Chem., 2016, 18, 1560–1570 RSC.
- R. Anand, P. C. Dorrestein, C. Kinsland, T. P. Begley and S. E. Ealick, Biochemistry, 2002, 41, 7659–7669 CrossRef CAS PubMed.
- S. Li, X. Gao, N. Xu, L. Liu and J. Chen, Microb. Cell Fact., 2014, 13, 55 CrossRef PubMed.
- M. H. Choi, S. J. Kim, J. W. Kim, H. J. Sim, Y. C. Park and J. H. Seo, Bioresour. Technol., 2016, 51, 170–176 CAS.
- S. Qian, C. Wang, H. Wang, F. Yu, C. Zhang and H. Yu, Process Biochem., 2015, 50, 1388–1393 CrossRef CAS.
- C. Zhao, H. Su and Y. Liu, RSC Adv., 2016, 6, 80621–80629 RSC.
- N. N. M. C. Renna, L. R. Winik and S. A. Zahler, J. Bacteriol., 1993, 175, 3863–3875 CrossRef PubMed.
- N. Goupilfeuillerat, M. Cocaignbousquet, J. J. Godon, S. D. Ehrlich and P. Renault, J. Bacteriol., 1997, 179, 6285–6293 CrossRef CAS.
- C. Monnet, M. Nardi, P. Hols, M. Gulea, G. Corrieu and V. Monnet, Lett. Appl. Microbiol., 2010, 36, 399–405 CrossRef.
- F. Ji, M. Li, Y. Feng, S. Wu, T. Wang, Z. Pu, J. Wang, Y. Yang, S. Xue and Y. Bao, Appl. Microbiol. Biotechnol., 2018, 102, 1–13 CrossRef PubMed.
- S. Najmudin, J. T. Andersen, S. A. Patkar, T. V. Borchert, D. H. G. Crout and V. Fülöp, Acta Crystallogr., 2003, 59, 1073–1075 CrossRef.
- V. A. Marlow, D. Rea, S. Najmudin, M. Wills and V. Fueloep, ACS Chem. Biol., 2013, 8, 2339–2344 CrossRef CAS PubMed.
- C.-B. Zhuang and Q.-C. Zheng, RSC Adv., 2016, 6, 91852–91859 RSC.
- N. A. Baker, D. Sept, S. Joseph, M. J. Holst and J. A. Mccammon, Proc. Natl. Acad. Sci. U. S. A., 2001, 98, 10037–10041 CrossRef CAS PubMed.
- T. J. Dolinsky, J. E. Nielsen, J. A. Mccammon and N. A. Baker, Nucleic Acids Res., 2004, 32, 665–667 CrossRef PubMed.
- W. L. Delano, The PyMOL User's Manual, DeLano Scientific, San Carlos, CA, USA, 2002 Search PubMed.
- Z. Otwinowski and W. Minor, Macromolecular Crystallography, Pt A, 1997, vol. 276, pp. 307–326 Search PubMed.
- A. J. McCoy, R. W. Grosse-Kunstleve, P. D. Adams, M. D. Winn, L. C. Storoni and R. J. Read, J. Appl. Crystallogr., 2007, 40, 658–674 CrossRef CAS PubMed.
- P. Emsley, B. Lohkamp, W. G. Scott and K. Cowtan, Acta Crystallogr., 2010, 66, 486–501 CrossRef CAS PubMed.
- G. N. Murshudov, P. Skubák, A. A. Lebedev, N. S. Pannu, R. A. Steiner, R. A. Nicholls, M. D. Winn, F. Long and A. A. Vagin, Acta Crystallogr., 2011, 67, 355–367 CrossRef CAS PubMed.
- P. D. Adams, P. V. Afonine, G. Bunkóczi, V. B. Chen, I. W. Davis, N. Echols, J. J. Headd, L. W. Hung, G. J. Kapral and R. W. Grosse-Kunstleve, Acta Crystallogr., Sect. D: Biol. Crystallogr., 2010, 66, 213–221 CrossRef CAS PubMed.
- V. B. Chen, W. B. A. Iii, J. J. Headd, D. A. Keedy, R. M. Immormino, G. J. Kapral, L. W. Murray, J. S. Richardson and D. C. Richardson, Acta Crystallogr., 2010, 66, 12–21 CrossRef CAS PubMed.
- Schrodinger, LLC, The PyMOL Molecular Graphics System, Version 1.8., 2015 Search PubMed.
- M. F. Sanner, J. Mol. Graphics Modell., 1999, 17, 57–61 CAS.
- G. M. Morris, D. S. Goodsell, R. S. Halliday, R. Huey, W. E. Hart, R. K. Belew and A. J. Olson, J. Comput. Chem., 2015, 19, 1639–1662 CrossRef.
- B. Diderichsen, U. Wedsted, L. Hedegaard, B. R. Jensen and C. Sjøholm, J. Bacteriol., 1990, 172, 4315 CrossRef CAS PubMed.
- D. H. G. Crout and S. M. Morrey, J. Chem. Soc., Perkin Trans. 1, 1983, 2435–2440, 10.1039/P19830002435.
- A. F. Drake, G. Siligardi, D. H. G. Crout and D. L. Rathbone, J. Chem. Soc., Chem. Commun., 1987, 24, 1834–1835 RSC.
- M. Vinogradov, A. Kaplun, M. Vyazmensky, S. Engel, R. Golbik, K. Tittmann, K. Uhlemann, L. Meshalkina, Z. Barak and G. Hübner, Anal. Biochem., 2005, 342, 126–133 CrossRef CAS PubMed.
- S. E. Godtfredsen, H. Lorck and P. Sigsgaard, Carlsberg Res. Commun., 1983, 48, 239–247 CrossRef CAS.
- X. Jia, Y. Liu and Y. Han, Sci. Rep., 2017, 7, 4333 CrossRef PubMed.
- S. L. Hosseinipour, M. S. Khiabani, H. Hamishehkar and R. Salehi, J. Nanopart. Res., 2015, 17, 382 CrossRef.
- A. M. Rasmussen, R. M. Gibson, S. E. Godtfredsen and M. Ottesen, Carlsberg Res. Commun., 1985, 50, 73–82 CrossRef CAS.
- K. Ius, V. M. Serebrennikov, N. A. Zagustina and A. M. Bezborodov, Prikladnaia Biokhimiia I Mikrobiologiia, 2000, 36, 131 Search PubMed.
- Y. Guo, D. Pan, H. Ding, Z. Wu, Y. Sun and X. Zeng, J. Sci. Food Agric., 2015, 95, 1655–1661 CrossRef CAS PubMed.
- W. Buckel, Methods Enzymol., 1986, 125, 547–558 CAS.
- C. Vogel and J. Pleiss, Proteins: Struct., Funct., Bioinf., 2014, 82, 2523–2537 CrossRef CAS PubMed.
- N. Niedzwiecka, J. Gronczewska and E. F. Skorkowski, Fish Physiol. Biochem., 2017, 43, 351–360 CrossRef CAS PubMed.
- V. A. Marlow, D. Rea, S. Najmudin, M. Wills and V. Fülöp, ACS Chem. Biol., 2013, 8, 2339–2344 CrossRef CAS PubMed.
- F. Fusetti, K. H. Schroter, R. A. Steiner, P. I. van Noort, T. Pijning, H. J. Rozeboom, K. H. Kalk, M. R. Egmond and B. W. Dijkstra, Structure, 2002, 10, 259–268 CrossRef CAS PubMed.
- Z. Fisher, J. A. H. Prada, C. Tu, D. Duda, C. Yoshioka, H. Q. An, L. Govindasamy, D. N. Silverman and R. McKenna, Biochemistry, 2005, 44, 1097–1105 CrossRef CAS PubMed.
Footnote |
| † These two authors contributing equally to the paper. |
| This journal is © The Royal Society of Chemistry 2018 |

