 Open Access Article
Electricity generation of a laminar-flow microbial fuel cell without any additional power supply†
Dingding Ye *ab,
Pengqing Zhangab,
Xun Zhu
 *ab,
Yang Yangab,
Jun Li
 ab,
Qian Fuab,
Rong Chenab,
Qiang Liaoab and
Biao Zhangab
aKey Laboratory of Low-grade Energy Utilization Technologies and Systems (Chongqing University), Ministry of Education, Chongqing 400030, China. E-mail: dingdingye@cqu.edu.cn; zhuxun@cqu.edu.cn
bInstitute of Engineering Thermophysics, Chongqing University, Chongqing 400030, China
First published on 1st October 2018
Abstract
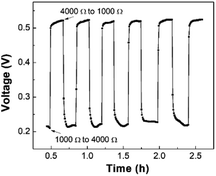
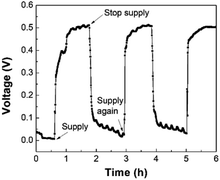
Laminar-flow microbial fuel cells (LFMFCs) utilize the co-laminar flow feature in the microchannel as a virtual barrier to separate the anolyte and catholyte. However, for LFMFCs reported before, syringe pumps were always used to drive the fluid and form the co-laminar flow of anolyte and catholyte in the microchannel, reducing the net power output and the efficiency of the whole system. In this study, a laminar-flow microbial fuel cell (LFMFC) without any additional power supply is proposed. The LFMFC is successfully started-up after inoculation for 90 h. The anode biofilm distribution becomes sparser along the flow direction due to the thicker boundary layer and unfavorable crossover from the catholyte downstream. Moreover, the LFMFC delivers a maximum volumetric power density of 3200 W m−3, which is higher than that of previous LFMFCs without membranes. Considering the practical application of LFMFC as a power source, the cell voltage responses to different conditions are further investigated. When the external resistance is switched between 1000 Ω and 4000 Ω, it takes the LFMFC 10 minutes to reach a stable voltage output. However, the voltage response to the intermittent supply takes 1 h to reach a stable value. Additionally, short-term cold storage has little effect on bacterial metabolic activity and cell voltage.
1. Introduction
Microbial fuel cells (MFCs) are bio-electrochemical systems that harness microbial metabolism to convert waste energy into bioelectricity.1,2 In recent decades, efforts have been made to develop MFCs to obtain clean and renewable energy. Generally, MFCs can be classified as macro-sized or micro-sized (μMFCs) according to the volume of the reactors and the electrode surface areas. Owing to their low cost, intrinsic small scale, easy assembly and precise control, μMFCs have received considerable attention as environmental monitors, medical kits, bacterial screening, and biosensors.2–4Conventional μMFCs are directly scaled down from macro dual-chamber MFCs, which consist of an anode and a cathode chamber and a proton exchange membrane (PEM) to separate them. However, μMFCs with membranes delivered a relatively poor performance due to high internal resistance, which is greatly affected by anode materials.5 Although gold is highly conductive and compatible with microfabrication methods as anodes in μMFCs,6–9 poor interactions between anode bacteria and the gold electrode lead to high internal resistance.7,10 Compared with gold, carbon materials exhibit better contact with bacteria and smaller internal resistance, and a lower cost for μMFCs. Qian et al. designed a micro-MFC with sub-5 μL chamber with carbon cloth electrodes, which generated a power density of 62.5 W m−3. The total internal resistance was reduced from 30 kΩ (gold anode) to 16 kΩ, which was still high for the μMFC.11 Jiang et al. proposed a flow-through μMFC using 3D graphene foam as an anode, which had an estimated internal resistance of 7.3 kΩ.12
Recently, micro MFCs without membranes, also called laminar-flow microbial fuel cells (LFMFCs), have attracted much attention, which contain a virtual barrier controlled by the co-laminar flow to separate the anolyte and catholyte.13–17 The membrane-less structure can reduce both the fabrication cost and the internal resistance of the fuel cell. The first μ-scale membraneless microbial fuel cell was proposed by Li et al., which used Shewanella oneidensis and produced a maximum current density of 25.42 mA m−2.18 After that, owing to their short hydraulic retention time and fast response, membrane-less bio-electrochemical systems were used to detect microbial electrochemical activity19,20 and bacterial growth and respiration.14 Moreover, in our previous study, a non-uniform biofilm distribution along the microchannel in the graphite electrode-based LFMFC was observed.15 To enhance the biofilm distribution and performance, LFMFCs with different geometries and multiple anolyte inlets were further investigated.16,17 The internal resistance was as low as 1092 Ω for the LFMFC with multiple inlets. However, for the LFMFCs in previous studies, syringe pumps were used to drive the fluid and form a co-laminar flow between the anolyte and catholyte in the microchannel, reducing the net power output of the whole system and limiting their miniaturization. Therefore, for practical application, it is essential to eliminate the external power supply to membrane-less LFMFCs.
In this study, a gravity-driven, membrane-less LFMFC without any external power supply was proposed and fabricated. After successful inoculation with mixed bacteria, the biofilm morphology was characterized using a scanning electron microscope (SEM). Discharging tests under different external resistances and electrochemical impedance spectroscopy (EIS) tests were conducted to estimate the cell performance and the internal resistance, respectively. Finally, the effects of the external resistance, intermittent reactant supply, and cold storage on the voltage output were investigated.
2. Materials and methods
2.1 Device fabrication
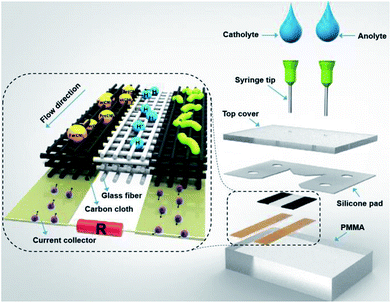
A schematic of the proposed LFMFC is illustrated in Fig. 1. Carbon cloth with a thickness of 0.37 mm (HCP331, HESEN, China) was cut into 15 mm × 5 mm pieces and to act as the anode and cathode. The electrodes were connected to thin titanium foils to deliver electrons through the external circuit. Glass fiber was placed in parallel between the anode and cathode to alleviate the diffusive mixing of the anolyte and catholyte. A silicone pad was vertically stacked to seal the fuel cell. Two cover plates were fabricated from polymethyl-methacrylate (PMMA) to hold the electrodes. The volume of the reactor chamber was 83 μL (the anode, cathode, and the middle chambers are all 27.75 μL in volume). The fully assembled LFMFC is shown in Fig. S1.†2.2 Inoculation and operation
The LFMFC was inoculated from the effluent of an acetate-fed MFC containing electroactive bacteria from the sludge of an anaerobic digester (Chongqing Banan Sewage Treatment Plant, China). The anolyte in the acetate-fed microbial fuel cell contained 1.13 g L−1 (chemical oxygen demand of 500 mg L−1) of CH3COONa·3H2O, 15.3 g L−1 of Na2HPO4·12H2O, 3 g L−1 of KH2PO4, 0.5 g L−1 of NaCl, 0.1 g L−1 of NH4Cl, 0.1 g L−1 of MgSO4·7H2O, 11 mg L−1 of CaCl2 and 1 mL L−1 of a solution of trace elements, containing 1.0 g L−1 of FeSO4·7H2O, 70 mg L−1 of ZnCl2, 100 mg L−1 of MnCl2·4H2O, 6 mg L−1 of H3BO3, 2 mg L−1 of CuCl2·2H2O, 24 mg L−1 of NiCl2·6H2O, 36 mg L−1 of Na2MoO4·2H2O and 238 mg L−1 of CoCl2·6H2O. The LFMFC was started-up under a closed circuit with an external resistance of 4000 Ω, and 50 mM potassium ferricyanide with a phosphate buffer served as the catholyte.During operation, two volumetric flasks (3 L) were used to supply the anolyte and catholyte. The anolyte and catholyte flowed into the LFMFC from the inlets of the syringe tips under the force of gravity. The LFMFC was placed at a 45° angle to make it easier for the electrolytes to flow through electrodes. The height difference between the liquid level in the anolyte/catholyte flasks and the inlet of the LFMFC was 30 cm. Two flow rate regulators were used to control the flow rates. The flow rates of the anolyte and catholyte were 700 μL min−1 and 350 μL min−1, respectively, to alleviate the crossover of the catholyte to anode. All experiments were conducted three times in a constant-temperature room (28 ± 1 °C).
2.3 Data acquisition and analysis
The biofilm morphology was observed using a FEI Nova 400 FEG-SEM. Cell voltage (U) was recorded every 30 s by an Agilent 34970 data-acquisition unit. The external resistance (R) was varied from 1.0 × 10⁵ to 10 Ω to obtain the polarization curves. The corresponding voltage was recorded until the cell reached a relatively steady state (variation < ±10 mV) for at least 20 min after each change in the external resistance during the performance test. The current (I) was calculated via Ohm's law: I = U/R, and output power (P) was calculated by the following equation: P = U × I. The current and power densities were calculated based on the volume of the anode chamber (27.75 μL).The electrochemical impedance spectroscopy (EIS) test was conducted to clarify the internal resistance using a Zennium electrochemical workstation (Zahner, Germany). A two-electrode mode was employed on the whole cell with the anode acting as the working electrode and the cathode as the counter electrode and the reference electrode. The EIS test were carried out under the open circuit condition with an AC amplitude of 10 mV and a frequency range from 10 mHz to 100 kHz.
3. Results and discussion
3.1 Visualization of co-laminar flow in the LFMFC
The co-laminar flow pattern of the anolyte and catholyte in the LFMFC was captured after assembling the device, as shown in Fig. 2. The fluid–fluid interface between the anolyte and catholyte was clear in the glass fiber, which is a porous material to ensure co-laminar flow and separate two streams.21 Moreover, the width of mixing region increased gradually along with the flow direction in the microchannel owing to transverse diffusion. This can be explained by the following scaling law
 | (1) |
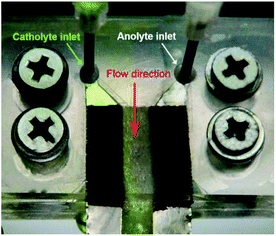 | ||
| Fig. 2 The co-laminar flow pattern of the anolyte and catholyte in the LFMFC. The green liquid is catholyte and the colorless one is anolyte. | ||
3.2 Start-up process
Connecting with an external resistance of 4000 Ω, the circuit voltage of the LFMFC was recorded during the start-up process, as shown in Fig. S2.† A 30 h lag period appeared, then the voltage went up rapidly and finally reached a stable value of 0.556 V after inoculation for 90 h. This indicates that the bacteria have been successfully inoculated on the anode surface. The start-up process of the proposed LFMFC is faster than that of the reported laminar flow-based microfluidic bio-electrochemical system with gold anodes (about 10 days).19 This is mainly ascribed to the better biocompatibility and porous structure of carbon cloth, which benefits bacterial-adhesion and the electron transfer between the bacteria and anode.22,23The surface morphologies of the anode biofilm along the flow directions were captured by SEMs, as shown in Fig. 3. The biofilm successfully formed on the surface of the carbon cloth. The densest and most uniform biofilm distribution is observed at the beginning of microchannel, while less biomass attached to the carbon cloth at the middle of the microchannel. The biofilm was sparse at the end of the microchannel. This result is consistent with our previous studies.15 The decreasing biomass along the flow direction is mainly due to the entrance effect and the mixing of the anolyte and the catholyte. Due to the entrance effect, the boundary layer thickness increases gradually along the flow direction, leading to a high mass transfer resistance and further a few bacteria attachment. Moreover, the mixing zone of the anolyte and catholyte broadens along the flow direction (eqn (1)). Once the catholyte transport crossover to the anode at the end of the microchannel, the catholyte at the anode could act as electron acceptors directly and inhibit biofilm formation. Therefore, fewer bacteria could attach to the anode surface at the downstream of the microchannel.
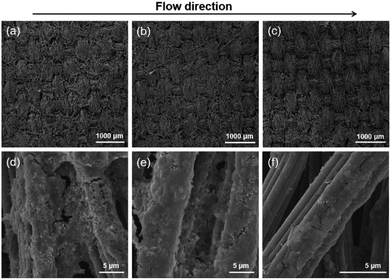 | ||
| Fig. 3 Surface morphologies of the anode biofilm (a) and (d) at the beginning, (b) and (e) middle, and (c) and (f) end of the microchannel. | ||
3.3 Internal resistance
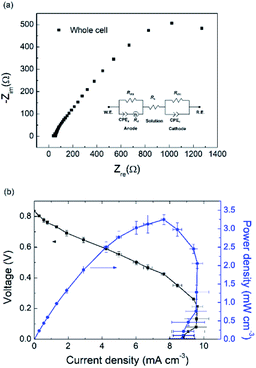
Employing carbon-based materials is an effective way to reduce the internal resistance for μMFCs because of their large surface area and functional organic groups benefiting electroactive bacteria.5,24 EIS test was carried out to analyze the internal resistance of the LFMFC as shown in Fig. 4(a). The internal resistance of the LFMFC includes the ohmic resistance, charge transfer resistance (Rct) and diffusion resistance (Rd). For the membraneless MFC, the ohmic resistance depends on the solution resistance (Rs). Through fitting the Nyquist plot, the results were obtained as follows: Rs = 53.53 Ω, Rct = 1523.7 Ω and Rd = 0.0046 Ω. The total internal resistance of the LFMFC is 1577 Ω. Therefore, the charge transfer resistance dominates the internal resistance of the LFMFC, which is in agreement with our previous results.14 The internal resistance of the proposed LFMFC is much lower than that of the μMFC with physical membrane because of the removal of ion exchange membrane and high surface to volume of the carbon electrodes.10,25,263.4 Cell performance
The polarization and volumetric power density curves were collected to evaluate the LFMFC performance by varying external resistances and the result is shown in Fig. 4(b). The maximum power density is 3.2 ± 0.1 mW cm−3 (3200 ± 100 W m−3) at a current density of 7.6 mA cm−3, which is higher than those of previous membrane-less laminar-flow microbial fuel cells (Table S1†). Compared with membrane-less LFMFCs with graphite or carbon anode as shown in Table S1,† the higher performance can be attributed to the large specific surface area of the carbon cloth and low internal resistance in this LFMFC. The current density decreased from 9.6 mA cm−3 to 8.8 mA cm−3 as the cell voltage decreased from 0.23 V to 0 V, which is referred to the “overshoot” phenomenon caused by the mass transport limitation at the anode. Under this condition, the anode biofilm was unable to provide a sufficient current for the electron acceptor.27,28 The results demonstrate that the proposed LFMFC could operate successfully without additional power supply.3.5 Voltage responses to different conditions
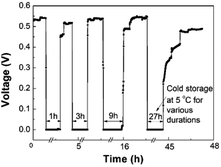
A promising application of the LFMFC is using it as a miniature power source. Therefore, it is necessary to study the cell voltage responses to different conditions, including external resistance, intermittent reactant supply, and cold storage.4. Conclusions
A membrane-free, gravity-driven LFMFC was proposed. After inoculation for 90 h, the LFMFC was successfully started-up, and uneven biofilm distribution was observed due to the entrance effect and crossover of the catholyte. Owing to the large specific surface area of the carbon cloth anode and low internal resistance in the LFMFC, a maximum volumetric power density of 3200 W m−3 was delivered. Moreover, voltage response tests showed that the LFMFC performance could recover rapidly after changing the external resistance or short-term cold storage, while it took the voltage more time to stabilize if the reactant supplies were stopped. This study demonstrates that the proposed LFMFC could operate successfully without additional power supply.Conflicts of interest
There are no conflicts of interest to declare.Acknowledgements
The authors gratefully acknowledge the financial support from the National Natural Science Foundation of China (No. 51776026), International Cooperation and Exchange of the National Natural Science Foundation of China (No. 51620105011), Program for Back-up Talent Development of Chongqing University (No. cqu2017hbrc1B06) and the Fundamental Research Funds for the Central Universities (No. 2018CDXYDL0001).References
- B. E. Logan, B. Hamelers, R. Rozendal, U. Schröder, J. Keller, S. Freguia, P. Aelterman, W. Verstraete and K. Rabaey, Environ. Sci. Technol., 2006, 40, 5181–5192 CrossRef CAS PubMed.
- C.-P.-B. Siu and M. Chiao, J. Microelectromech. Syst., 2008, 17(6), 1329–1341 CAS.
- H. Hou, L. Li, Y. Cho, P. de Figueiredo and A. Han, PLos One, 2009, 4(8), e6570 CrossRef PubMed.
- M. D. Lorenzo, A. R. Thomson, K. Schneider, P. J. Cameron and I. Ieropoulos, Biosens. Bioelectron., 2014, 62, 182–188 CrossRef PubMed.
- A. ElMekawy, H. M. Hegab, X. Dominguez-Benetton and D. Pant, Bioresour. Technol., 2013, 142, 672–682 CrossRef CAS PubMed.
- Y.-P. Chen, Y. Zhao, K.-Q. Qiu, J. Chu, R. Lu, M. Sun, X.-W. Liu, G.-P. Sheng, H.-Q. Yu, J. Chen, W.-J. Li, G. Liu, Y.-C. Tian and Y. Xiong, Biosens. Bioelectron., 2011, 26, 2841–2846 CrossRef CAS PubMed.
- S. Choi and J. Chae, Sens. Actuators, A, 2012, 177, 10–15 CrossRef CAS.
- S. Mukherjee, S. Su, W. Panmanee, R. T. Irvin, D. J. Hassett and S. Choi, Sens. Actuators, A, 2013, 201, 532–537 CrossRef CAS.
- F. Qian, M. Baum, Q. Gu and D. E. Morse, Lab Chip, 2009, 9, 3076–3081 RSC.
- S. Choi, H.-S. Lee, Y. Yang, P. Parameswaran, C. I. Torres, B. E. Rittmann and J. Chae, Lab Chip, 2011, 11, 1110–1117 RSC.
- F. Qian, Z. He, M. P. Thelen and Y. Li, Bioresour. Technol., 2011, 102, 5836–5840 CrossRef CAS PubMed.
- H. Jiang, M. A. Ali, Z. Xu, L. J. Halverson and L. Dong, Sci. Rep., 2017, 7, 41208 CrossRef CAS PubMed.
- W. Yang, K. K. Lee and S. Choi, Sens. Actuators, B, 2017, 243, 292–297 CrossRef CAS.
- A. Fraiwan, D. F. Call and S. Choi, J. Renewable Sustainable Energy, 2014, 6, 023125 CrossRef.
- D. Ye, Y. Yang, J. Li, X. Zhu, Q. Liao, B. Deng and R. Chen, Int. J. Hydrogen Energy, 2013, 38, 15710–15715 CrossRef CAS.
- Y. Yang, D. Ye, Q. Liao, P. Zhang, X. Zhu, J. Li and Q. Fu, Biosens. Bioelectron., 2016, 79, 406–410 CrossRef CAS PubMed.
- Y. Yang, D. Ye, J. Li, X. Zhu, Q. Liao and B. Zhang, Int. J. Hydrogen Energy, 2015, 40, 11983–11988 CrossRef CAS.
- Z. Li, Y. Zhang, P. R. LeDuc and K. B. Gregory, Biotechnol. Bioeng., 2011, 108(9), 2061–2069 CrossRef CAS PubMed.
- Z. Li, A. Venkataraman, M. A. Rosenbaum and L. T. Angenent, ChemSusChem, 2012, 5, 1119–1123 CrossRef CAS PubMed.
- H.-Y. Wang and J.-Y. Su, Bioresour. Technol., 2013, 145, 271–274 CrossRef CAS PubMed.
- J. P. Esquivel, F. J. Del Campo, J. L. Gómez de la Fuente, S. Rojas and N. Sabaté, Energy Environ. Sci., 2014, 7, 1744–1749 RSC.
- S. Cheng and B. E. Logan, Electrochem. Commun., 2007, 9, 492–496 CrossRef.
- J. Yang, A. Sudik, C. Wolverton and D. J. Siegel, Chem. Soc. Rev., 2010, 39, 656–675 RSC.
- Y. Fan, E. Sharbrough and H. Liu, Environ. Sci. Technol., 2008, 42, 8101–8107 CrossRef CAS PubMed.
- S. Choi and J. Chae, Sens. Actuators, A, 2013, 195, 206–212 CrossRef CAS.
- H. Ren, C. I. Torres, P. Parameswaran, B. E. Rittmann and J. Chae, Biosens. Bioelectron., 2014, 61, 587–592 CrossRef CAS PubMed.
- I. Ieropoulos, J. Winfield and J. Greenman, Bioresour. Technol., 2010, 101, 3520–3525 CrossRef CAS PubMed.
- V. J. Watson and B. E. Logan, Electrochem. Commun., 2011, 13, 54–56 CrossRef CAS.
- B. Min, Ó. B. Román and I. Angelidaki, Biotechnol. Lett., 2008, 30(7), 1213–1218 CrossRef CAS PubMed.
Footnote |
| † Electronic supplementary information (ESI) available. See DOI: 10.1039/c8ra07340f |
| This journal is © The Royal Society of Chemistry 2018 |

