
 Open Access Article
 This Open Access Article is licensed under a Creative Commons Attribution-Non Commercial 3.0 Unported Licence
Synthesis of Zn3(VO4)2/BiVO4 heterojunction composite for the photocatalytic degradation of methylene blue organic dye and electrochemical detection of H2O2†
Muhammad Munir Sajid ab,
Sadaf Bashir Khanb,
Naveed Akthar Shadac and
Nasir Amin*a
ab,
Sadaf Bashir Khanb,
Naveed Akthar Shadac and
Nasir Amin*a
aDepartment of Physics, Government College University Allama Iqbal Road, Faisalabad, 38000, Pakistan. E-mail: nasir786a@yahoo.com
bThe State Key Laboratory for New Ceramics & Fine Processing, School of Materials Science & Engineering, Tsinghua University, Beijing, 100084, China
cNational Institute for Biotechnology and Genetic Engineering (NIBGE), P. O. Box. 577, Jhang Road, Faisalabad, Pakistan
First published on 16th October 2018
Abstract
In this study, a Zn3(VO4)2/BiVO4 heterojunction nanocomposite photocatalyst was prepared using a hydrothermal route with different molar concentration ratios. The as-synthesized nanophotocatalyst was characterized using XRD, SEM, EDS, XPS, FT-IR, Raman, BET, UV-vis DRS, EPR and PL. The effect of molar ratio on composition and morphology was studied. The as-prepared nanocomposite exhibited excellent photocatalytic response by completely degrading the model pollutant methylene blue (MB) dye in 60 min at molar concentration ratio of 2![[thin space (1/6-em)]](https://www.rsc.org/images/entities/char_2009.gif) :1. In basic medium at pH 12, the Zn3(VO4)2/BiVO4 nanocomposite degrades MB completely within 45 min. The nanocomposite was also successfully used for the electrochemical detection of an important analyte hydrogen peroxide (H2O2). This study opens up a new horizon for the potential applications of Zn3(VO4)2/BiVO4 nanocomposite in environmental wastewater remediation as well as biosensing sciences.
:1. In basic medium at pH 12, the Zn3(VO4)2/BiVO4 nanocomposite degrades MB completely within 45 min. The nanocomposite was also successfully used for the electrochemical detection of an important analyte hydrogen peroxide (H2O2). This study opens up a new horizon for the potential applications of Zn3(VO4)2/BiVO4 nanocomposite in environmental wastewater remediation as well as biosensing sciences.
Introduction
In recent years, heterojunction semiconductor photocatalysts have been widely used in many areas, particularly the elimination of toxic chemicals from wastewater1–3 and electroanalytical applications. Large disposal of dyes from different sectors into water sources creates a threat to the environment. These dyes are major causes of water pollution. Approximately 1 to 20% of the globally produced dye is lost during the dyeing process and expelled in wastewater.4–6 It is essential to mineralize this contaminated water so that it has no harmful effects on living organisms. Numerous studies have been conducted by researchers, including the use of filtration, electrochemical and precipitation methods, coagulation and adsorption, which are common methods for water remediation. Among these methods, heterogeneous photocatalysis is an advanced oxidation process (AOP) and is widely used to mineralize pollutant water without generating secondary harmful pollutants under light irradiation in the presence of a catalyst.7,8In heterojunctions, the recombination rate reduces and the separation rate of the photogenerated electron–holes speeds up. Hence, heterojunction composites are photocatalytically more active than the individual components. Numerous composites have been reported, such as NaBiO3/BiOCl,9 Bi2WO6/TiO2,10 TiO2/SnO2,11 Bi/Bi2O3,12 and BiVO4/Bi2O3.13 It has been agreed from the results of extensive investigations that coupling of two semiconductor photocatalysts would result in better photocatalytic activities.13–15
Fabricating heterojunction photocatalysts with different semiconducting materials comprises a frugal action to facilitate the separation of photoexcited electron–hole pairs and achieve better photocatalytic attributes. Several heterojunction photocatalysts have been fabricated by many processes such as sol–gel, co-precipitation,16 ball milling,17 and hydrothermal methods.1,18 From the literature study, we noted that the heterojunction photocatalysts such as InVO4/BiVO4, CuO/BiVO4, C3N4/BiVO4, BiVO4/Bi2S3, BiVO4/FeVO4 and CaFe2O4/Ag3VO4 display higher photocatalytic efficiency when compared with that of single semiconductors.19–23 When a wide bandgap semiconductor is mixed with a short bandgap semiconductor, charge separation is extended and excellent photocatalytic activity is attained.1,24
The energy band gaps of BiVO4 and Zn3(VO4)2 are generally 2.4 eV and 3.3 eV, respectively.25,26 In BiVO4, the conduction band edge is made of Bi 6p orbital and a definite part of V 3d orbital, while the valence band edge is composed of O 2p and V 3d orbital.27 In the case of Zn3(VO4)2, the conduction band edge is made of Zn 3d orbital and V 3d orbital. The valence band edge is composed of O 2p, Zn 3d and V 3d orbitals. Because the energy band gap of BiVO4 < Zn3(VO4)2, the electrons can easily transfer from BiVO4 to Zn3(VO4)2 and decrease the electron density of the valence band in BiVO4. Similarly, the introduction of BiVO4 decreases the electron density in the conduction band of Zn3(VO4)2, which causes conduction band electron transfer to the Zn3(VO4)2 surface and reduces recombination of charge pairs.
Thus, from the above literature survey, it is apparent that combination of BiVO4 and Zn3(VO4)2 would beneficially increase separation efficiency of electron–hole charges and improve the photocatalytic response of Zn3(VO4)2/BiVO4 heterojunction nanophotocatalyst. To the best of our knowledge, although many studies have been conducted on the BiVO4-based composite for photocatalytic use, we are reporting the first time the use of Zn3(VO4)2/BiVO4 heterojunction composite for the photocatalytic degradation of methylene blue dye as well as the electrochemical detection of hydrogen peroxide molecules. In this study, Zn3(VO4)2/BiVO4 heterojunction composite was prepared through a hydrothermal route. Physical and chemical properties of the as-prepared Zn3(VO4)2/BiVO4 photocatalyst were measured by XRD, XPS, SEM, EDS, FT-IR, Raman, BET, UV-vis DRS, EPR and fluorescence spectrum techniques. The photocatalytic activity of the Zn3(VO4)2/BiVO4 composite photocatalyst was investigated by performing the degradation of methylene blue (MB) dye under visible light. Electrochemical properties (via EIS and CV) of the Zn3(VO4)2/BiVO4 composite were also investigated for detecting hydrogen peroxide. This study uncovers the potential of Zn3(VO4)2/BiVO4 nanocomposite for applications in environmental science as well as in biosensor disciplines.
Experimental methods
All the materials were of analytical grade and used without any further purification. The heterojunction composite Zn3(VO4)2/BiVO4 was synthesized by hydrothermal method. Initially, 1 mmol each of Bi(NO3)3·5H2O and Zn(O2CCH3)2 were dissolved in 100 mL of distilled water. A yellowish coloured solution was obtained on addition of 2 mM NH4VO3, following which the solution was stirred for an hour. pH was adjusted to 10 using 1 M NaOH solution. The solution was transferred to a 100 mL Teflon-lined stainless-steel autoclave and subjected to hydrothermal treatment at 200 °C for 48 h. After completing the reaction, the autoclave was cooled naturally and the precipitate was collected and washed numerous times with ethanol and distilled water to remove the surface-bound impurities. Then, the product was dried at 80 °C overnight. To check the effect of different concentrations on the crystallinity, morphology, and photocatalytic and electrochemical sensing properties, Zn3(VO4)2/BiVO4 heterojunction was also prepared at different mole ratios without changing other parameters.Characterization of Zn3(VO4)2/BiVO4
X-ray diffraction (XRD) was executed on a Bruker D8 Advance diffractometer using monochromatic Cu Kα (l 1/4 0.15418 nm) radiation with a scanning speed of 2θ min−1. The structure, morphology and size of the particles were examined using a field emission scanning electron microscope (FESEM, Hitachi-S5500) equipped with an energy dispersive X-ray spectroscope (EDS). FT-IR spectra were recorded by an FT-IR spectrometer (Nicolet iS50) from 400 to 4000 cm−1. Raman analysis was preformed through LabRAM HR Evolution (HORIBA Scientific) using 532 nm laser as the excitation source at room temperature. Brunauer–Emmett–Teller (BET) surface area of the products was analyzed by recording an N2 adsorption–desorption isotherm curve at 77.55 K using a Micromeritics ASAP 2010 system. Before N2 adsorption measurements, the samples were degassed at 180 °C. A multipoint BET method was used to calculate the surface area. For photoluminescence (PL), the 325 nm line of a He-Cd laser was utilized as the excitation source at room temperature using a Hitachi luminescence spectrometer (F-4500). Electronic paramagnetic resonance (EPR) analysis was performed on an ESR-JES-FA 2010 spectrometer. UV-vis-NIR diffuse reflectance (DRS) measurements were executed on a UV/vis/NIR spectrometer (Perkin Elmer, Lambda-35).Photocatalytic activity
To test the photocatalytic responses of powdered Zn3(VO4)2/BiVO4, the samples were illuminated under a xenon lamp of accumulative intensity of 300 W to degrade MB under visible-light irradiation; the distance between the reactor and the lamp was 30 cm. For the kinetics study, the dye solutions with fixed concentrations (150 mL) were prepared and 100 mg of the as-synthesized Zn3(VO4)2/BiVO4 was mixed in each dye solution. The obtained solutions were stirred vigorously for 15 min in the dark and illuminated under visible light. Before starting the experiment, solutions were maintained at pH of about 8. The final solutions were centrifuged (10000 rpm for 5 min) and the nitrogen cooling system HX-DC1006 was employed throughout the experiment to avoid any thermal degradation and to maintain the temperature at 0 °C. Degradation of the dye solutions was analyzed using Perkin Elmer lambda 35 UV/vis spectrometer in the spectral range of 400–800 nm.
Sensor measurement
The electrochemical study was performed on a Chi-760D electrochemical workstation using a three-electrode scheme with a glassy carbon electrode (GCE) applied in this study for electrode modification. Initially, 0.5 mg of Zn3(VO4)2/BiVO4 was dispersed in 1 mL deionized water. Then, 10 μL of this dispersed nanomaterial was drop casted on GCE and dried in the oven at 60 °C for 2–3 min. Then, 2–3 μL of 5% Nafion was added on the coated GCE and dried. All the solutions for sensing element measurements were prepared in deionized water and the involved concentrations were attained by suitable dilution of separate stock solutions. Zn3(VO4)2/BiVO4-modified glassy electrode was employed as the working electrode, a glassy carbon rod was used as the counter electrode and Ag/AgCl electrode was used as the reference electrode. Prior to each electrochemical measurement, the electrolyte solution was degassed with nitrogen gas for 3 min. Electrochemical impedance spectroscopy (EIS) was performed at an amplitude of 0.01 V in the frequency range of 0.1 Hz to 4000 Hz. Cyclic voltammetry (CV) curves were measured in the potential range of −1.0 V to +1.0 V at a potential scan rate of 0.05 V s−1 (except for the effect of scan rate) in a mixed solution of 0.1 M electrolyte and H2O2 at different concentrations. All measurements were performed at ambient temperature.Result and discussion
Fig. 1 shows the XRD diffraction patterns for the phase structures of the as-synthesized Zn3(VO4)2/BiVO4 at various concentration ratios. All the XRD diffraction peaks of Zn3(VO4)2/BiVO4 belong to pure Zn3(VO4)2 (JCPD card 19-1468) and BiVO4 (JCPD card 75-1867). Hence, the pattern of Zn3(VO4)2/BiVO4 heterojunction photocatalyst compound exhibited characteristic diffraction peaks from both BiVO4 and Zn3(VO4)2 crystalline phases, verifying that Zn3(VO4)2/BiVO4 composite was synthesized with success by a facile hydrothermal route at varied mole ratios. It can be seen that as the BiVO4 ratio increases, the Zn3(VO4)2 peaks diminish due to broadening of the BiVO4 peaks.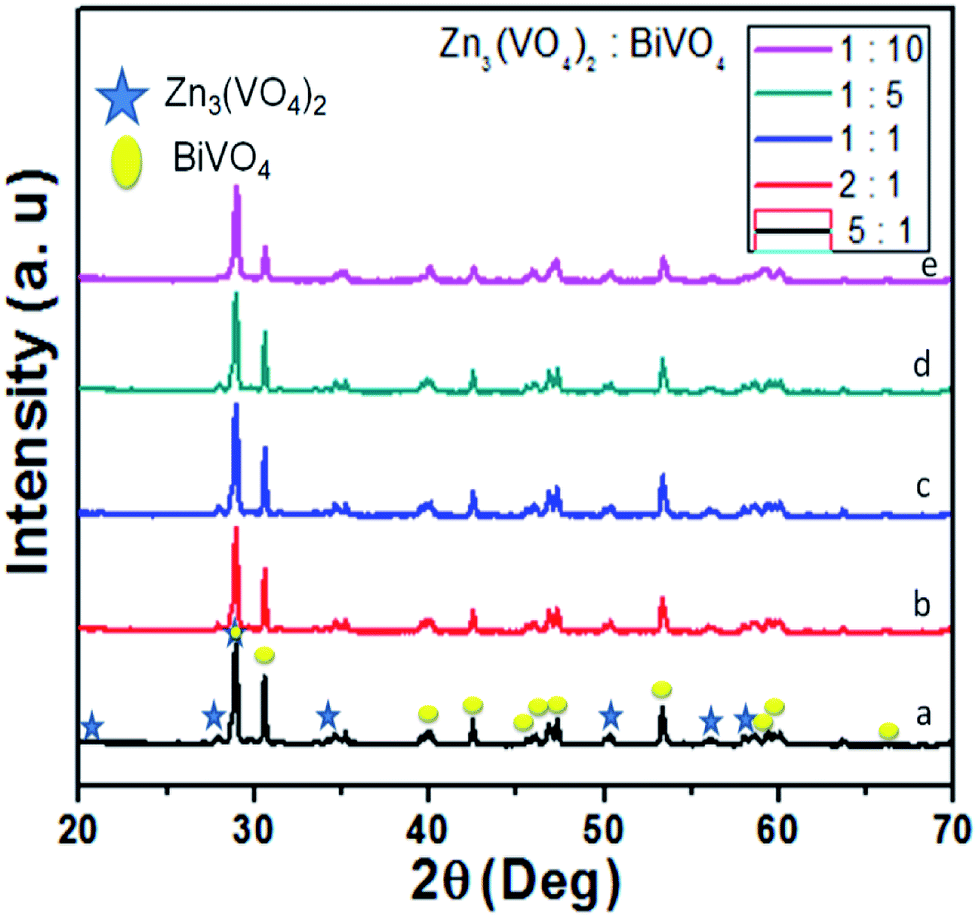 | ||
| Fig. 1 XRD spectra of Zn3(VO4)2/BiVO4 heterojunction composites at different mole ratios: (a) 5:1, (b) 2:1, (c) 1:1, (d) 1:5, and (e) 1:10. | ||
The morphology of the as-synthesized Zn3(VO4)2/BiVO4 heterojunction was characterized by FESEM. Zn3(VO4)2/BiVO4 nanoparticles and nanorods with high yield are observed, as shown in Fig. 2(a–e). It was noticed that as the ratio of BiVO4 increased, particle size also increased, which may be due to aggregation/agglomeration of the particles, as can be seen in Fig. 2(e). For determining the chemical composition, energy dispersive spectroscopy analysis was performed. It can be seen that the main elements within the samples are vanadium, zinc, bismuth, and oxygen at different mole ratios, while the carbon and platinum peaks evolve due to carbon tape and Pt coating.
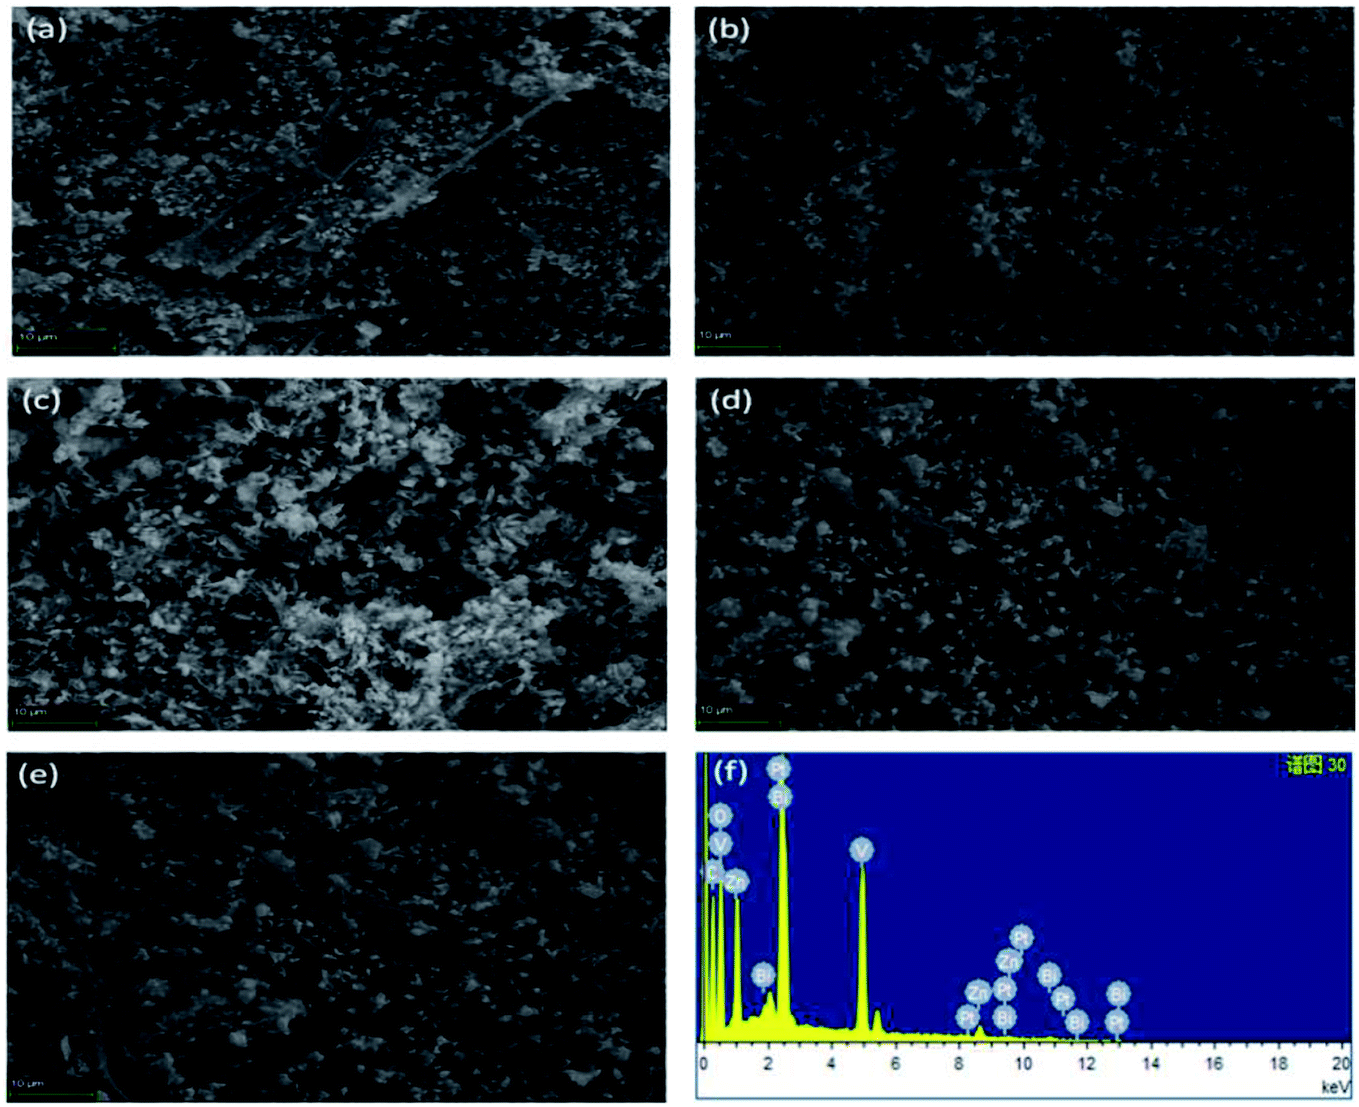 | ||
| Fig. 2 SEM images of Zn3(VO4)2/BiVO4 composite heterojunction photocatalyst at different mole ratios: (a) 5:1, (b) 2:1, (c) 1:1, (d) 1:5, and (e) 1:10 and (f) EDS analysis of Zn3(VO4)2/BiVO4 composite at mole ratio 1:1. | ||
For obtaining further information on the chemical composition, surface and elemental analysis, X-ray photon spectroscopy (XPS) was used. XPS is a versatile elemental analysis technique for assaying the composition and chemical states of elements.28 Fig. 3(a) depicts the typical X-ray photoelectron spectrum of Zn3(VO4)2/BiVO4, which is composed of O, V, Bi, and Zn. XPS analysis of the Zn3(VO4)2/BiVO4 nanocomposite shows two O 1s peaks located at 531.4 and 535.5 eV (Fig. 3(b)), indicating two different forms of O in the sample, which can be assigned to oxygen vacancies related to –OH group and molecular water adsorbed on the surface, respectively. The doublet peaks of V 2p3/2 and V 2p1/2 were detected at 517.13 and 524.64 eV, respectively (Fig. 3(c)). Fig. 3(d) shows the XPS peaks at 159.18 and 164.18 eV, belonging to Bi 4f7/2 and Bi 4f5/2. In Fig. 3(e), the Zn 2p spectrum presents two main peaks for 2p1/2 and 2p3/2 at 1021.4 and 1044.60 eV, respectively. The XPS analyses of the composites with ratios of 5:1 and 1:10 are given in Fig. S1 (ESI).† The XPS results revealed the suggested formation of Zn3(VO4)2/BiVO4, which confirms the previous XRD results.
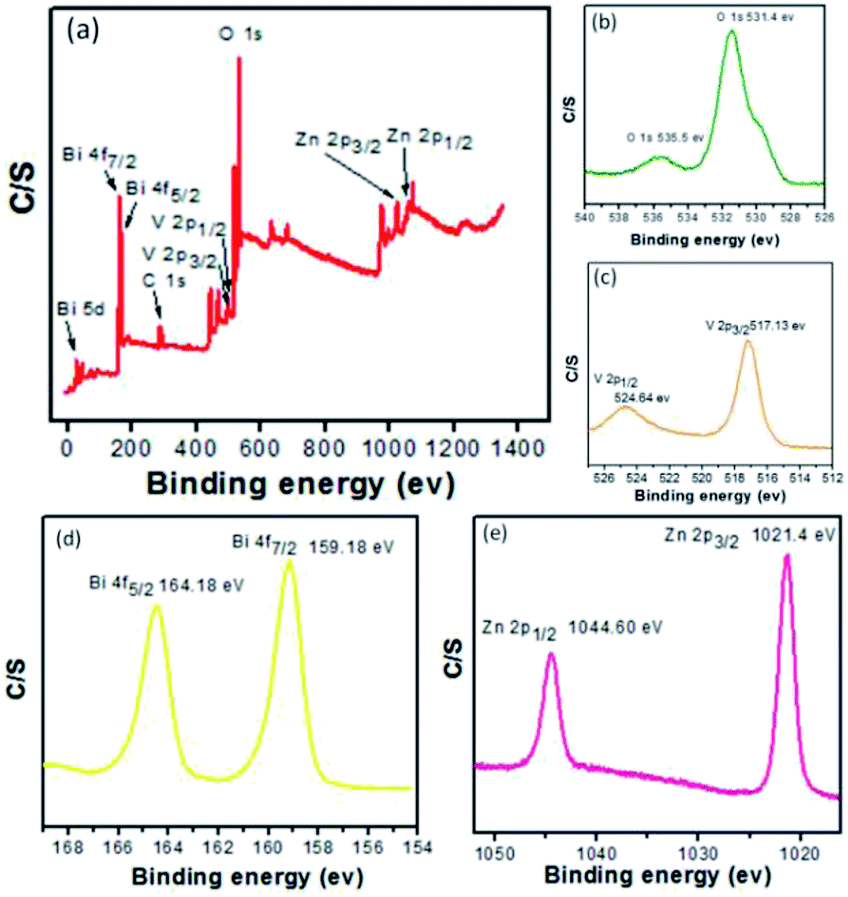 | ||
| Fig. 3 XPS spectra of as-prepared Zn3(VO4)2/BiVO4 samples at mole ratio 2:1. (a) Total survey, (b) O 1s, (c) V 2p, (d) Bi 4f, and (e) Zn 2p. | ||
Fourier-transform infrared (FT-IR) spectrum of the Zn3(VO4)2/BiVO4 composite at mole ratio of 2:1 shows a strong absorption in the range of 400–950 cm−1. The absorption bands at 473, 728 and 741 cm−1 belong to BiVO4. The bands at 446, 901, and 931 cm−1 correspond to Zn3(VO4)2. A weak absorption band at 473 cm−1 was assigned to symmetric bending of VO43−, while a broad and strong absorption band at 741 cm−1 was assigned to the asymmetric stretching of VO43−. The peak at 446 cm−1 indicates stretching vibration mode of the Zn–O band. The vibration bands at 901 and 931 cm−1 are attributed to VO4 vibration mode in the network. The absorption band at 728 cm−1 indicates the stretching vibration of the Bi–V band.29–32 Fig. 4(b) shows the Raman spectrum of Zn3(VO4)2/BiVO4 at 2:1 ratio. The Raman spectrum reflects bands at around 116, 199, 210, 334, 692, and 815 cm−1 for all samples. The peaks at 116 and 199.6 cm−1 arise from Zn–O vibration, the peaks at 210, 334, and 692 cm−1 arise from Bi–V vibration, and the peak at 815 cm−1 is attributed to V–O vibration.31,33,34 Raman spectrum of the product is in good agreement with the crystal structure of Zn3(VO4)2/BiVO4.
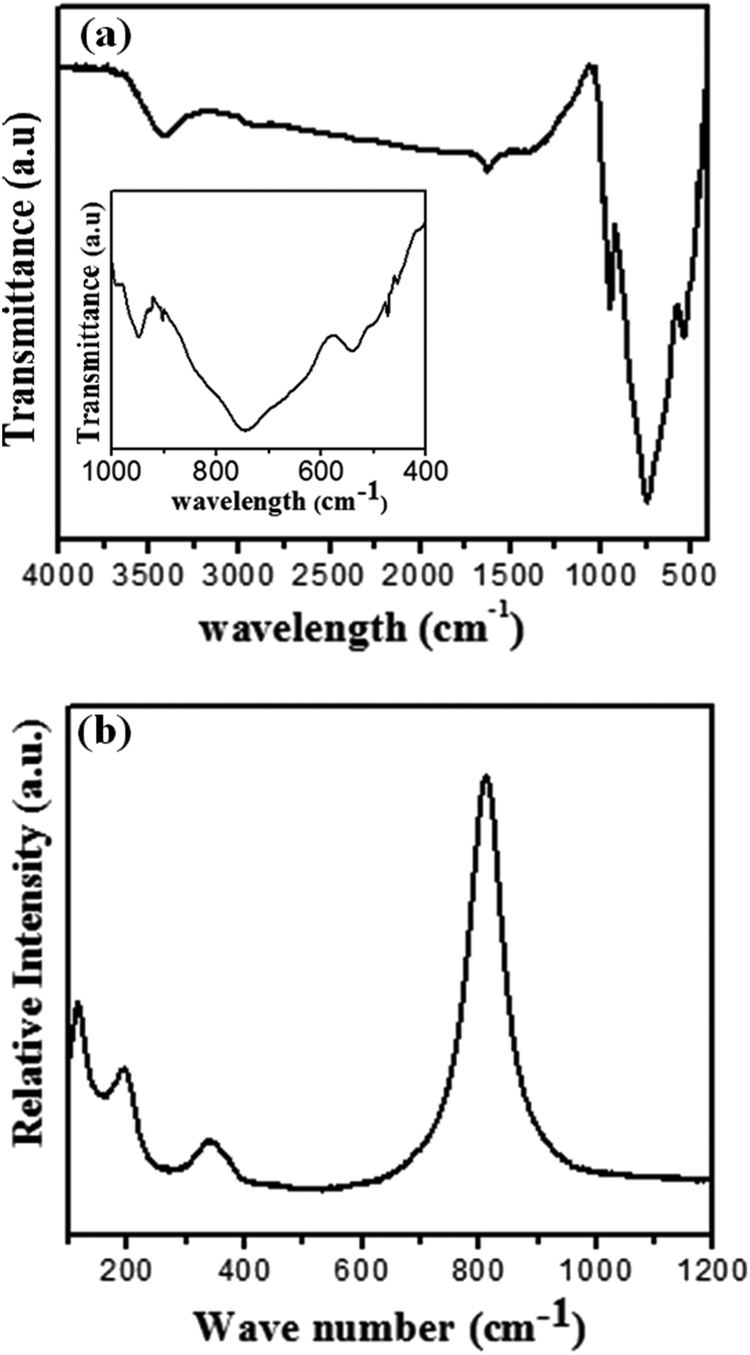 | ||
| Fig. 4 (a) FT-IR spectrum of Zn3(VO4)2/BiVO4, (inset) high-resolution spectrum from 400 to 1000 cm−1; (b) Raman spectrum of as-prepared Zn3(VO4)2/BiVO4 at mole ratio 2:1. | ||
Fig. 5(a) shows the N2 adsorption–desorption isotherm of Zn3(VO4)2/BiVO4 at 2:1 mole ratio. The Brunauer–Emmett–Teller (BET) surface area of 40.46 cm2 g−1, pore volume of 0.122 cm3 g−1 and pore diameter of 1.685 nm were calculated from experimental data. The large surface area and volume correspond to highly reactive sites, resulting in enhanced photocatalytic activity of the material.35 N2 adsorption isotherms at different ratios of Zn3(VO4)2/BiVO4 were obtained and analyzed, corresponding to the H3 hysteresis loop, which indicated aggregation of the sample particles to form self-assembled nanoparticles, as shown in Fig. S2 (ESI).† The shapes of all the Zn3(VO4)2/BiVO4 sample isotherms resembled type H3 loops, indicating aggregation of sample particles to form self-assembled plate-like and rod-like particles.
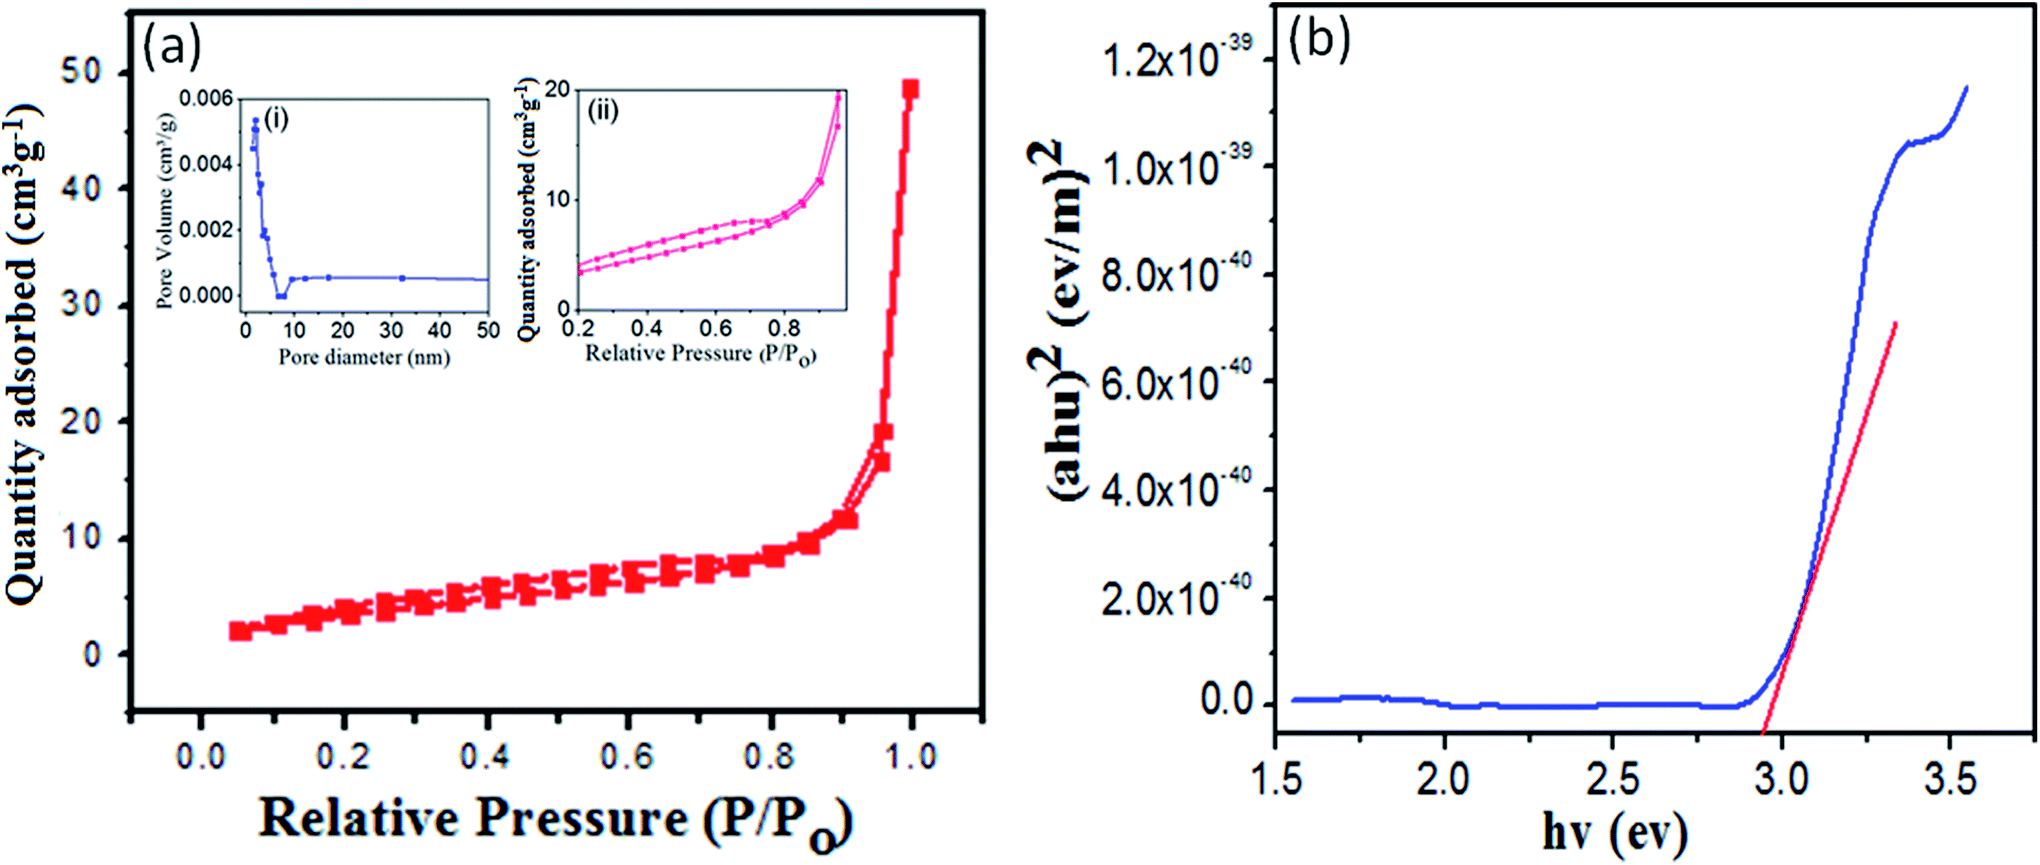 | ||
| Fig. 5 (a) N2 adsorption–desorption isotherm distribution curves for Zn3(VO4)2/BiVO4 at 2:1 mole ratio, insets (i) differential pore size distribution curve from Barrett–Joyner–Halenda (BJH) method and (ii) high resolution N2 adsorption–desorption isotherm at 2:1 mole ratio; (b) Tauc plot for Zn3(VO4)2/BiVO4 composite at 2:1 mole ratio. | ||
Energy band gap is an important parameter of semiconductor materials. The UV-visible spectrum of the Zn3(VO4)2/BiVO4 nanophotocatalyst was recorded and the band gap, as depicted in Fig. 5(b), was calculated by the Tauc relation (1):
| (αhν) = A(hν − Eg)n | (1) |
Fig. S3 (ESI†) shows the changes in the visible (UV-vis) spectra during the photodegradation process of MB dye in aqueous Zn3(VO4)2/BiVO4 solution under visible light irradiation. The chemical structure of MB is shown in Fig. S4 (ESI†) and details about concentration are given in ESI.† It was noted that at the ratio of 2:1 of Zn3(VO4)2/BiVO4 heterogeneous photocatalyst, nearly the entire dye degraded in 90 min.
Concentration changes versus irradiation time and the degradation efficiency graph are shown in Fig. 6. When visible light illuminates the solution, the active species, namely, hydroxyl radicals, holes, −O2 and ·O2 are generated during the photocatalytic degradation reaction. The formation of OH˙ radicals is much lower than O2˙ formation. However, the hydroxyl radical is a highly active and non-selective oxidant agent species for degradation, which leads to mineralization of organic chemicals.36–41
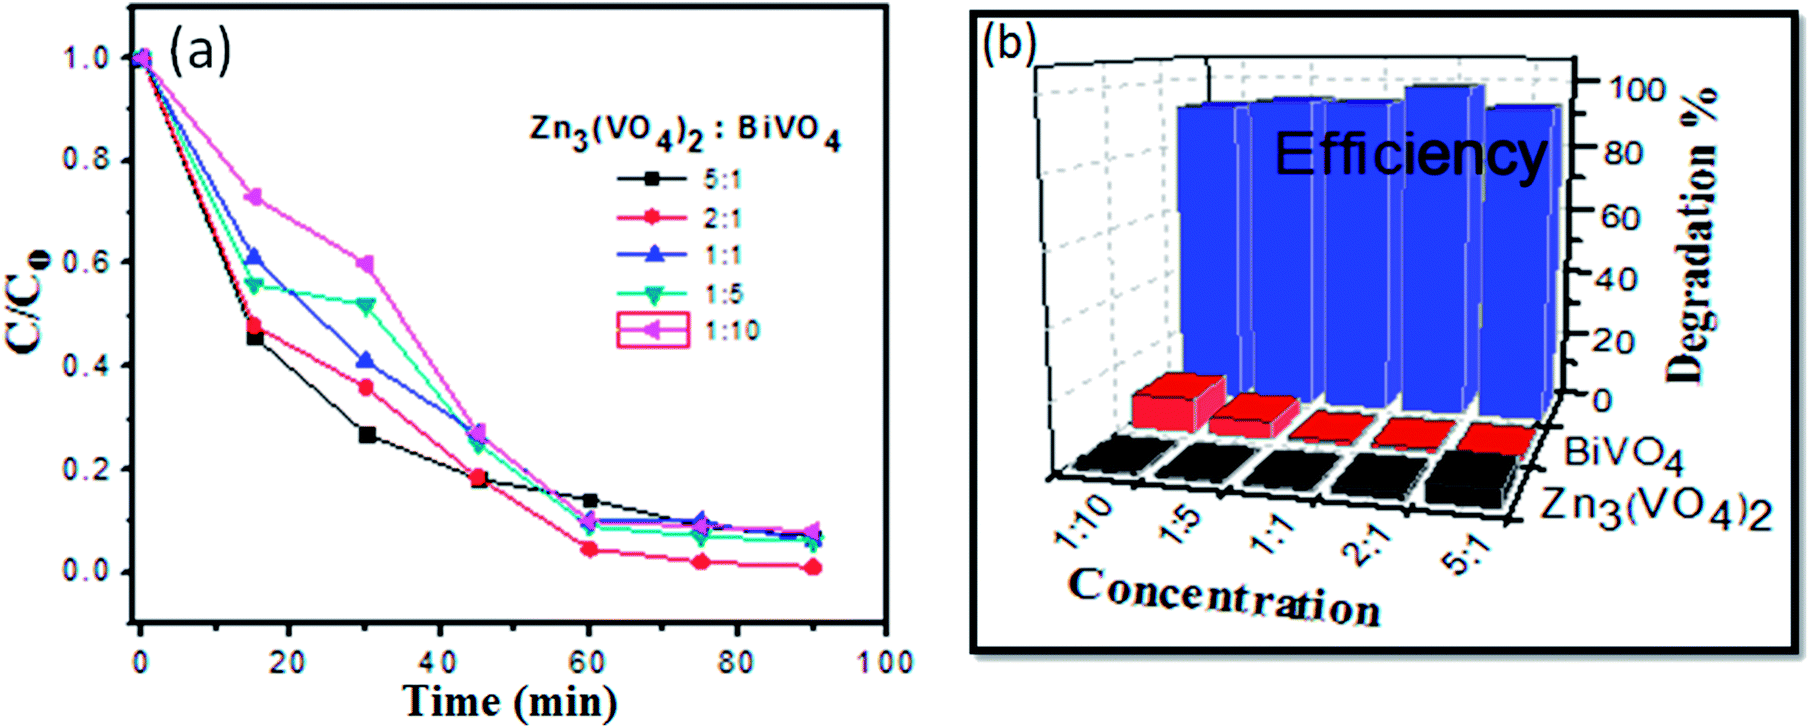 | ||
| Fig. 6 (a) Concentration changes (C/Co) of MB dye as function of irradiation time in presence of photocatalyst at same quantity but different mole ratios; (b) bar graph of efficiency at different mole ratios. | ||
Degradation efficiency was determined by the following equation:
| Degradation efficiency (%) = (Co − Ct)/Co | (2) |
The mechanism of photocatalytic MB dye solution degradation by the Zn3(VO4)2/BiVO4 nanophotocatalyst in visible light can be presented through the following equations:
| Zn3(VO4)2/BiVO4 + hν → e− + h+ + Zn3(VO4)2/BiVO4 | (3) |
Oxidation occurs at BiVO4 surfaces:
| h+ + H2O → ·OH + H+ | (4) |
| 2h+ + 2H2O → 2H+ + H2O2 | (5) |
Reduction reaction occurs at Zn3(VO4)2:
| e− + O2 → ·O2− | (6) |
When visible light interacts with the methylene blue dye and Zn3(VO4)2/BiVO4 photocatalyst solution, the electron moves from BiVO4 to Zn3(VO4)2, while the hole of Zn3(VO4)2 moves to the valence band (VB) of BiVO4. Then, oxidation reaction occurs at VB of Zn3(VO4)2/BiVO4, where positive holes react with water and form the hydroxyl radical (·OH) radical. Reduction occurs at conduction band (CB) of BiVO4, where negative electron (e−) produces superoxide radical (·O2) by reacting with dissolved oxygen. Pseudo-first order equation specified below was applied to extract the reaction kinetics of the organic dye:
| ln(C/Co) = −kt | (7) |
:1, 2:1, 1:1, 1:5, and 1:10, respectively. It was observed that dye solution with 2:1 ratio of Zn3(VO4)2/BiVO4 exhibited the highest photodegradation efficiency, as shown in Fig. 6.
Effect of pH was also examined at different values (2, 5, 7, 10 and 12), as illustrated in Fig. S5 (ESI).† We observed that at pH 12, the MB aqueous solution was totally degraded in 45 min due to the excess amount of OH˙ radicals. Hydroxyl radical is a strong oxidant agent. Thus, degradation via O2˙ along with OH˙ resulted in nearly total (99.6%) degradation MB within 45 min. During the photocatalytic degradation process, a new absorption band and peak shift were observed, which could be due to decomposition of the benzene ring in the dye. Concentration changes versus irradiation time and degradation efficiency at various pH values are shown in Fig. 7 (Tables 1 and 2).
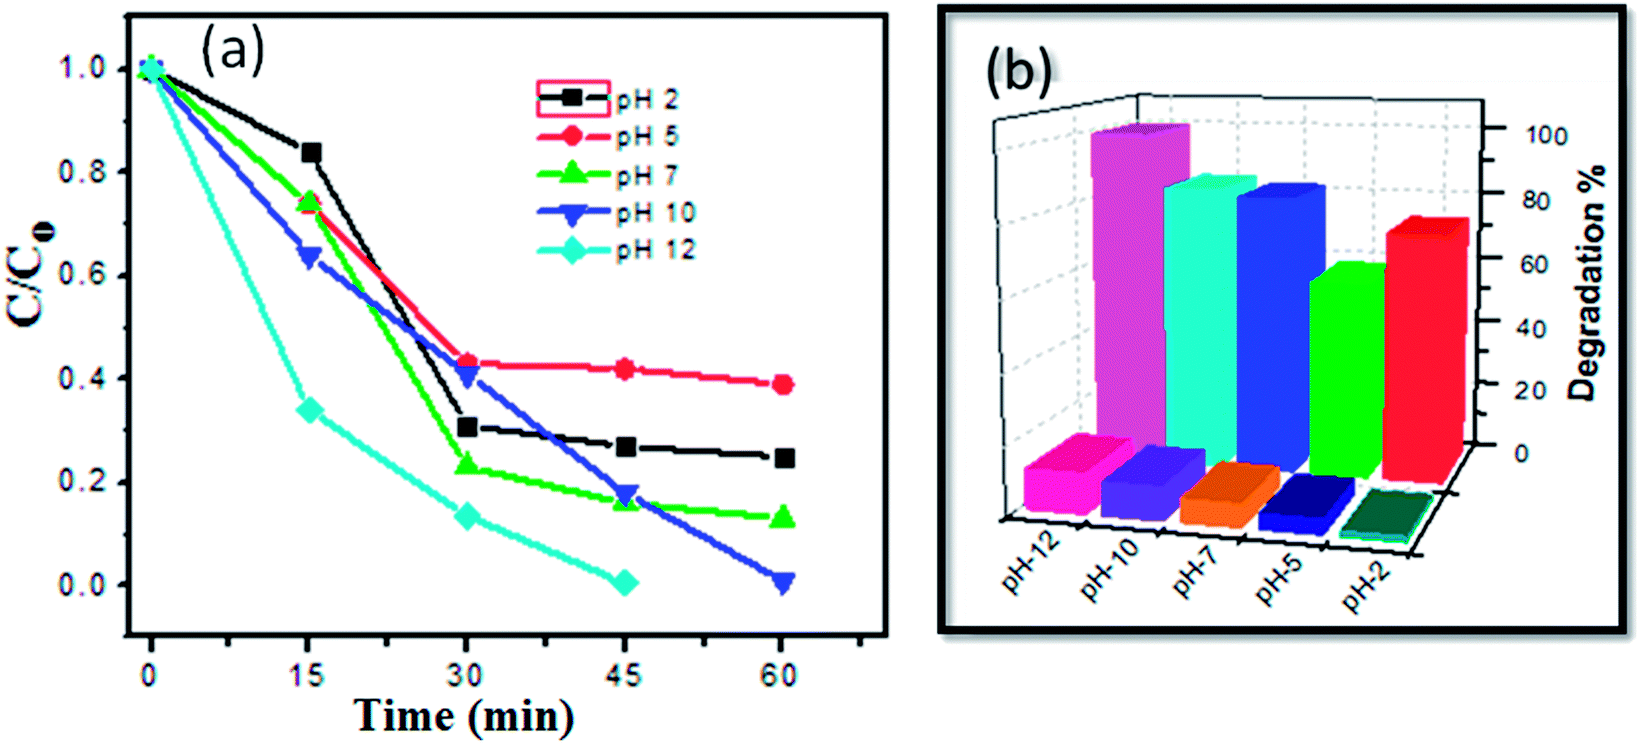 | ||
| Fig. 7 (a) Concentration changes (C/Co) of MB dye as function of irradiation time in presence of photocatalyst at different pH; (b) bar graph of efficiency of Zn3(VO4)2/BiVO4 nanophotocatalyst at different pH values. | ||
| pH | Degradation efficiency% |
|---|---|
| 2 | 73 |
| 5 | 58 |
| 7 | 82 |
| 10 | 84 |
| 12 | 99.6 |
| Catalyst | Efficiency% | Light source | Time (min) | Reference |
|---|---|---|---|---|
| ZnS | 88 | Visible light | 90 | 46 |
| V2O3/CNT/TiO2 | 70 | Visible light | 120 | 47 |
| BiVO4/TiO2 | 86 | Visible light | 120 | 48 |
| CuO–BiVO4 | 92 | Visible light | 300 | 49 |
| P-25, Degussa | 89 | Visible light | 120 | 50 |
| Zn3(VO4)2/BiVO4 | 98.91 | Visible light | 90 | Present work |
| Zn3(VO4)2/BiVO4 at pH 12 | 99.6 | Visible light | 45 | Present work |
The superoxide radical and hydroxide radical oxidize the toxic C16H18ClN3S dye molecule and decompose it into harmless or non-toxic molecules, namely, CO2, H2O, NO2 and benzene byproducts, as indicated below (Fig. 8).
| C16H18ClN3S + (OH˙, ·O2−) → H2O + CO2 + NO2 + SO2 + C6H6 | (8) |
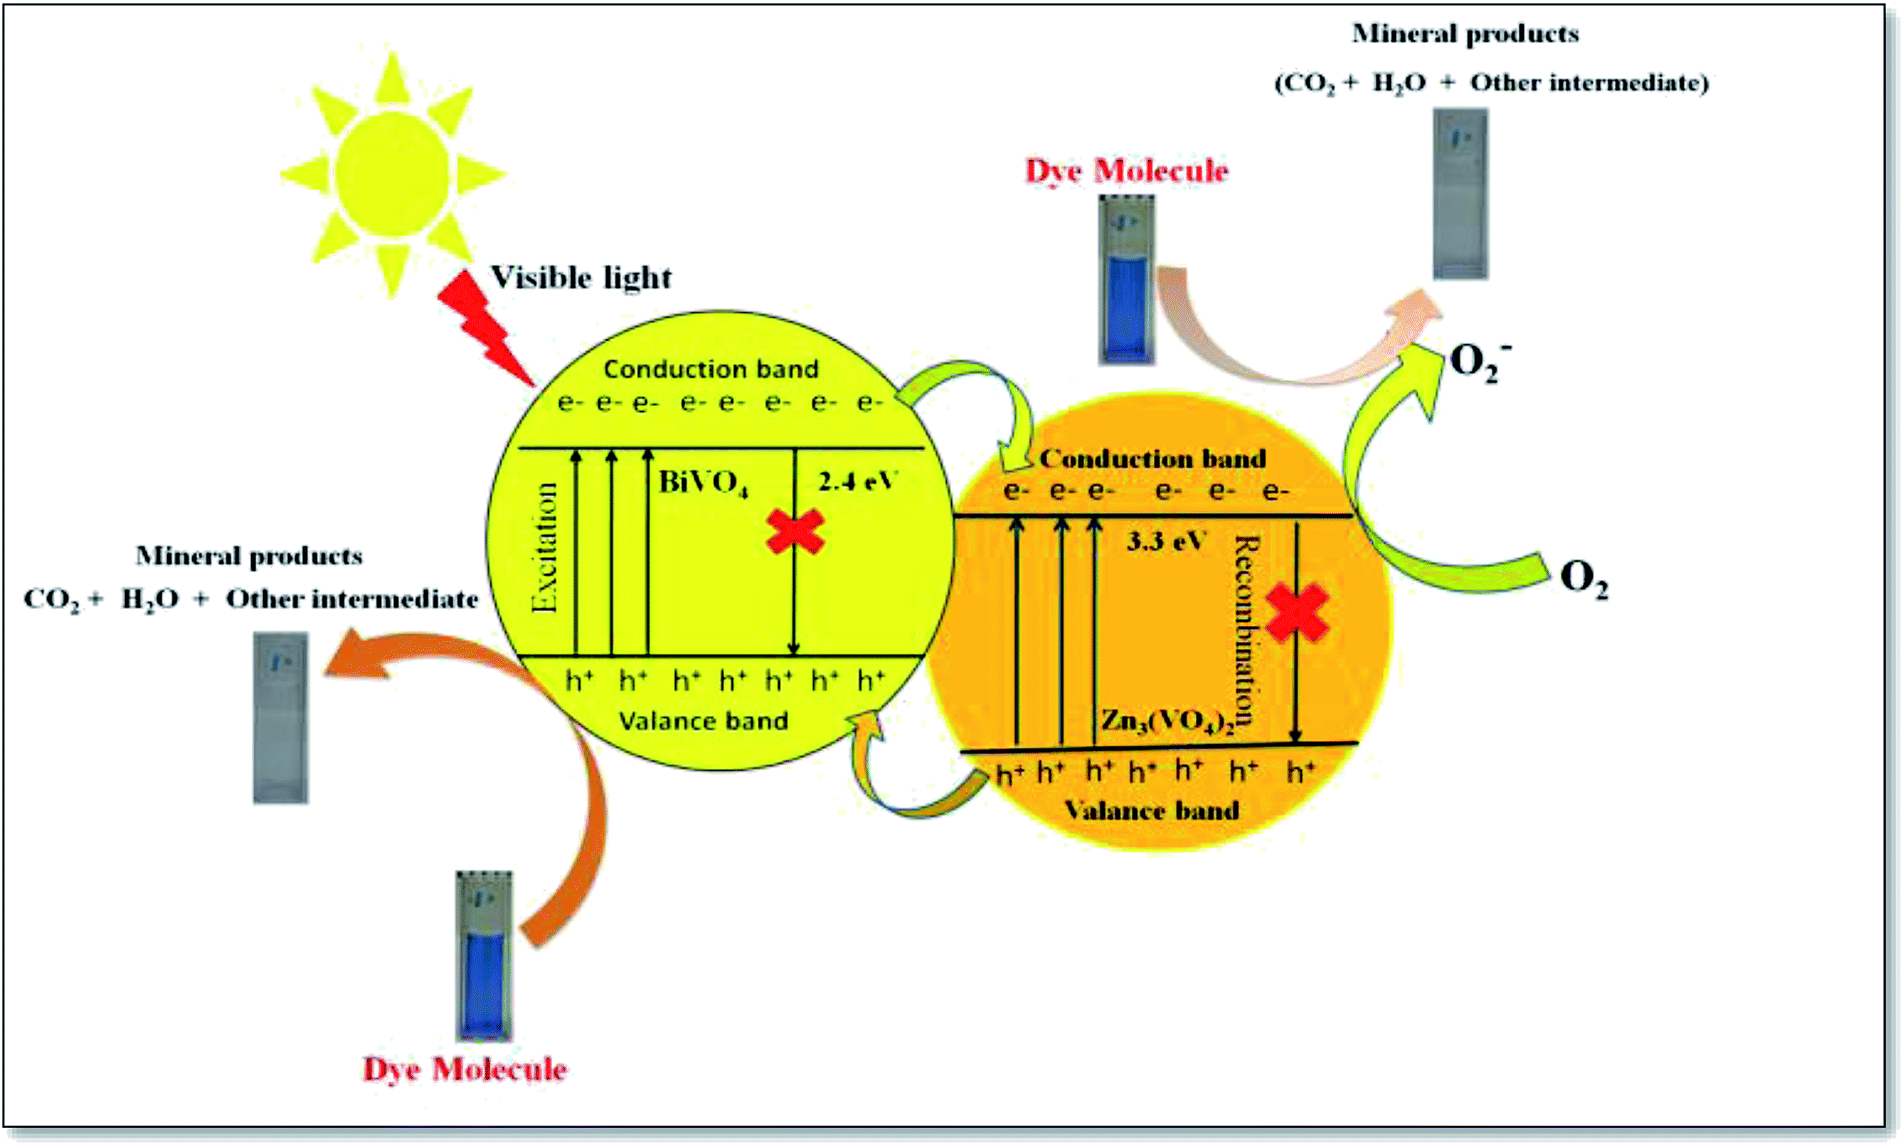 | ||
| Fig. 8 Reaction mechanism of methylene blue photodegradation over Zn3(VO4)2/BiVO4 nanocomposite under visible light. | ||
The photoluminescence (PL) spectrum exposes the recombination rate and charge (electron, hole) separation within the semiconductor nanophotocatalyst. Higher PL intensity indicates that there is a higher rate of recombination, which causes lower degradation efficiency.42,43 In the PL spectra, the lower intensity indicates the reduced and controlled recombination, which results in the effective electron–hole transfer over the photocatalyst surface and allows superior degradation of contaminants, thus increasing photocatalyst efficiency.44,45 Moreover, the reusability of Zn3(VO4)2/BiVO4 nanophotocatalyst at the ratio of 2:1 was checked, as shown in Fig. 9(b). The photolytic activity test was repeated three times and the sample showed good stability.
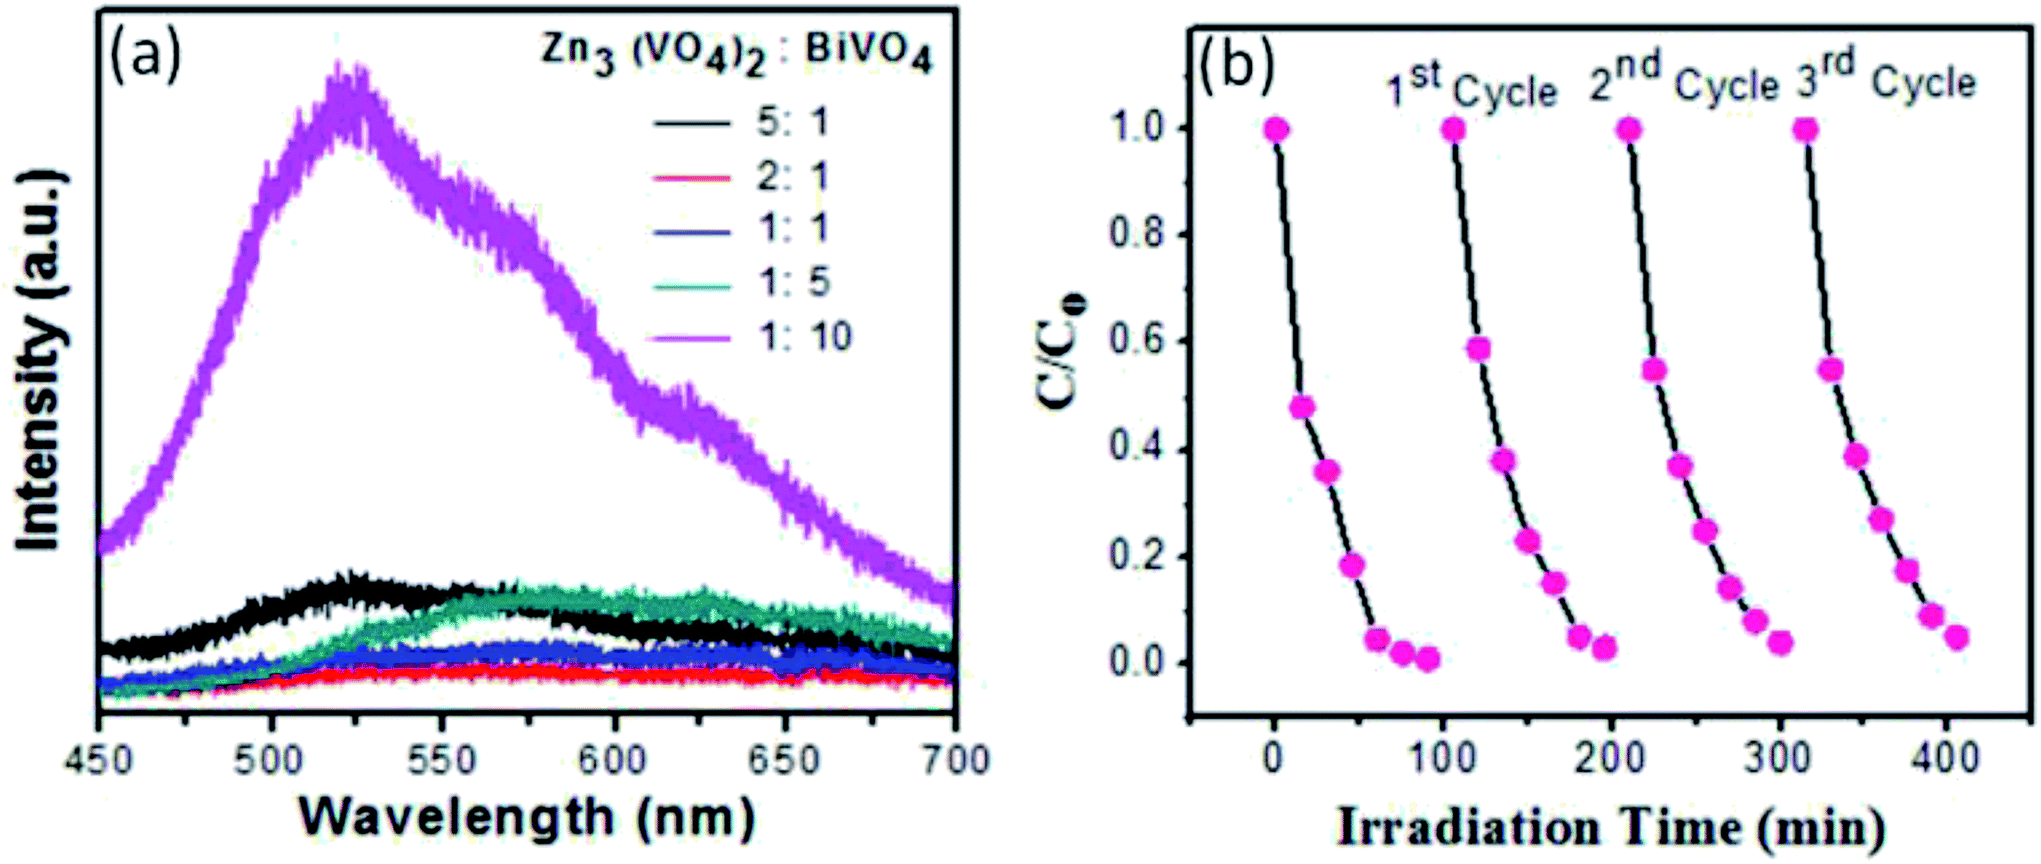 | ||
| Fig. 9 (a) PL spectra of Zn3(VO4)2/BiVO4 composite at different concentrations; (b) stability of Zn3(VO4)2/BiVO4 for degradation of methyl blue dye under visible light. | ||
On the basis of the earlier mentioned literature study, when the electron entered the conduction band of Zn3(VO4)2, it generates oxygen from the compound, which made bases for decomposition of MB dye. Hydroxyl radicals were also produced by the reaction of ·O2 radicals with H+ ions and h+ holes with H2O. It was noticed that no electron paramagnetic resonance (EPR) signal was found when the reaction was performed in the dark, whereas the signals with intensities corresponding to the characteristic peaks of DMPO–OH˙ adducts were observed during the reaction process in the EPR experiment. However, no peaks of DMPO–·O2 were observed. As shown in Fig. 10, the four characteristic peaks of DMPO–OH˙ radical (1:2:2:1 quartet pattern) were observed by irradiation of the Zn3(VO4)2/BiVO4 heterojunction nanocomposite solution under visible light. Decay of MB dye by the generated oxidant species can be described by the following equation.
| MB + OH˙ → decomposed compounds | (9) |
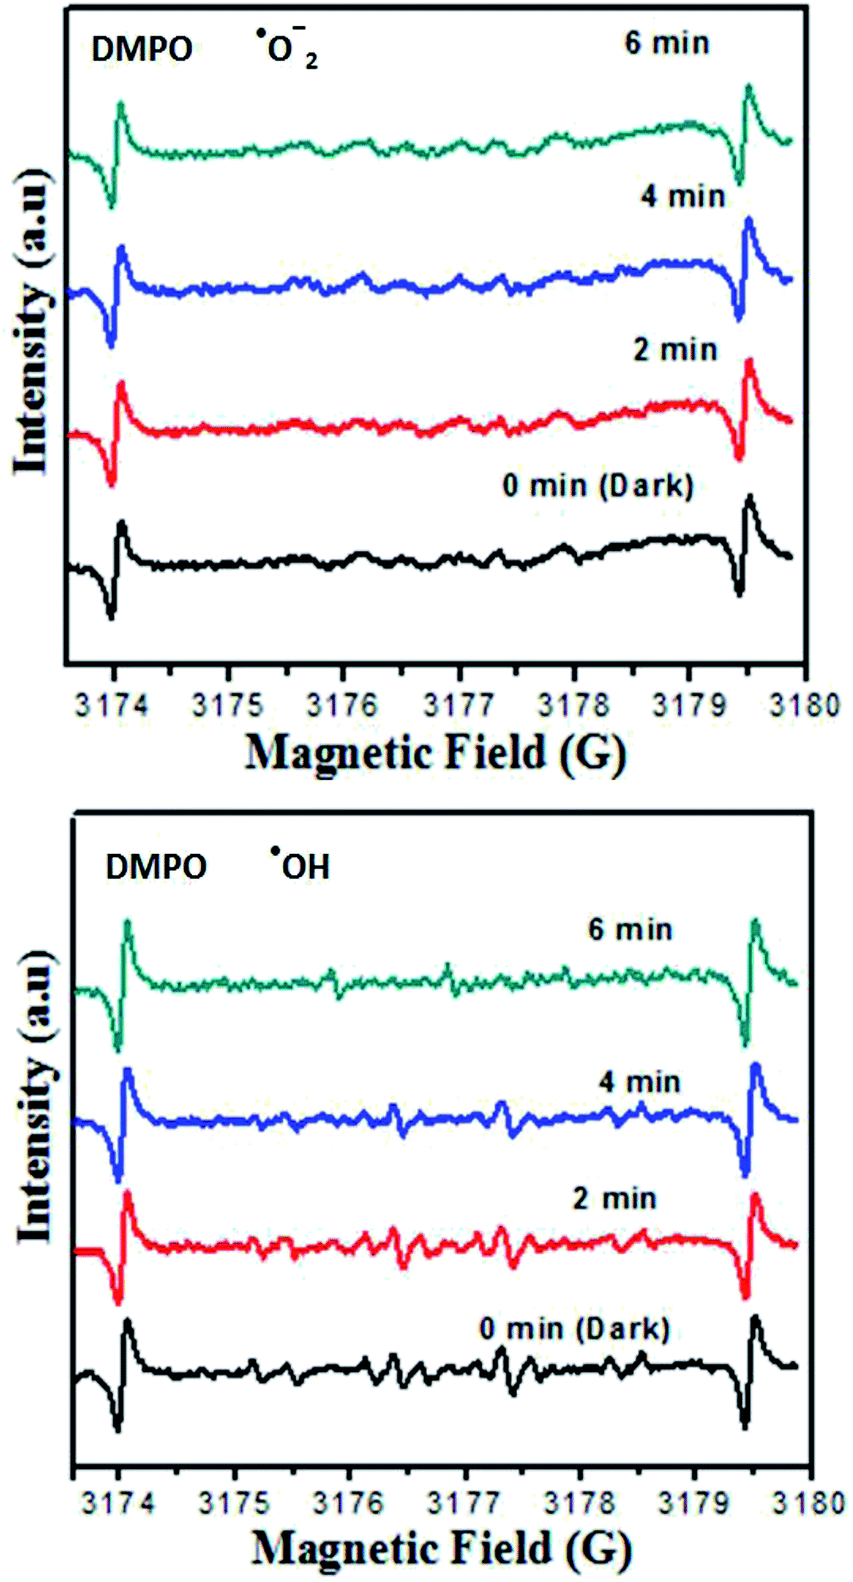 | ||
| Fig. 10 DMPO spin trapping EPR spectra for DMPO–·O2− and DMPO–·OH− under visible light irradiation with Zn3(VO4)2/BiVO4 photocatalyst. | ||
Electrochemical impedance spectroscopy (EIS) Nyquist plot analysis represents a flexible tool for conductivity analysis, surface psychoanalysis, and electron transfer analysis.51 As shown in Fig. 11, it is clear that the impedance spectrum is either semicircular or nearly circular at higher ac frequency and a line at low modulation ac frequency. The Nyquist circle diameter of Zn3(VO4)2/BiVO4 is much lower than that of bare glassy carbon electrode, indicating that electron transfer in the Zn3(VO4)2/BiVO4 composite is much sharper than that in the bare GCE and resulting in decreasing resistance.
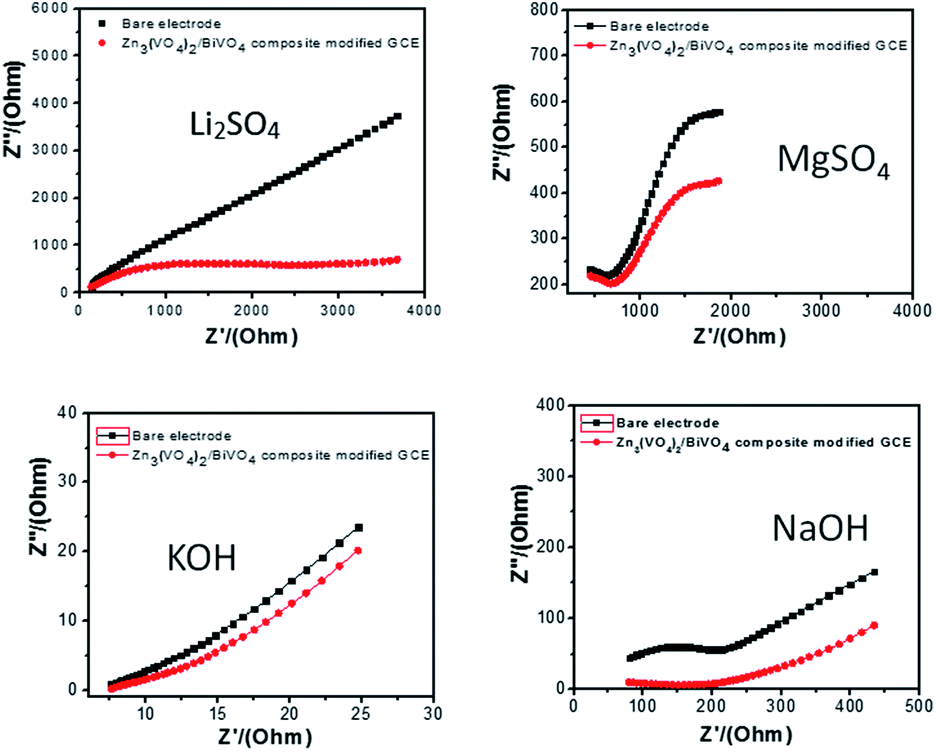 | ||
| Fig. 11 Electrochemical impedance spectroscopy of bare and modified Zn3(VO4)2/BiVO4 nanocomposite GCE in different electrolytes: (a) 0.1 M Li2SO4, (b) 0.1 M MgSO4, (c) 0.1 M KOH and (d) 0.1 M NaOH. | ||
Hydrogen peroxide (H2O2) is a pale-blue liquid and is among the most important analytes. H2O2 is used in several areas for food processes, environmental analysis, fabric manufacture, pharmaceuticals, medical diagnostics, clinical laboratories, antiseptic and disinfecting agents, powerful oxidizing agents and is also involved in several biological events as a by-product of oxidases. Higher concentrations of H2O2 (>50 μM) can cause stomach irritation and tissue burns. However, low levels of H2O2 affect the physiology of human fibroblasts. Hence, the development of an accurate, sensitive, highly reliable as well as low cost sensitizer for hydrogen peroxide (H2O2) is desirable. In this scenario, electrochemical sensors with fast response, superior selectivity, high sensitivity, ease of operation and low cost are the optimal option for actualizing the accurate detection of hydrogen peroxide.52–54 Cyclic voltammetry was employed for the measurement and detection of hydrogen peroxide analyte for Zn3(VO4)2/BiVO4 nanocomposite material. Cyclic voltammetry showed the response of bare electrode and glassy carbon modified electrode in both presence and absence of 0.5 mM hydrogen peroxide at a scan rate of −1 to 1 V s−1, as shown in Fig. 12(a).
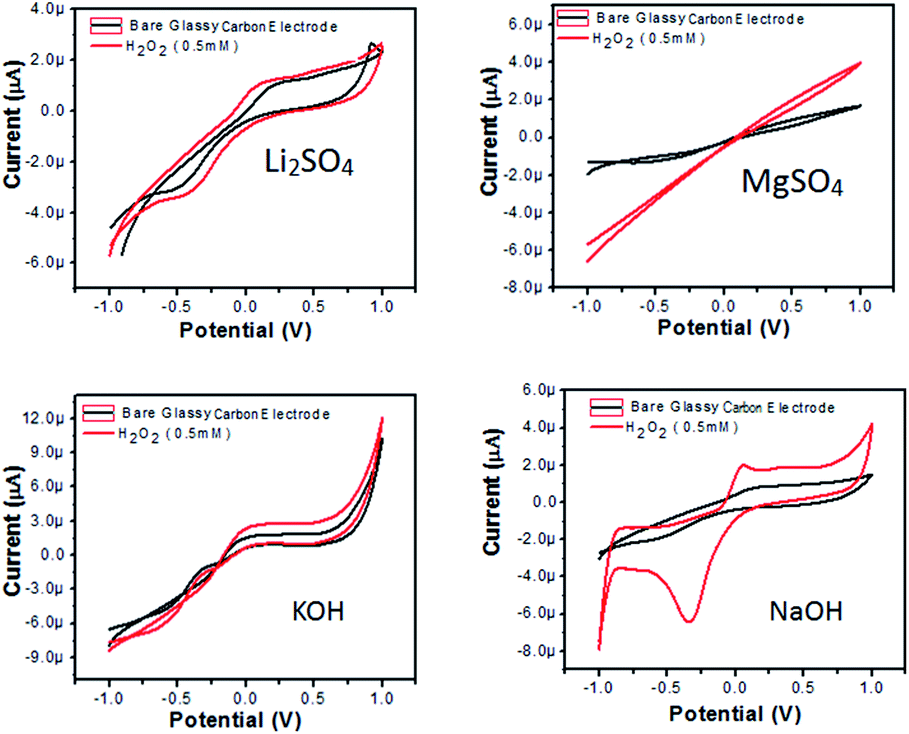 | ||
| Fig. 12 CVs of Zn3(VO4)2/BiVO4 modified GCE in (a) 0.1 M Li2SO4, (b) 0.1 M MgSO4, (c) 0.1 M KOH and (d) 0.1 M NaOH solution in absence and presence of 0.5 mM H2O2 at scan rate 50 mV s−1. | ||
In Li2SO4 solution (Fig. 12(a)), bare GCE gives one oxidation and one reduction peak located at 0.18 V and −0.43 V, respectively, while the modified Zn3(VO4)2/BiVO4 glassy carbon electrode exhibits enhanced current and a CV voltammogram with one oxidation and one reduction peak located at 0.07 V and −0.37 V, respectively. In MgSO4, the bare electrode and modified glassy carbon electrode solution did not show any oxidation peak in either absence or presence of H2O2. However, enhanced current was observed, which shows that semiconductor material has the potential to change the current intensity (Fig. 12(b)). In KOH solution (Fig. 12(c)), again no oxidation or reduction peak was observed for either bare GCE or modified Zn3(VO4)2/BiVO4 nanocomposite GCE. However, there was enhanced current intensity in the case of the modified nanocomposite GCE, indicating the potential for changing the current. In NaOH solution (Fig. 12(d)), the bare electrode shows one oxidation and reduction peak at 0.15 and −0.5 V, respectively, while the modified Zn3(VO4)2/BiVO4 nanocomposite GCE shows enhanced current intensity as well as one oxidation and reduction peak at 0.049 and −0.34 V, respectively. From the above-detailed CV spectra, the possibility of using Zn3(VO4)2/BiVO4 as sensor was evidenced.
For long-term stability confirmation, we stored the modified Zn3(VO4)2/BiVO4 composite GCE for three weeks at ambient temperature and then used it for sensing H2O2. We found that the modified Zn3(VO4)2/BiVO4 could detect H2O2 although there was a decrease in current from the first-day values, but its retention of reproducibility after twenty measurements shows a minor relative standard deviation from the original value, as shown in Fig. 13. Hence, the modified Zn3(VO4)2/BiVO4 composite GCE shows stability and reproducibility for H2O2 electrochemical determination.
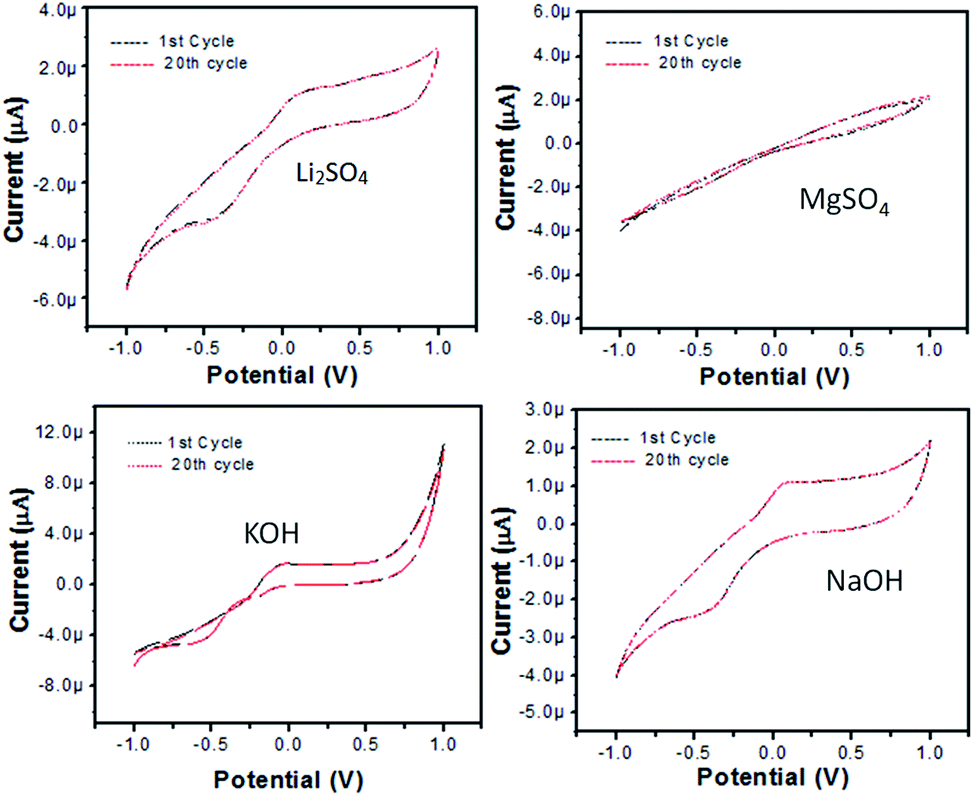 | ||
| Fig. 13 CVs of Zn3(VO4)2/BiVO4 modified GCE in mixed (a) 0.1 M Li2SO4, (b) 0.1 M MgSO4, (c) 0.1 M KOH, (d) 0.1 M NaOH and hydrogen peroxide (0.5 mM) solution at scan rate 50 mV s−1, cycling for 1st and 20th time. | ||
Conclusions
A Zn3(VO4)2/BiVO4 heterogeneous nano-photocatalyst was prepared through an autoclave hydrothermal method using bismuth nitrate pentahydrate (Bi(NO3)3·5H2O) and zinc acetate (Zn(O2CCH3)2) as bismuth and zinc ion sources, respectively, and ammonia metavanadate (NH4VO3) as the vanadium ion source. The as-prepared nanocomposite was characterized by X-ray diffraction (XRD), scanning electron microscopy (SEM), energy dispersive X-ray spectroscopy (EDX), X-ray photoelectron spectroscopy (XPS), FT-IR, Raman, Brunauer–Emmett–Teller (BET), photoluminescence (PL), and EPR. For determining electrochemical response, cyclic voltammetry (CV) and electrochemical impedance spectroscopy (EIS) were performed. Zn3(VO4)2/BiVO4 nanocomposites were investigated for determining the activity of the nanophotocatalyst by photocatalytic degradation of methylene blue (MB) toxic dye under visible light irradiation. The catalyst showed excellent results and decomposed the toxic dye into mineral products (CO2, H2O and other intermediate product that are not/less harmful) in 45 min at pH 12. The material was also studied for electrochemical detection of an important analyte hydrogen peroxide (H2O2) and showed good results. This study indicates the potential of Zn3(VO4)2/BiVO4 nanocomposites for application in environmental remediation and biosensor sciences.Funding detail
The authors did not receive financial support for this work from any agency.Conflicts of interest
There are no conflicts of interest to declare.Acknowledgements
All the experiments were performed at Government college university Faisalabad, Pakistan. SEM, EDX, XPS, BET, Raman, PL and ESR techniques were supported by Dr Zhengjun Zhang, Advanced Key Laboratory for New Ceramics, School of Materials Science & Engineering, Tsinghua University, Beijing, China, 100084.Notes and references
- J. Li, W. Zhao, Y. Guo, Z. Wei, M. Han, H. He, S. Yang and C. Sun, Appl. Surf. Sci., 2015, 351, 270–279 CrossRef CAS.
- Y.-R. Jiang, H.-P. Lin, W.-H. Chung, Y.-M. Dai, W.-Y. Lin and C.-C. Chen, J. Hazard. Mater., 2015, 283, 787–805 CrossRef CAS PubMed.
- G. Shen, L. Pan, Z. Lü, C. Wang, X. Zhang and J.-J. Zou, Chin. J. Catal., 2018, 39, 920–928 CrossRef CAS.
- A. Houas, H. Lachheb, M. Ksibi, E. Elaloui, C. Guillard and J.-M. Herrmann, Appl. Catal., B, 2001, 31, 145–157 CrossRef CAS.
- C. L. Wong, Y. N. Tan and A. R. Mohamed, J. Environ. Manage., 2011, 92, 1669–1680 CrossRef CAS PubMed.
- F. Han, V. S. R. Kambala, M. Srinivasan, D. Rajarathnam and R. Naidu, Appl. Catal., A, 2009, 359, 25–40 CrossRef CAS.
- F. Sayılkan, S. Erdemoğlu, M. Asiltürk, M. Akarsu, Ş. Şener, H. Sayılkan, M. Erdemoğlu and E. Arpaç, Mater. Res. Bull., 2006, 41, 2276–2285 CrossRef.
- R. Andreozzi, V. Caprio, A. Insola and R. Marotta, Catal. Today, 1999, 53, 51–59 CrossRef CAS.
- X. Chang, G. Yu, J. Huang, Z. Li, S. Zhu, P. Yu, C. Cheng, S. Deng and G. Ji, Catal. Today, 2010, 153, 193–199 CrossRef CAS.
- Y. Zhou, F. Krumeich, A. Heel and G. R. Patzke, Dalton Trans., 2010, 39, 6043–6048 RSC.
- Z. Liu, D. D. Sun, P. Guo and J. O. Leckie, Nano Lett., 2007, 7, 1081–1085 CrossRef CAS PubMed.
- X. Liu, H. Cao and J. Yin, Nano Res., 2011, 4, 470–482 CrossRef CAS.
- M.-L. Guan, D.-K. Ma, S.-W. Hu, Y.-J. Chen and S.-M. Huang, Inorg. Chem., 2010, 50, 800–805 CrossRef PubMed.
- Z. Wang, B. Huang, Y. Dai, X. Qin, X. Zhang, P. Wang, H. Liu and J. Yu, J. Phys. Chem. C, 2009, 113, 4612–4617 CrossRef CAS.
- G. Dai, J. Yu and G. Liu, J. Phys. Chem. C, 2011, 115, 7339–7346 CrossRef CAS.
- M. Baojun, L. Keying, S. Weiguang and L. Wanyi, Appl. Surf. Sci., 2014, 317, 682–687 CrossRef.
- S. Chen, S. Zhang, W. Zhao and W. Liu, J. Nanopart. Res., 2009, 11, 931–938 CrossRef CAS.
- A. Beltrán, L. Gracia, J. Andrés and E. Longo, J. Phys. Chem. C, 2017, 121, 27624–27642 CrossRef.
- S. Chen, W. Zhao, W. Liu, H. Zhang, X. Yu and Y. Chen, J. Hazard. Mater., 2009, 172, 1415–1423 CrossRef CAS PubMed.
- L. Ma, S. Liang, X. L. Liu, D. J. Yang, L. Zhou and Q. Q. Wang, Adv. Funct. Mater., 2015, 25, 898–904 CrossRef CAS.
- C. Li, S. Wang, T. Wang, Y. Wei, P. Zhang and J. Gong, Small, 2014, 10, 2783–2790 CrossRef CAS PubMed.
- X. Gao, H. B. Wu, L. Zheng, Y. Zhong, Y. Hu and X. W. D. Lou, Angew. Chem., 2014, 126, 6027–6031 CrossRef.
- C. Shifu, Z. Wei, L. Wei, Z. Huaye, Y. Xiaoling and C. Yinghao, J. Hazard. Mater., 2009, 172, 1415–1423 CrossRef PubMed.
- L. Pan, J. Zhang, X. Jia, Y.-H. Ma, X. Zhang, L. Wang and J.-J. Zou, Chin. J. Catal., 2017, 38, 253–259 CrossRef CAS.
- I. Khan, S. Ali, M. Mansha and A. Qurashi, Ultrason. Sonochem., 2017, 36, 386–392 CrossRef CAS PubMed.
- N. Ahmed, S. Mukhtar, W. Gao and S. Z. Ilyas, Chin. Phys. B, 2018, 27, 033101 CrossRef.
- S. Yao, K. Ding and Y. Zhang, Theor. Chem. Acc., 2010, 127, 751–757 Search PubMed.
- J.-M. Wu, Y. Chen, L. Pan, P. Wang, Y. Cui, D. Kong, L. Wang, X. Zhang and J.-J. Zou, Appl. Catal., B, 2018, 221, 187–195 CrossRef CAS.
- P. Pookmanee, S. Kojinok, R. Puntharod, S. Sangsrichan and S. Phanichphant, Ferroelectrics, 2013, 456, 45–54 CrossRef CAS.
- P. Pookmanee, S. Kojinok and S. Phanichphant, Trans. Mater. Res. Soc. Jpn., 2014, 39, 431–434 CrossRef CAS.
- S. Ni, X. Wang, G. Zhou, F. Yang, J. Wang and D. He, J. Alloys Compd., 2010, 491, 378–381 CrossRef CAS.
- R. M. Kakhki and F. Ahsani, J. Mater. Sci.: Mater. Electron., 2018, 29, 3767–3774 CrossRef.
- M. Gotić, S. Musić, M. Ivanda, M. Šoufek and S. Popović, J. Mol. Struct., 2005, 744, 535–540 CrossRef.
- S. Thalluri, C. Martinez-Suarez, A. Virga, N. Russo and G. Saracco, Int. J. Chem. Eng. Appl., 2013, 4, 305 CAS.
- M. B. Navas, I. D. Lick, P. A. Bolla, M. L. Casella and J. F. Ruggera, Chem. Eng. Sci., 2018, 187, 444–454 CrossRef CAS.
- W. W. Lee, C.-S. Lu, C.-W. Chuang, Y.-J. Chen, J.-Y. Fu, C.-W. Siao and C.-C. Chen, RSC Adv., 2015, 5, 23450–23463 RSC.
- C.-T. Yang, W. W. Lee, H.-P. Lin, Y.-M. Dai, H.-T. Chi and C.-C. Chen, RSC Adv., 2016, 6, 40664–40675 RSC.
- S.-Y. Chou, C.-C. Chen, Y.-M. Dai, J.-H. Lin and W. W. Lee, RSC Adv., 2016, 6, 33478–33491 RSC.
- S.-Y. Chou, W.-H. Chung, L.-W. Chen, Y.-M. Dai, W.-Y. Lin, J.-H. Lin and C.-C. Chen, RSC Adv., 2016, 6, 82743–82758 RSC.
- F.-Y. Liu, Y.-R. Jiang, C.-C. Chen and W. W. Lee, Catal. Today, 2018, 300, 112–123 CrossRef CAS.
- D. Zeng, W. Xu, W.-J. Ong, J. Xu, H. Ren, Y. Chen, H. Zheng and D.-L. Peng, Appl. Catal., B, 2018, 221, 47–55 CrossRef CAS.
- A. Arshad, J. Iqbal, M. Siddiq, Q. Mansoor, M. Ismail, F. Mehmood, M. Ajmal and Z. Abid, J. Appl. Phys., 2017, 121, 024901 CrossRef.
- J. Liu, B. Cheng and J. Yu, Phys. Chem. Chem. Phys., 2016, 18, 31175–31183 RSC.
- C. Shifu, Z. Wei, L. Wei and Z. Sujuan, J. Sol-Gel Sci. Technol., 2009, 50, 387–396 CrossRef.
- S. Fatima, S. I. Ali, M. Z. Iqbal and S. Rizwan, RSC Adv., 2017, 7, 35928–35937 RSC.
- H. Rao, Z. Lu, X. Liu, H. Ge, Z. Zhang, P. Zou, H. He and Y. Wang, RSC Adv., 2016, 6, 46299–46307 RSC.
- M.-L. Chen and W.-C. Oh, Int. J. Photoenergy, 2010, 2010, 264831 Search PubMed.
- K. Pingmuang, A. Nattestad, J. Chen, W. Kangwansupamonkon and S. Phanichphant, J. Environ. Sci., 2016, 3, 1–8 Search PubMed.
- A. H. Abdullah, W. T. Peng and M. Z. Hussein, Malaysian Journal of Analytical Sciences, 2016, 20, 1338–1345 CrossRef.
- X. Li, M. Zou and Y. Wang, Molecules, 2017, 22, 1943 CrossRef PubMed.
- L. Pei, N. Lin, T. Wei, H. Liu and H. Yu, J. Mater. Chem. A, 2015, 3, 2690–2700 RSC.
- M. Liu, Y. X. Yu and W. D. Zhang, Electroanalysis, 2017, 29, 305–311 CrossRef CAS.
- S. Zeki Bas, C. Cummins, D. Borah, M. Ozmen and M. A. Morris, Anal. Chem., 2017, 90(2), 1122–1128 Search PubMed.
- Z. Yu, S. Lv, R. Ren, G. Cai and D. Tang, Microchim. Acta, 2017, 184, 799–806 CrossRef CAS.
Footnote |
| † Electronic supplementary information (ESI) available. See DOI: 10.1039/c8ra07320a |
| This journal is © The Royal Society of Chemistry 2018 |