
 Open Access Article
 This Open Access Article is licensed under a Creative Commons Attribution-Non Commercial 3.0 Unported Licence
Tissue metabolomics study to reveal the toxicity of a traditional Tibetan medicine ‘Renqing Changjue’ in rats†
Can Xu‡
a,
Yingfeng Wang‡a,
Caidan Rezeng‡c,
Lan Zhanga,
Baosheng Zhaob,
Xia Wanga,
Xiuyuan Wua,
Zhongfeng Li *a and
Jianxin Chen*b
*a and
Jianxin Chen*b
aDepartment of Chemistry, Capital Normal University, No. 105, Xisanhuanbeilu, Haidian District, Beijing 100048, PR China. E-mail: lizf@cnu.edu.cn; Fax: +86-10-68902687; Tel: +86-10-68902655
bBeijing University of Chinese Medicine, No. 11 Beisanhuandonglu, Chaoyang District, Beijing 100029, PR China. E-mail: cjx@bucm.edu.cn; Fax: +86-010-64286283; Tel: +86-010-64286508
cCollege of Pharmacy, Qinghai Nationalities University, No. 3 Bayizhong Road, Xining, 810000, PR China
First published on 8th November 2018
Abstract
Renqing Changjue (RQCJ), a precious Traditional Tibetan Medicine (TTM), has been widely used in the management of diseases of the digestive system, toxinosis and pyreticosis. However, in the formula, a significant level of heavy metals, which are potential toxic elements, are present. Therefore, it is important to assess the toxicity of RQCJ dynamically and holistically. In the present study, a 1H NMR metabolomics approach and inductively coupled plasma mass spectrometry (ICP-MS) were implemented to analyze the samples of liver, kidney and spleen from rats treated with RQCJ. The results revealed that 9 metabolites in the liver, 13 metabolites in the kidney and 16 metabolites in the spleen were significantly altered, which suggest that disturbances in TCA cycle, amino acid metabolism, energy metabolism and oxidative stress are produced by successive administration of RQCJ over 15 days. Complemented by histopathology and biochemical assay, the trends of the metabolite levels indicate that RQCJ caused tissue injury to a certain extent, which was evidenced by the high levels of As and Hg in the tissue. The toxic effects of RQCJ were alleviated in liver and kidney during the recovery period, and RQCJ may cause long-term damage in spleen. These findings provide a significant experimental proof on the estimated safety and valuable information about the metabolism of RQCJ, which will be valuable in determining the health risks of the drug.
1. Introduction
Renqing Changjue (RQCJ), is a precious Traditional Tibetan Medicines (TTM), which has been recorded in the ‘The Four Medical Tantras’ early in the 8th century as a mineral medicine.1 Based on the theory of Tibetan medical science, RQCJ is a black pill that consists of pearl, cinnabar, Santalum, Terminalia chebula, bezoar, musk, saffron and so on. The therapeutic effect of RQCJ is remarkable, especially on digestive system diseases, toxinosis and pyreticosis. However, with the wide application of Tibetan medicine, increasing concerns were raised regarding its safety problems. ‘Zuotai’ is the core ingredient of many Tibetan medicines including RQCJ,2 which is prepared by adding different kinds of mineral substances that might cause biotoxicity. While previous studies on RQCJ focused more on its ingredients3 and pesticidal effect,4 the biotoxicity of RQCJ still remains unclear. Therefore, more studies are needed to understand RQCJ-induced toxicity in a comprehensive manner.Metabolomics is a new method to study metabolic networks and the relationship between body metabolism and environment. It detects and quantifies global metabolites from biofluid or tissue samples with both endogenous and exogenous factors5 and has been widely applied in many fields such as disease diagnosis,6 drug discovery7 and toxicological evaluation.8 Among the techniques used in metabolomics, 1H nuclear magnetic resonance (NMR) spectroscopy is an effective and non-destructive way to identify a number of biomarkers9 and is applied widely to acquire the spectral profiles of biofluids and tissues.10,11 Body fluids such as urine and serum are wildly examined to detect any systemic metabolic deregulation.12 Tissue, on the other hand, is able to provide direct information on abnormal metabolic states or alterations happening in organs.13,14 More importantly, since some metabolic changes appear to be organ-specific, tissue metabolomics has become a powerful tool to directly identify the altered metabolites in organs. Inductively coupled plasma mass spectrometry (ICP-MS) is one of the most powerful techniques capable of detecting metals in biological fluids at concentrations as low as 10−15 and therefore, applied to determine the concentration of heavy metals in tissue extracts.
Recently, NMR metabolomics approach has been successfully applied in TTM studies15 for elucidating the toxicological mechanism of TTM. In this study, we have combined the NMR tissue metabolomics technique with ICP-MS to investigate the effect of RQCJ in rats. Changes induced by different dosages of RQCJ in the metabolic profiles of the liver, kidney and spleen of rats were successfully investigated. Several metabolic pathways including amino acid metabolism, energy metabolism and oxidative stress were found to be disturbed. The concentrations of heavy metals in the tissue extracts were determined. These results from the rat model could enhance our understanding of the toxicity or side effects of RQCJ.
2. Materials and methods
2.1 Chemicals and reagents
RQCJ (grant no. Z20110557) was purchased from Tso-Ngon Tibetan Medicine Hospital (QingHai, China). Methanol, K2HPO4·3H2O, and NaH2PO4·2H2O (both analytical grade) were obtained from Sigma-Aldrich (St. Louis, MO, U.S.A.). Deuterium oxide (D2O, 99.9% D) and sodium 3-trimethylsilyl [2,2,3,3-2H4]-propionate (TSP) were purchased from Cambridge Isotope Laboratories, Inc. (MA, U.S.A.). Standard stock solutions of metals used for the calibration curves were purchased from the National Center for Standard Materials (China).2.2 Animal handling procedure and sample collection
All animal procedures were performed in accordance with the Guidelines for Care and Use of Laboratory Animals of Beijing University of Chinese Medicine and approved by the Animal Ethics Committee of Beijing University of Chinese Medicine. Forty eight SPF male Sprague-Dawley rats (220 ± 10 g, Rodent license no. SCXK 2011-0004) purchased from Sibeifu Laboratory Animal Technology Co., Ltd. (Beijing, China) were maintained under regulated temperature (22 ± 2 °C), humidity (50 ± 10%) and a 12 h light/dark cycle. The animals were allowed to acclimatize to the environment for a week before the study started.The rats were randomly divided into four groups for a 15 day treatment (n = 12): control group (NC), low dose group (LD, 250.0 mg kg−1 body weight), middle dose group (MD, 666.7 mg kg−1 body weight) and high dose group (HD, 1666.7 mg kg−1 body weight), which were equivalent to 15, 40 and 100 times of the normal clinical dosage, respectively. The different doses of RQCJ were mixed with approximately the same volume of 0.9% saline solution and administrated orally.
Half of the rats from each group were euthanized on the 15th day (after the final administration of RQCJ), while the rest of the rats were sacrificed on the 30th day after a 15 day recovery period. Blood from the sacrificed rats was centrifuged at 2000 × g for 10 min to prepare serum for clinical biochemistry analysis. Liver, kidney and spleen tissues were removed immediately. Half each of liver and kidney were immersed in 10% neutral-buffered formaldehyde for 24 h and embedded in paraffin to be stained with hematoxylin and eosin (H&E) for pathological analysis. The residual liver, kidney and the entire spleen were snap-frozen in liquid nitrogen and stored at −80 °C for NMR and ICP-MS analysis.
2.3 Clinical biochemistry and histopathology
Clinical biochemical assays for the following parameters were performed on the serum samples in an Olympus 2700 analyzer (Olympus Co., Japan): aspartate aminotransferase (AST), alanine aminotransferase (ALT), alkaline phosphatase (ALP), blood urea nitrogen (BUN), glucose (GLU), and cholinesterase (CHE).The formalin-fixed liver, kidney and spleen slices were embedded in paraffin wax, sectioned at 5 μm thickness and stained with hematoxylin and eosin (H&E) for observation under a light microscope.
2.4 Sample preparation for ICP-MS measurement
The trace elements 75As and 202Hg in the tissue samples (5 different rats per group) were quantified by ICP-MS (Agilent Technologies, 7500 Ce) following a modified acid digestion method using HNO3 + H2O2 (5![[thin space (1/6-em)]](https://www.rsc.org/images/entities/char_2009.gif) :1) with microwave assisted digestion (CEM Co., MARS). An external calibration technique was followed for the quantitative analysis of the samples. Standard solutions were prepared by dilution of the stock solution with 5% (w/w) HNO3 (the same percentage of acid present in the samples) in ultrapure deionised water. Quantification was based on a four-point calibration curve with a series of concentrations (0.1–100 ng mL−1), using 72Ge and 209Bi as the internal standards for As and Hg, respectively.
:1) with microwave assisted digestion (CEM Co., MARS). An external calibration technique was followed for the quantitative analysis of the samples. Standard solutions were prepared by dilution of the stock solution with 5% (w/w) HNO3 (the same percentage of acid present in the samples) in ultrapure deionised water. Quantification was based on a four-point calibration curve with a series of concentrations (0.1–100 ng mL−1), using 72Ge and 209Bi as the internal standards for As and Hg, respectively.
2.5 Sample preparation for NMR measurement
Liver, kidney and spleen tissues (110 mg) were homogenized in a mixture of ice-cold methanol (4 mL g−1 wet mass) and deionized water (1.25 mL g−1 wet mass) for 2 minutes. To this homogenate, deionized water and chloroform (4 mL g−1, respectively) were added. The suspension was vortexed and the supernatant was collected, centrifuged at 12880 × g for 10 min at 4 °C and freeze-dried under nitrogen. The dried mass was reconstituted in 600 μL 0.1 mol L−1 phosphate buffer (pH 7.47, 0.05% TSP and 100% D2O) and 550 μL of the supernatant was decanted into a 5 mm NMR tube.
2.6 1H NMR spectroscopy
1H NMR spectra of all the tissues were acquired on a Varian VNMRS 600 MHz NMR spectrometer equipped with a 5 mm inverse-proton (HX) triple resonance probe and operated at 599.871 MHz 1H frequency and a temperature of 298 K. Spectra of the aqueous tissue extracts were recorded using one-dimensional RESAT pulse sequence by applying a water presaturation suppression for a recycle delay of 2 s and a mixing time of 100 ms. For each sample, the free induction decay (FID) was measured from 128 scans producing 64k data points over a spectral width of 12019 Hz. Before Fourier transformation, the FIDs were zero-filled to 64k points and processed with 0.5 Hz exponential line-broadenings. The assignment of metabolites for the tissue extracts was based on 2D (1H–1H) correlation spectroscopy (COSY), 2D (1H–13C) heteronuclear single quantum coherence spectroscopy (HSQC), and 2D (1H–1H) J-resolved spectroscopy (J-Res) experiments.
2.7 Data analysis
The phase and baseline of all the 1H NMR spectra were converted using the MestReNova software (Version 7.1.0, Mestrelab, Inc.) with shift correction by the TSP signal (δ 0.00). After the removal of residual water signals (δ 5.20–4.70), the spectral region δ 9.5–0.5 of each tissue sample was binned into 4250 integral segments of equal length (0.002 ppm) and then normalized to the total sum of the spectrum.The normalized NMR data was imported into SIMCA-P+12.0 (Umetrics, Sweden) and a series of multivariate statistical analysis were performed. Principle component analysis (PCA) was carried out using a mean-centered approach and the data was visualized using as principal component (PC) score plots to identify the general trends and outliers. Each point on the scores plot represents an individual sample. To improve the separation of groups and minimize the biological analytical variation, sample classes were modeled using PLS-DA and OPLS-DA algorithms by a unit variance-scaled approach; R2 was used to assess the amount of variation represented by the principal components and Q2 values indicated the robustness of the model. The model coefficients located the NMR variables associated with specific interventions as y variables. The model coefficients were then back-calculated from the coefficients incorporating the weight of the variables in order to enhance the interpretability of the model; in the coefficient plot, the intensity corresponds to the mean-centered model (variance) and the color-scale derives from the unit variance-scaled model (correlation). Thus, the biochemical components, which are responsible for the detected differences between samples in the score plots, can be extracted from the corresponding loadings with the weight of the variable contributing to the discrimination. The coefficient plots were generated with MATLAB scripts (downloaded from http://www.mathworks.com) with some in-house modifications and were color-coded based on absolute values of coefficients (r).
In order to discriminate the variables contributing to the assignment of spectra into the different groups, the variable importance in the projection (VIP) values of all the peaks from the OPLS-DA models were analyzed. Moreover, an independent sample T-test was imported into SPSS Statistics Base 17.0 (SPSS Inc, USA) for detecting the significant differences in selected signals between the two groups. A triple-standard was used to screen out the discriminative metabolites in our study, where the thresholds of |r| values, VIP values and p values were set as more than 0.750, more than 1.0, and less than 0.05, respectively.
3. Results
3.1 Clinical biochemistry and histopathology
Compared to the control group, AST was significantly increased in both HD and MD groups after successive administration of RQCJ for 15 days, while ALT increased only in the HD group. The level of BUN and ALP decreased in the HD and MD groups, whereas CHE decreased in the MD and LD groups. After a 15 day recovery, the mentioned changes had recovered to a certain degree. The details are displayed in Table S1, ESI.†Fig. S1† shows the histopathological changes in the liver and kidney after H&E staining. There were no signs of apparent abnormality in control livers and kidneys. On the 15th day, slight necrosis, swelling of hepatocytes and mild tubular lesions were observed in rats. Samples extracted after 15 days of regeneration showed recovery trends in the RQCJ-induced liver and kidney injuries.
3.2 1H NMR spectra of tissue extracts sample
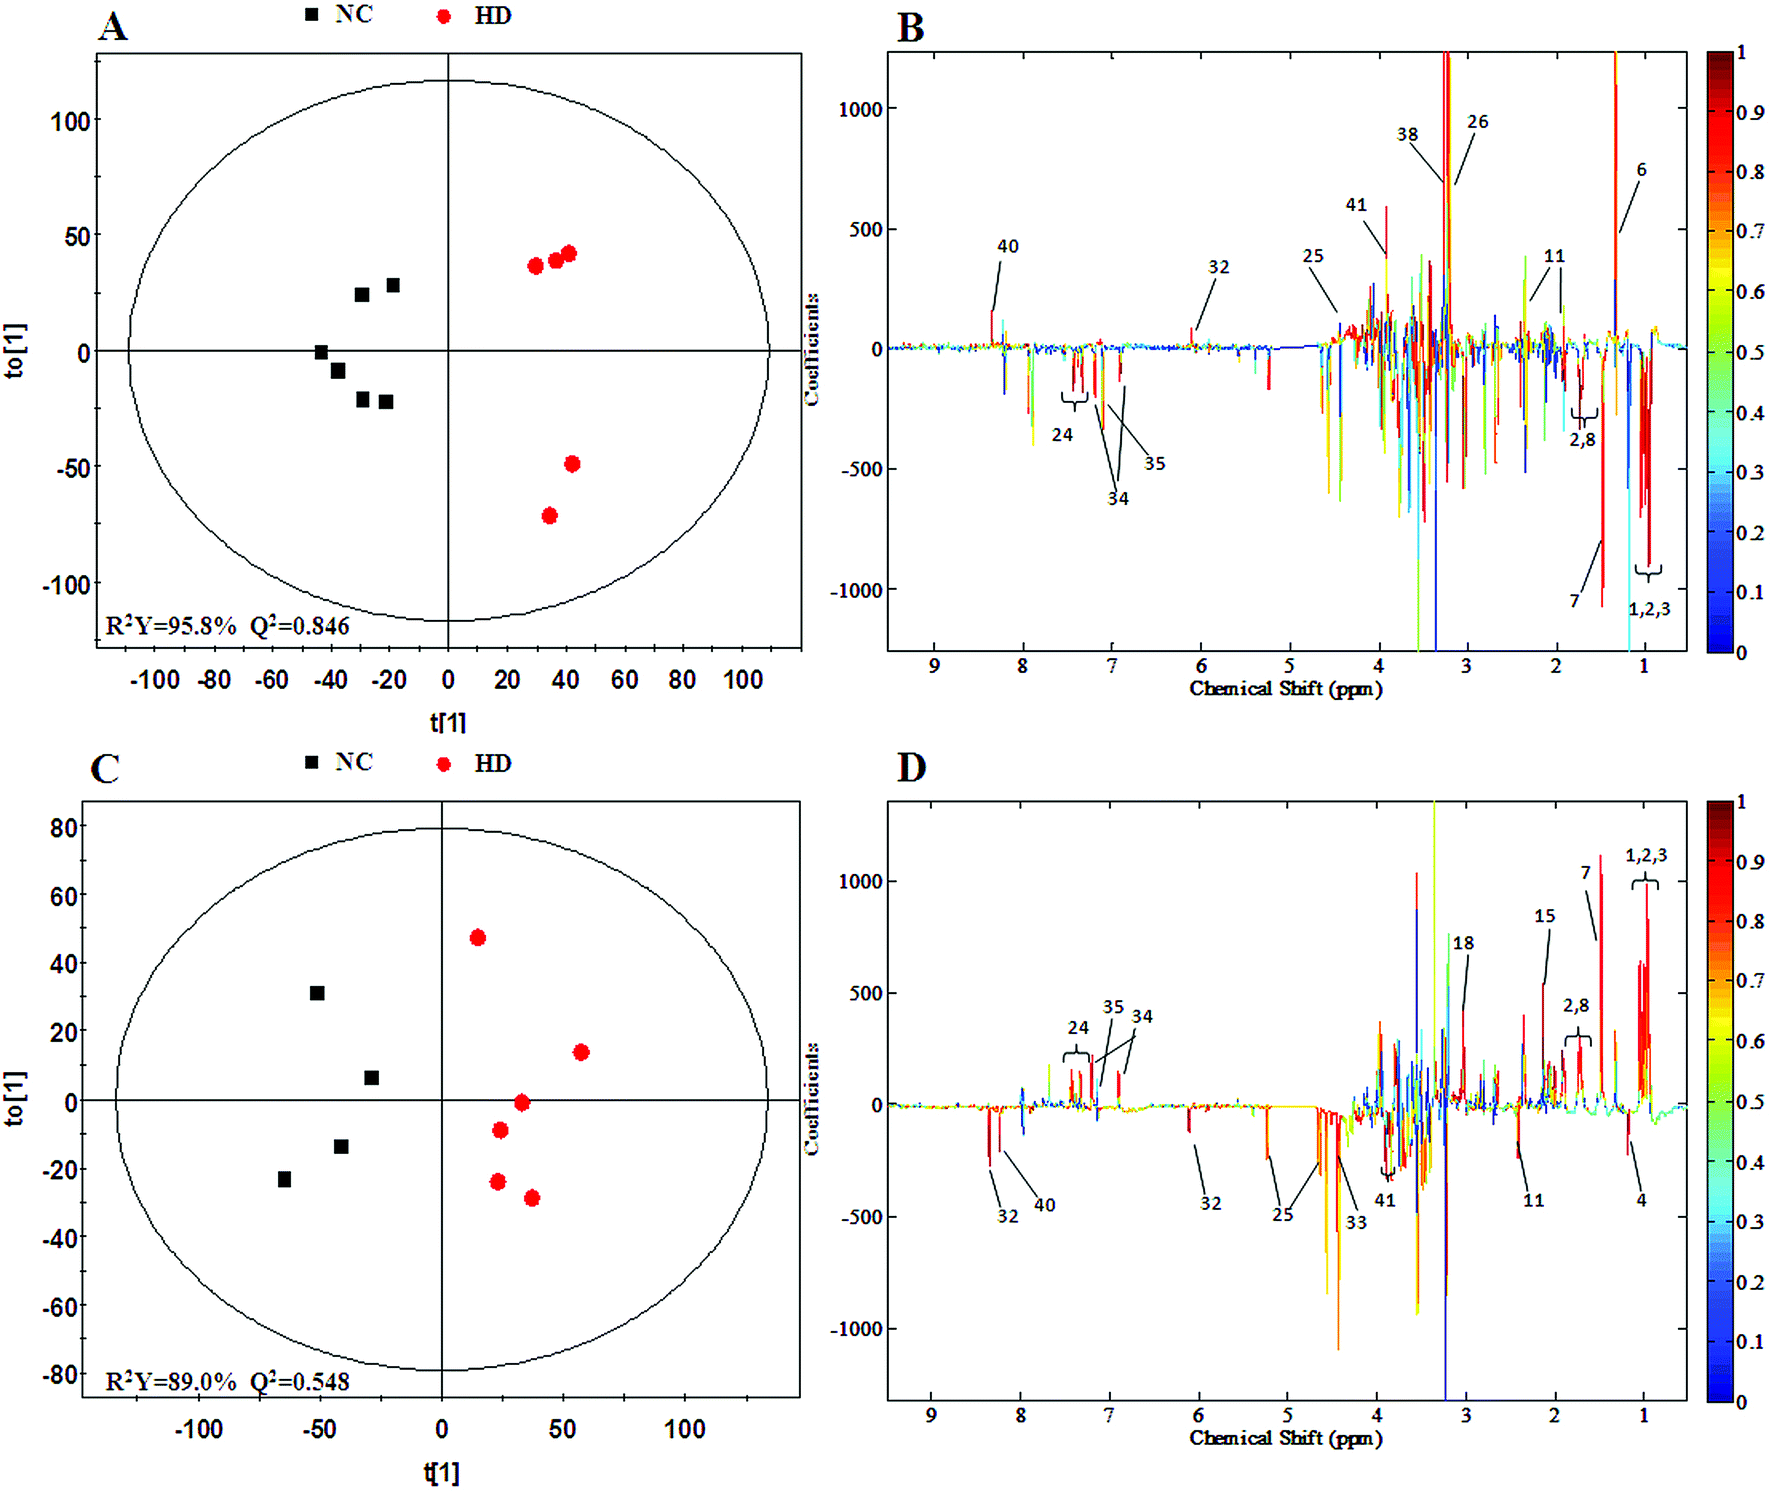
Typical 600 MHz 1H NMR spectra of the liver, kidney and spleen extracts from the NC and HD groups on the 15th day are shown in Fig. 1 with the main metabolites in the integrate regions labeled. Metabolites were identified according to the Chenomx NMR Suite 6.0 (Chenomx, Edmonton, Canada), previously reported ref. 16–20, an in-house NMR database and publicly accessible metabolomics databases such as the Human Metabolome Database (HMDB, http://www.hmdb.ca) and were further confirmed by COSY, HSQC and J-Res (Fig. S2†).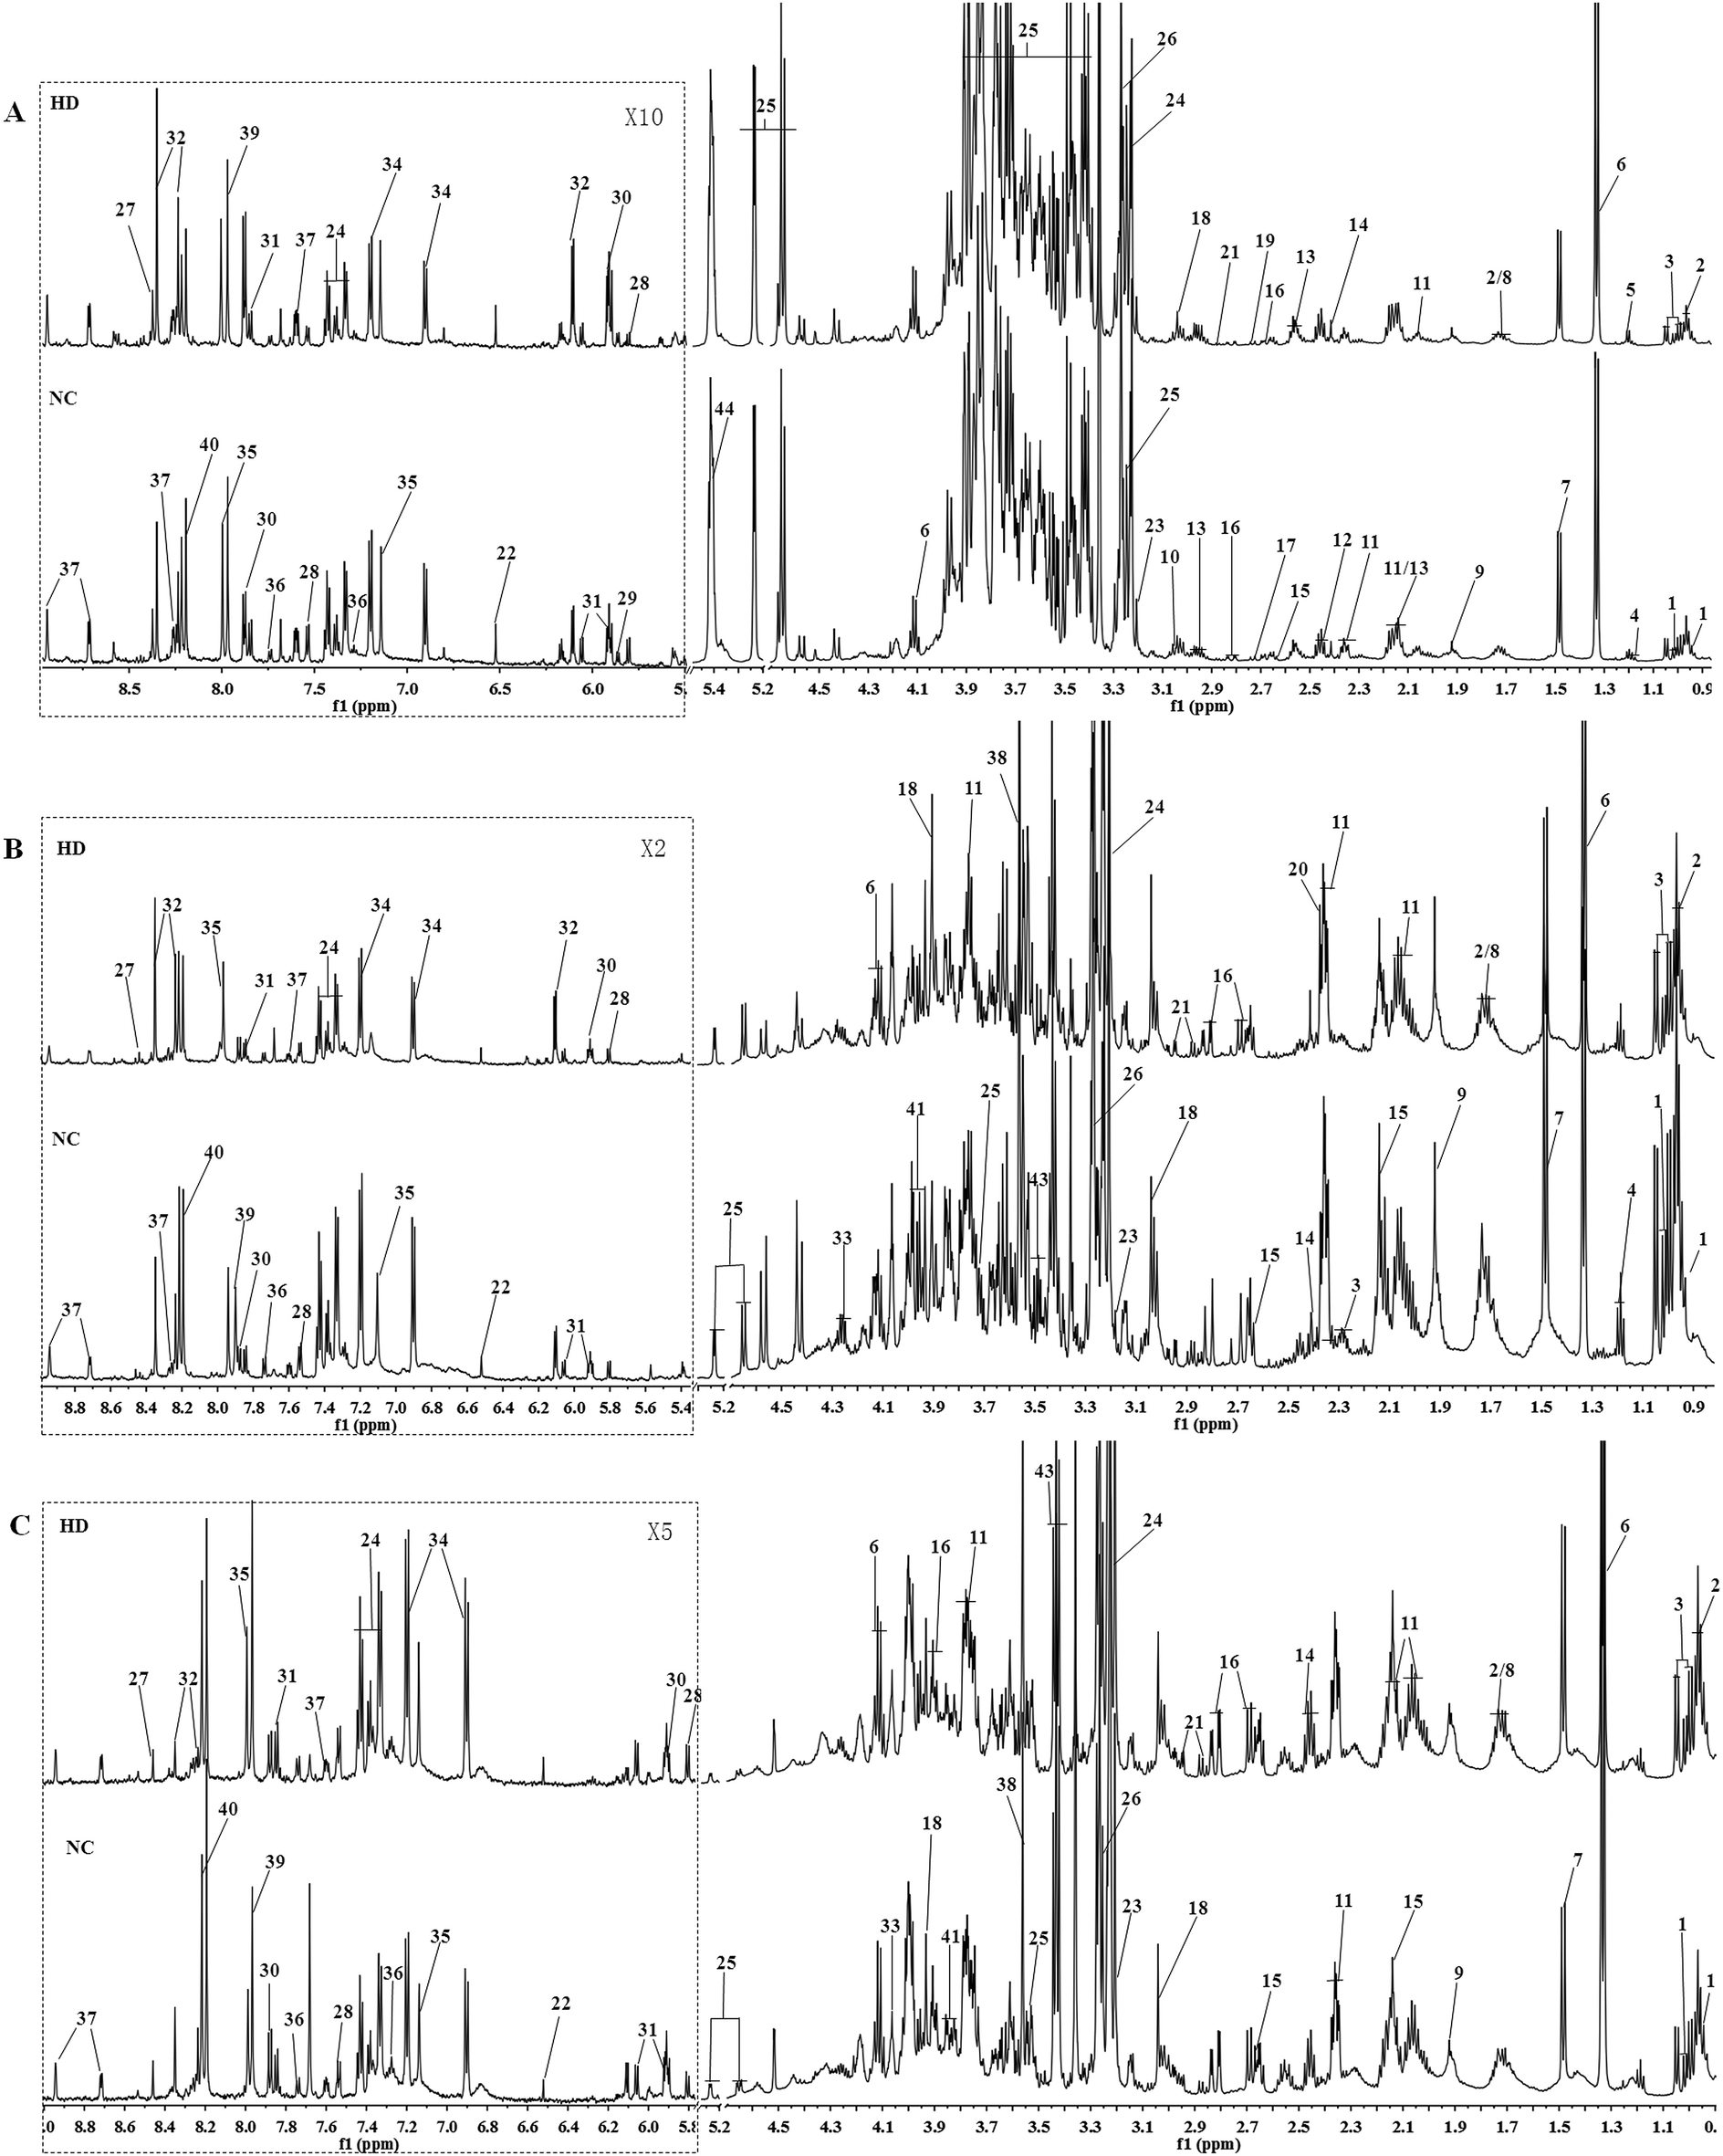 | ||
| Fig. 1 Typical 600 MHz 1H NMR spectra of liver (A), kidney (B) and spleen (C) from control and high dose rat groups. Distinguished metabolites: (1) isoleucine; (2) leucine; (3) valine; (4) ethanol; 5, 3-hydroxybutyrate; (6) lactate; (7) alanine; (8) lysine; (9) acetate; (10) ornithine; (11) glutamate; (12) glutamine; (13) glutathione; (14) succinate; (15) methionine; (16) aspartate; (17) dimethylamine; (18) creatine; (19) sarcosine; (20) pyruvate; (21) asparagine; (22) fumarate; (23) choline; (24) phosphocholine; (25) glucose glycine; (26) betaine; (27) formate; (28) uracil; (29) xanthosine; (30) uridine; (31) cytidine; (32) inosine; (33) threonine; (34) tyrosine; (35) histidine; (36) tryptophan; (37) niacinamide; (38) glycine; (39) xanthine; (40) hypoxanthine; (41) serine; (42) ethanolamine; (43) taurine; (44) glycogen. | ||
3.3 Metabolic responses of liver after RQCJ administration
In order to find possible outliers, a global PCA analysis of the 1H NMR spectra was carried out. PCA of the liver extract from the 15th day (Fig. 2A) displayed a separation between the NC group and RQCJ dosed groups. There was a slight overlap between NC and LD group; however, the RQCJ-dosed groups could not be distinguished very clearly. On the 30th day (Fig. 2B), the distinction between the groups was less clear compared to the 15th day. Interestingly, PLS-DA on the 15th day (Fig. S3A†) presented more obvious separations between NC group and dosed groups, while the separation of the groups on the 30th day was less clear (Fig. S3B†).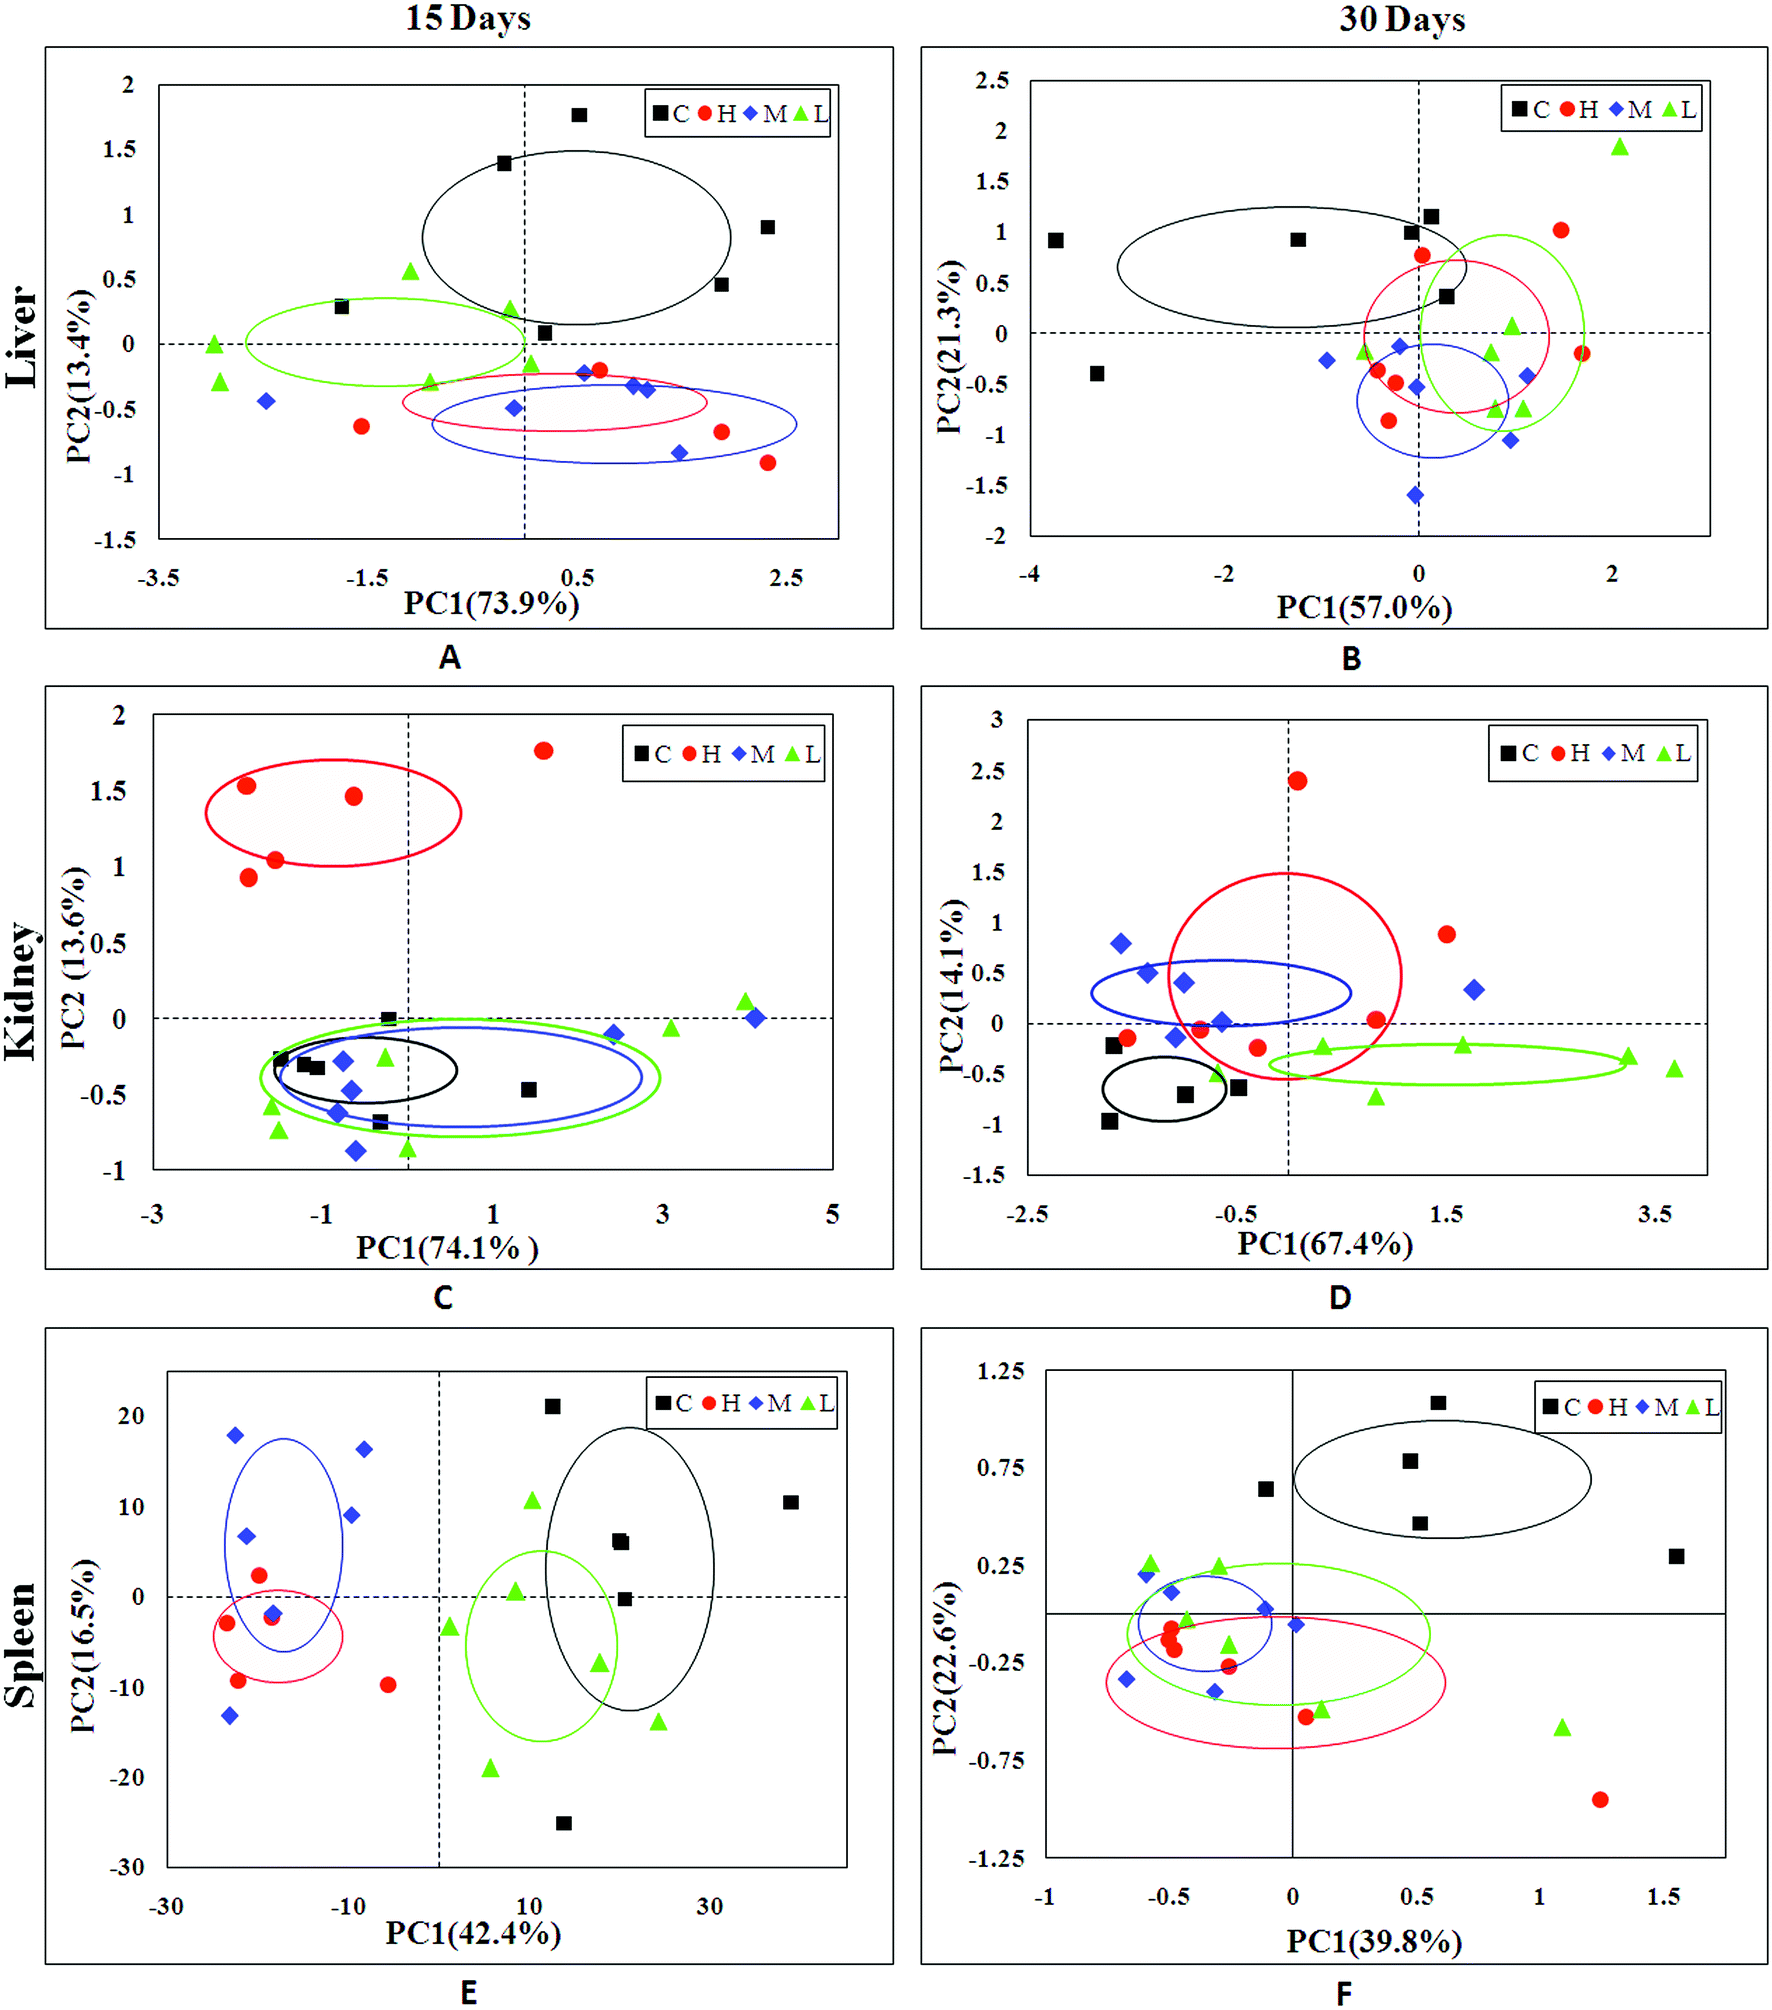 | ||
| Fig. 2 PCA plot of liver (A and B), kidney (C and D) and spleen (E and F) samples from the control and dosed groups at day 15 and day 30. | ||
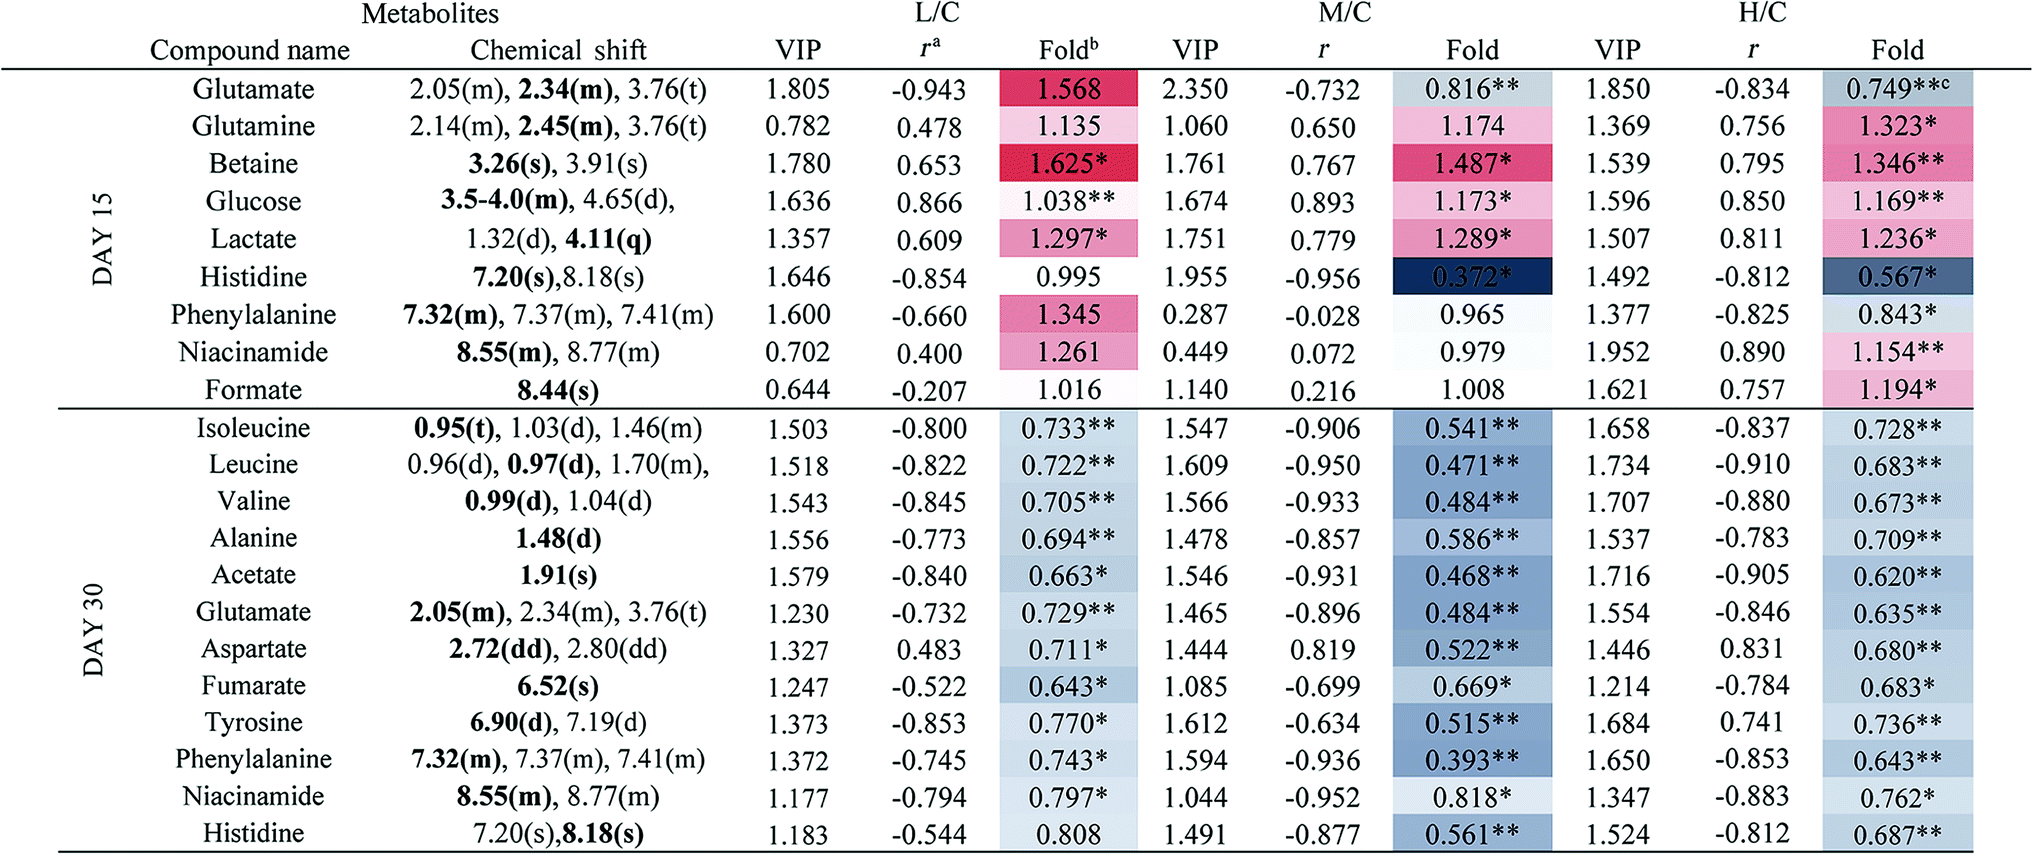
To achieve a global profile separation between the two classes, the supervised method of OPLS-DA was applied. A good separation between the liver extracts from the NC and each of the dosed groups could be observed as presented in Fig. 3 and S4.† In the color-coded loading plots of NC vs. HD on day 15, metabolites in the positive region (glutamine, betaine, glucose, lactate, uridine, inosine and formate) were increased in the HD group, whereas those in the negative region were deceased (glutamate, histidine, phenylalanine and niacinamide). On the 30th day, when most of the disturbed metabolites were back to normal, there was still some significant amount of metabolites in the high dosed group including alanine, acetate, lactate, lysine, glucose and histidine. The 1H NMR-detected relative integral levels of metabolites in the liver samples of different treatment groups are shown in Table 1.
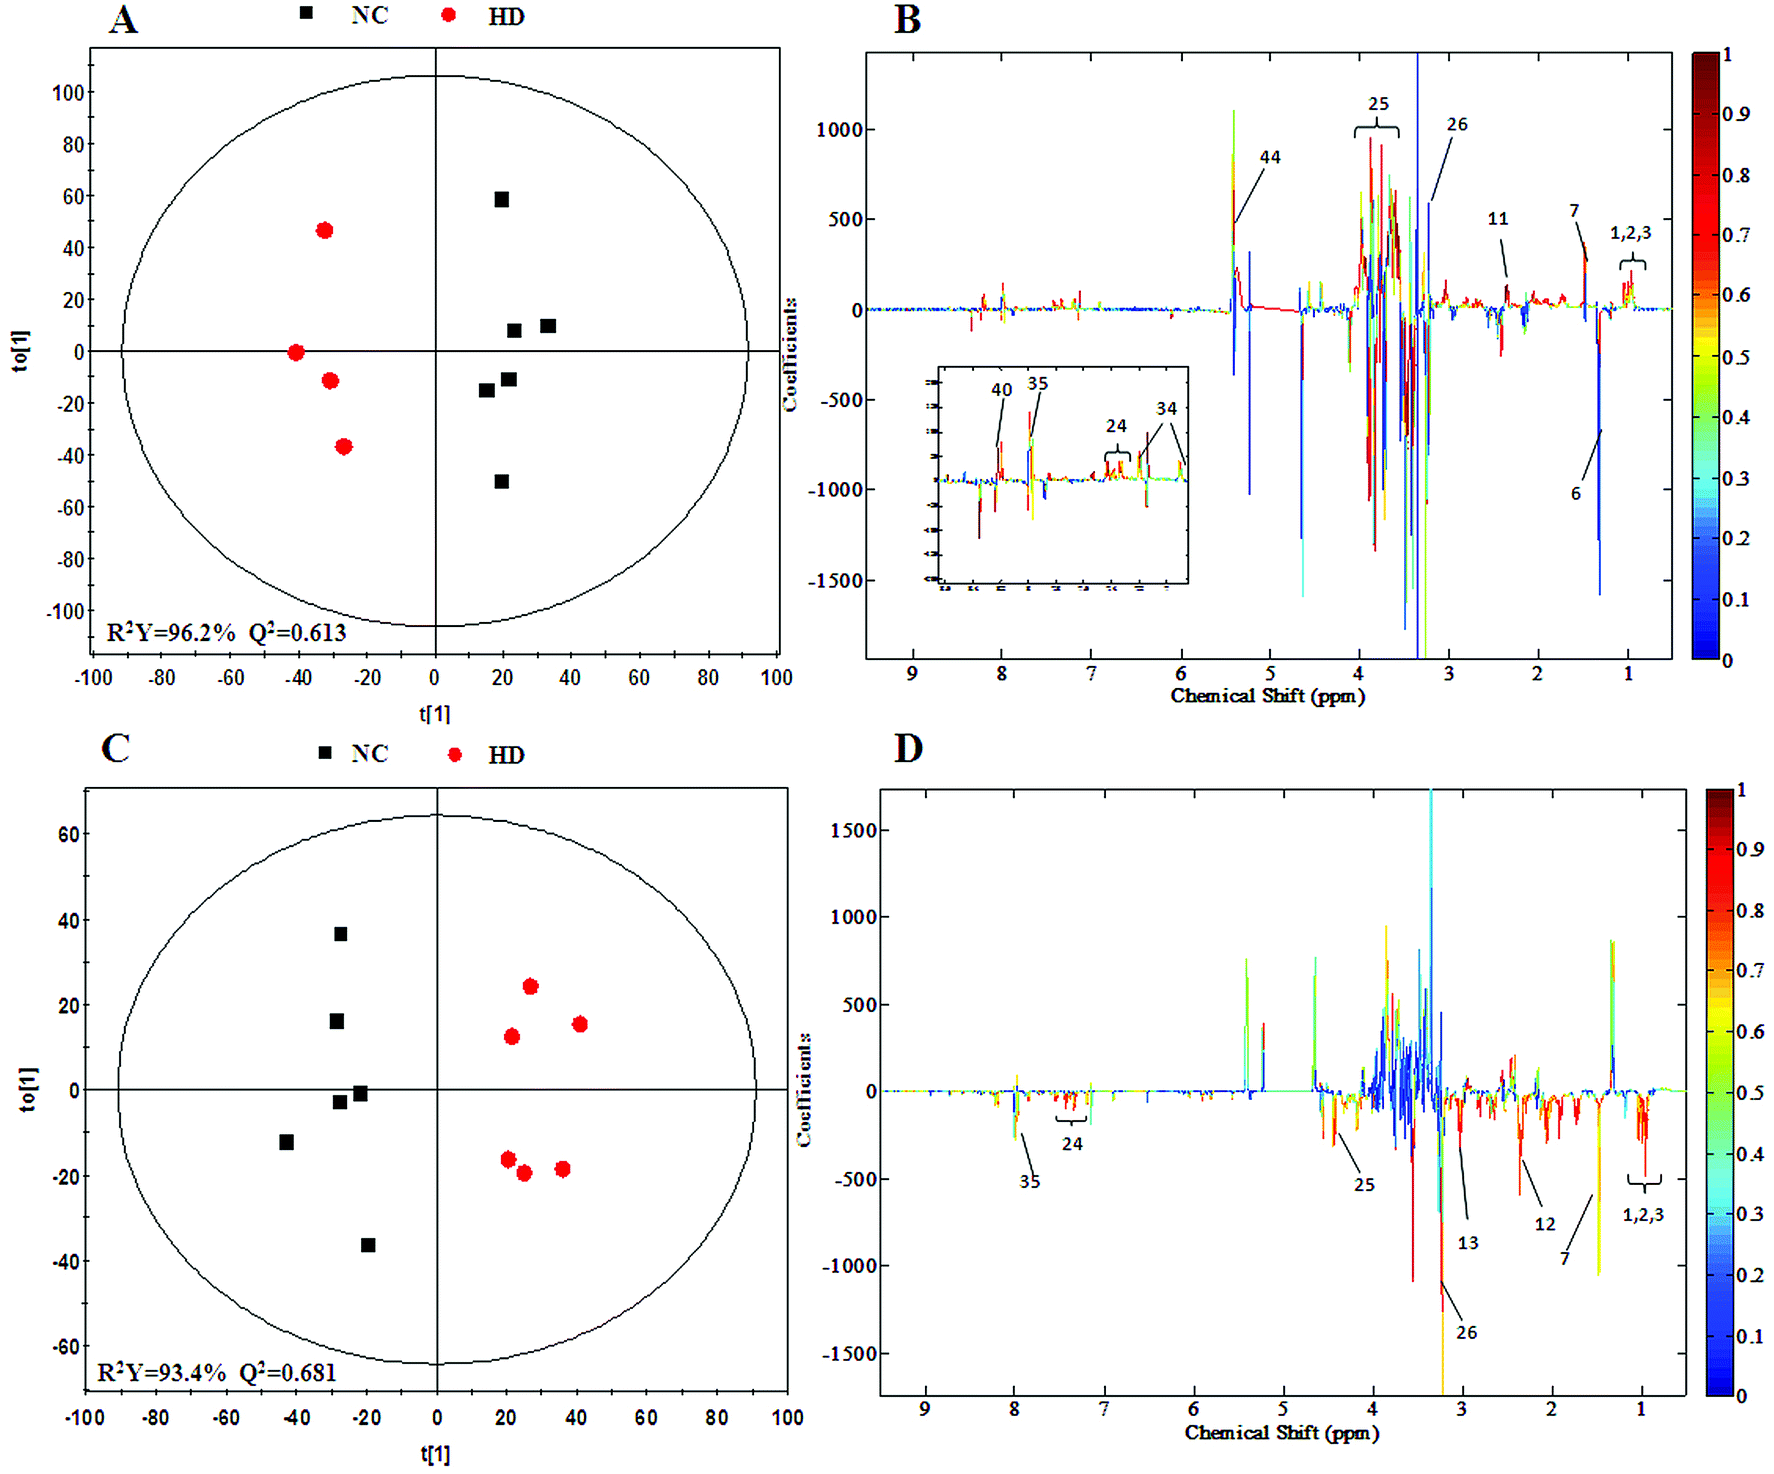 | ||
| Fig. 3 OPLS-DA score plots (A and C) and coefficient loading plots (B and D) derived from the 1H NMR spectra of liver extracts from the HD and NC groups at day 15 and day 30. The color code corresponds to the correlation coefficients of the metabolic variables. The loading plots identifying the discriminatory metabolites between the HD and NC groups are based on the first principal component [t(1)]. Signals with a positive direction relate to the abundance of metabolites in the groups in the positive direction of [t(1)] and vice versa. | ||
a Correlation coefficients – positive and negative signs indicate positive and negative correlation in concentrations, respectively. The correlation coefficient value of |r| > 0.750 was used as the cutoff for statistical significance based on the discrimination significance.b Fold change values color coded according to log2(fold): red indicates increase and blue indicates decrease in each group.  color bar.c The p values were obtained from student's t-test. The chemical shifts indicated in bold font are those used in calculating the integrals and p values. *p < 0.05, **p < 0.01. color bar.c The p values were obtained from student's t-test. The chemical shifts indicated in bold font are those used in calculating the integrals and p values. *p < 0.05, **p < 0.01. |
|---|
 |
3.4 Metabolic responses of kidney after RQCJ administration
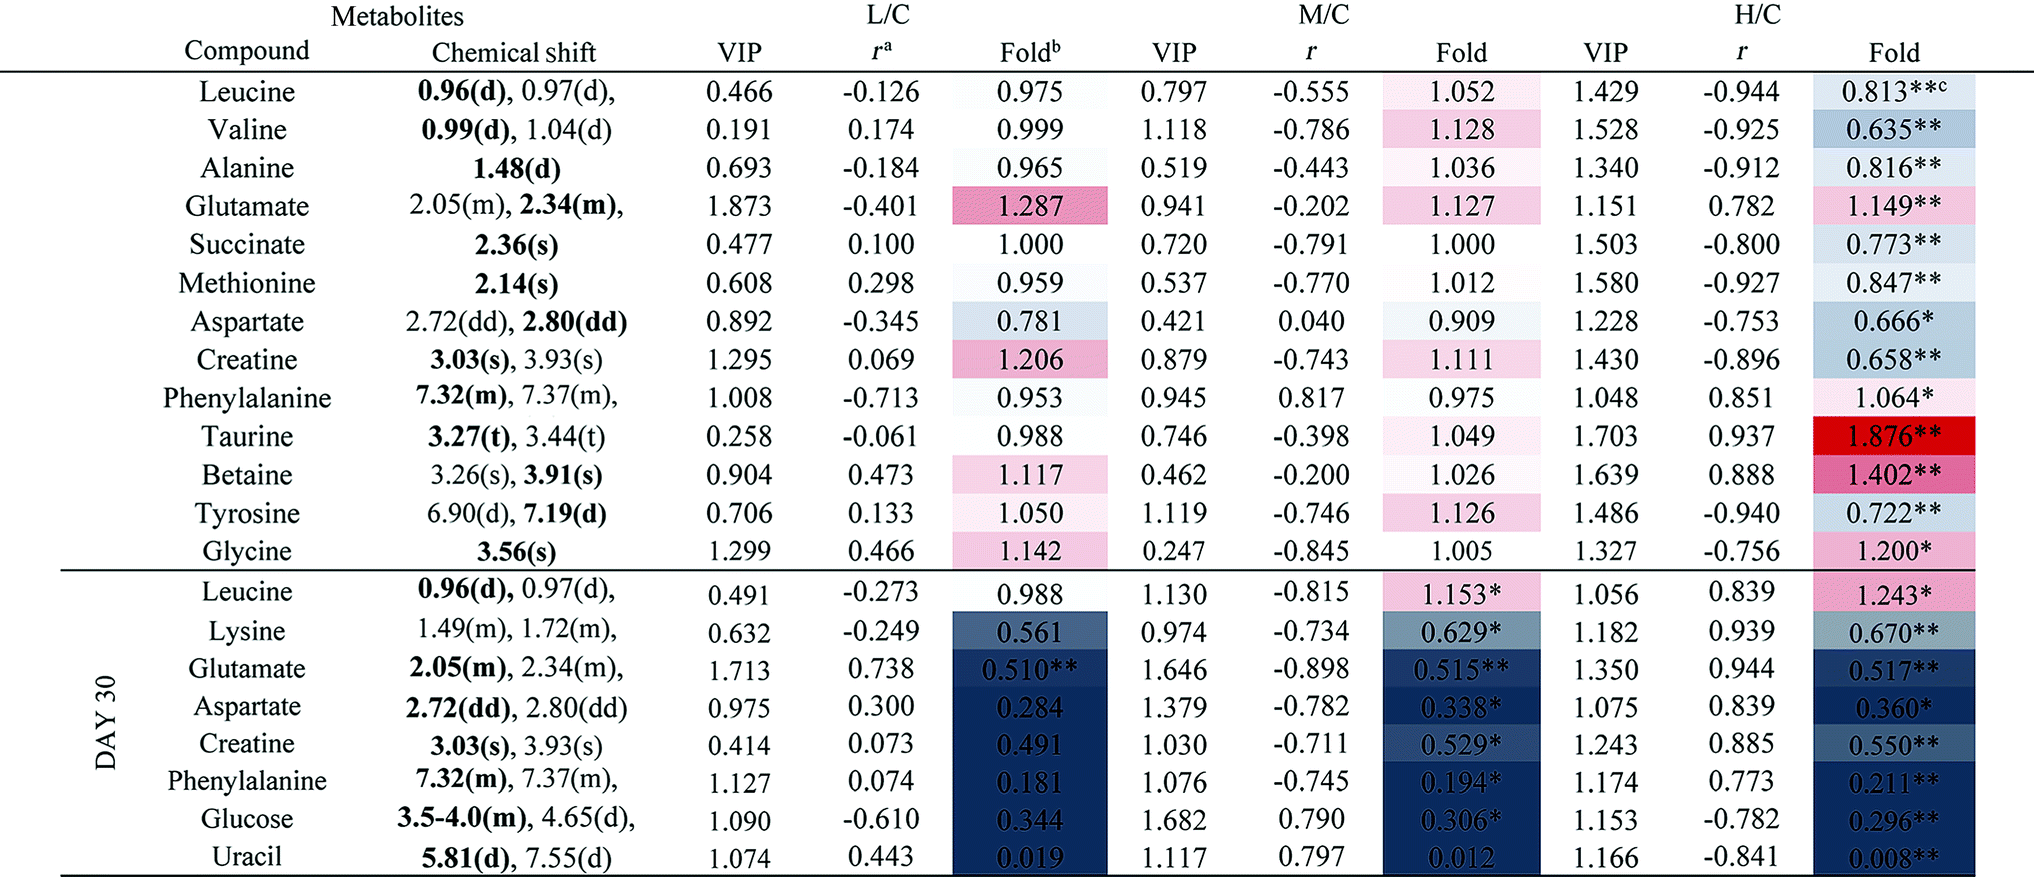
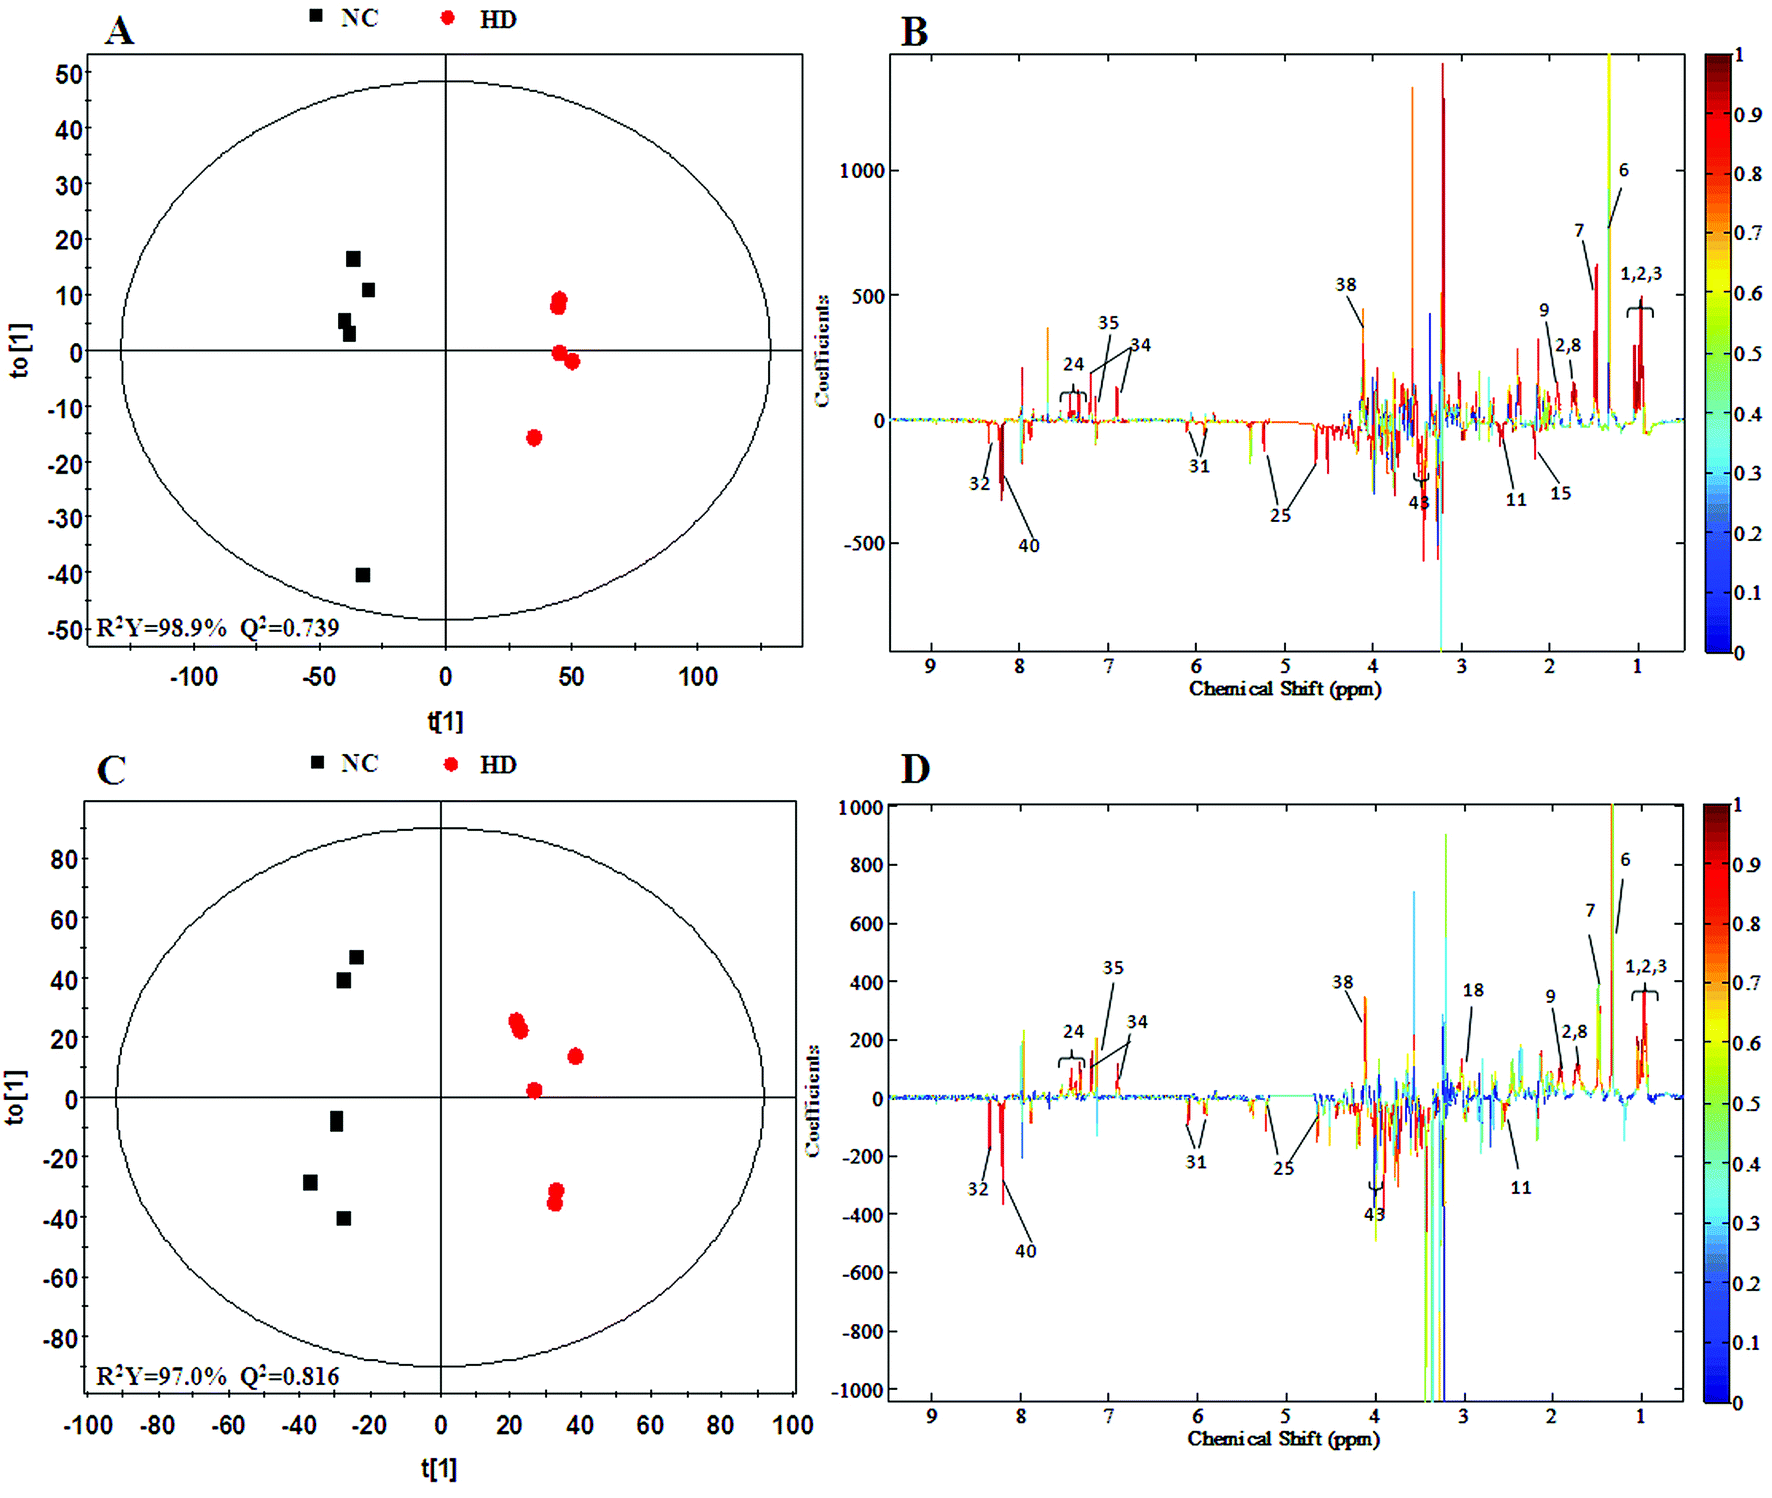
The PCA score plot of kidney (Fig. 2C) showed a clear separation between the HD group and NC group, while there were slight overlaps between the NC, MD and LD groups. As for the withdrawal period (Fig. 2D), the difference between HD group and NC group was less obvious. The PLS-DA score plot on the 15th day (Fig. S3C†) displayed a distinct separation of the four groups. While on the 30th day (Fig. S3D†), the separation was less obvious.The OPLS-DA score plots of kidney exhibited a clear separation between he dosed groups and NC group (Fig. 4 and S5†). The OPLS-DA coefficient plot (Fig. 4B) clearly suggested that glutamate, phenylalanine, glycine, taurine and glucose concentrations are high in the HD group, while isoleucine, leucine, valine, alanine, succinate, methionine, aspartate, creatine, tyrosine, and uridine are low in the HD group. After 15 days of recovery, significant changes in the level of leucine, isoleucine, glucose, aspartate and creatine could still be detected. The 1H NMR-based relative integral levels of metabolites in the kidney samples of the different groups are shown in Table 2.
 | ||
| Fig. 4 OPLS-DA score plots (A and C) and coefficient loading plots (B and D) derived from the 1H NMR spectra of kidney extracts from the HD and NC groups at day 15 and day 30. The color code corresponds to the correlation coefficients of the metabolic variables. The loading plots identifying the discriminatory metabolites between the HD and NC groups are based on the first principal component [t(1)]. Signals with a positive direction relate to the abundance of metabolites in the groups in the positive direction of [t(1)] and vice versa. | ||
a Correlation coefficients – positive and negative signs indicate positive and negative correlation in concentration, respectively. The correlation coefficient value of |r| > 0.750 was used as the cutoff for statistical significance based on the discrimination significance.b Fold change values color coded according to log2(fold): red indicates increase and blue indicates decrease in each group.  color bar.c The p values were obtained from student's t-test. The chemical shifts indicated in bold font are those used in calculating the integrals and p values. *p < 0.05, **p < 0.01. color bar.c The p values were obtained from student's t-test. The chemical shifts indicated in bold font are those used in calculating the integrals and p values. *p < 0.05, **p < 0.01. |
|---|
 |
3.5 Metabolic responses of spleen after RQCJ administration
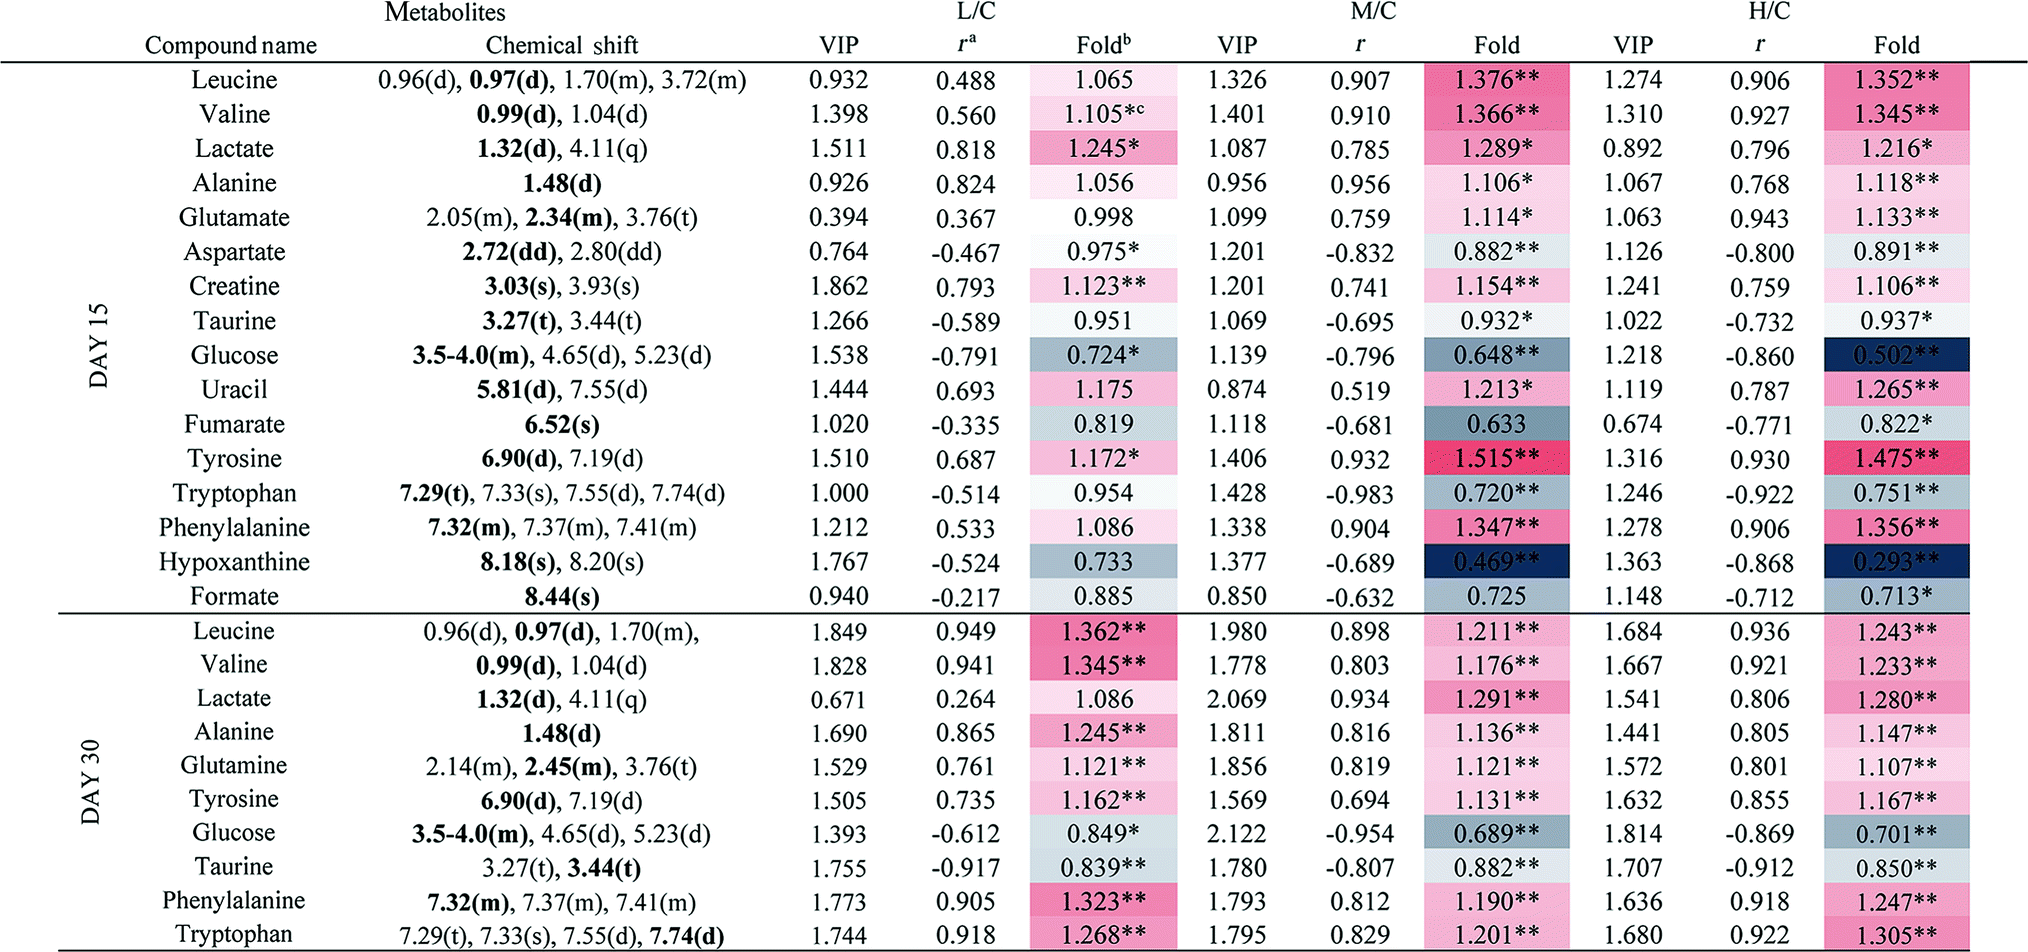
A clear propensity for differentiation between the dosed groups and NC group could be observed on day 15 in the PCA score plot (Fig. 2E). And after the withdrawal period, there was no obvious recovery displayed in the dosed groups (Fig. 2F). The PLS-DA score plot on the 15th day (Fig. S3C†) displayed a clearly separation of the four groups and the separation was more obvious on the 30th day (Fig. S3D†).The OPLS-DA score plots (Fig. 5 and S6†) showed that samples of the HD group were well discriminated from the NC group. Compared to the NC group, elevated levels of leucine, valine, isoleucine, lactate, alanine, glutamate, creatine, glycine, uracil, phenylalanine and tyrosine were observed in the HD group, whereas the levels of aspartate, taurine, glucose, fumarate, histidine, tryptophan, niacinamide, hypoxanthine and formate had decreased. There was no evident recovery on the 30th day. The relative integral levels of metabolites in the spleen samples of different groups based on 1H NMR are shown in Table 3.
 | ||
| Fig. 5 OPLS-DA score plots (A and C) and coefficient loading plots (B and D) derived from the 1H NMR spectra of spleen extracts from the HD and NC groups at day 15 and day 30. The color code corresponds to the correlation coefficients of the metabolic variables. The loading plots identifying the discriminatory metabolites between the HD and NC groups are based on the first principal component [t(1)]. Signals with a positive direction relate to the abundance of metabolites in the groups in the positive direction of [t(1)] and vice versa. | ||
a Correlation coefficients – positive and negative signs indicate positive and negative correlation in concentration, respectively. The correlation coefficient value of |r| > 0.750 was used as the cutoff for statistical significance based on the discrimination significance.b Fold change values color coded according to log2(fold): red indicates increase and blue indicates decrease in each group.  color bar.c The p values were obtained from student's t-test. The chemical shifts indicated in bold font are those used in calculating the integrals and p values. *p < 0.05, **p < 0.01. color bar.c The p values were obtained from student's t-test. The chemical shifts indicated in bold font are those used in calculating the integrals and p values. *p < 0.05, **p < 0.01. |
|---|
 |
3.6 Metabolic pathway analysis
The identified biomarkers were subjected to pathway analysis using the MetaboAnalyst 3.0 (http://www.metaboanalyst.ca/MetaboAnalyst/) software. Pathways with impact value above 0.1 were screened out as potential target pathways. Seven potential target pathways were identified in the liver samples (Fig. 6A) including D-glutamine and D-glutamate metabolism, Phenylalanine tyrosine and tryptophan biosynthesis, alanine aspartate and glutamate metabolism, phenylalanine metabolism, histidine metabolism, nicotinate and nicotinamide metabolism, and glyoxylate and dicarboxylate metabolism. Results from the kidney samples revealed 9 potential target pathways including phenylalanine, tyrosine and tryptophan biosynthesis, D-glutamine and D-glutamate metabolism, valine, leucine and isoleucine biosynthesis, alanine, aspartate and glutamate metabolism, taurine and hypotaurine metabolism, phenylalanine metabolism, glycine, serine and threonine metabolism, tyrosine metabolism, arginine and proline metabolism (Fig. 6B). In spleen, 10 potential target pathways (Fig. 6C) including phenylalanine tyrosine and tryptophan biosynthesis, D-glutamine and D-glutamate metabolism, valine leucine and isoleucine biosynthesis, alanine aspartate and glutamate metabolism, taurine and hypotaurine metabolism, phenylalanine metabolism, tryptophan metabolism, tyrosine metabolism, glyoxylate and dicarboxylate metabolism, and arginine and proline metabolism could be identified. The details of the pathways are given in Tables S2–S4, ESI.†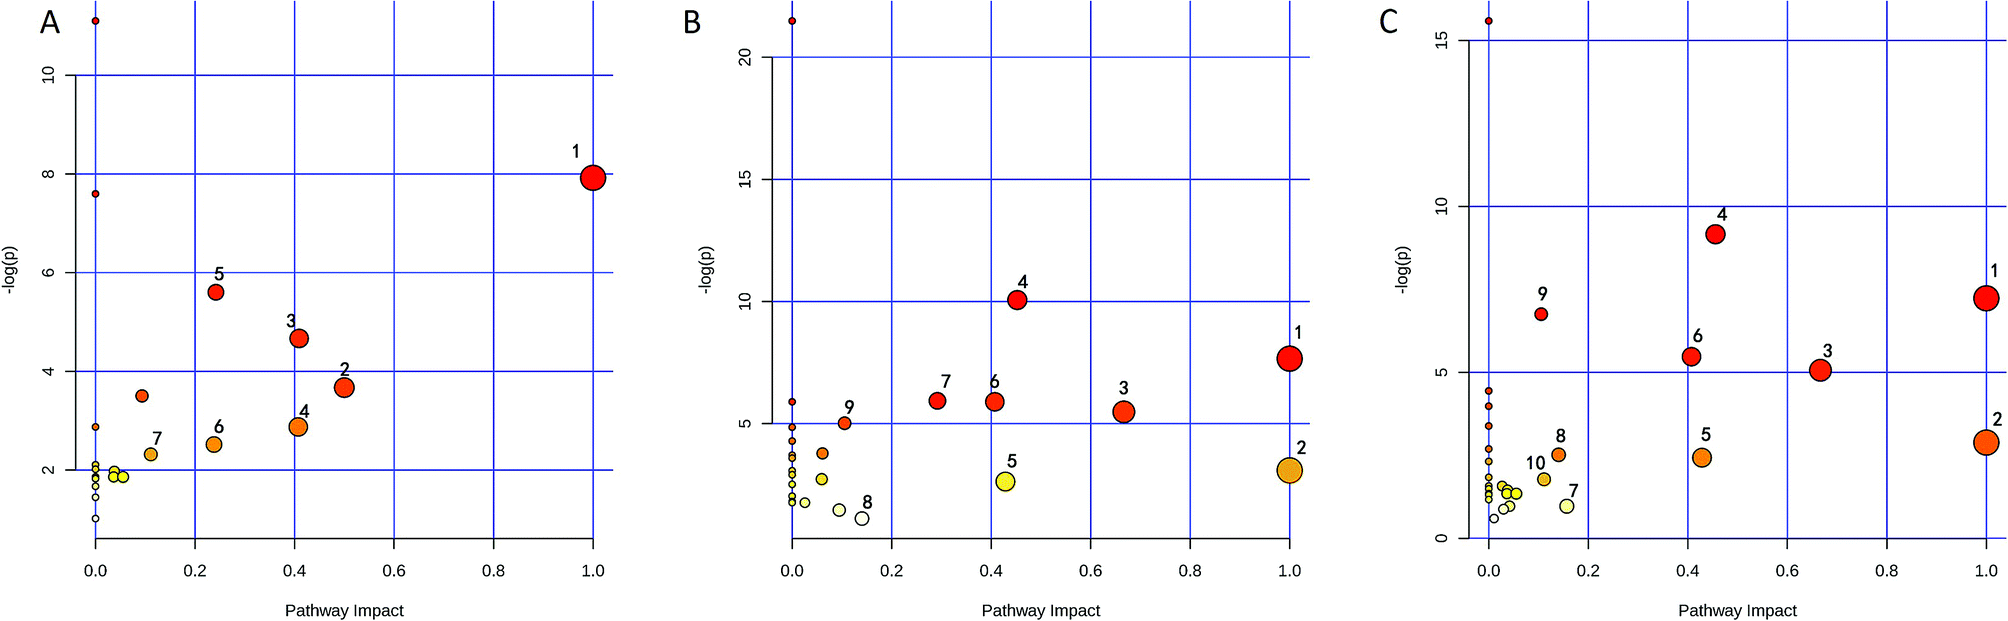 | ||
| Fig. 6 Metabolic pathway analysis of (A) liver, (B) kidney and (C) spleen. The pathway impact values are calculated from pathway topology analysis. Liver: (1) D-glutamine and D-glutamate metabolism; (2) phenylalanine, tyrosine and tryptophan biosynthesis; (3) alanine, aspartate and glutamate metabolism; (4) phenylalanine metabolism; (5) histidine metabolism; (6) nicotinate and nicotinamide metabolism; (7) glyoxylate and dicarboxylate metabolism. Kidney: (1) phenylalanine, tyrosine and tryptophan biosynthesis; (2) D-glutamine and D-glutamate metabolism; (3) valine, leucine and isoleucine biosynthesis; (4) alanine, aspartate and glutamate metabolism; (5) taurine and hypotaurine metabolism; (6) phenylalanine metabolism; (7) glycine, serine and threonine metabolism; (8) tyrosine metabolism; (9) arginine and proline metabolism. Spleen: (1) phenylalanine, tyrosine and tryptophan biosynthesis; (2) D-glutamine and D-glutamate metabolism; (3) valine, leucine and isoleucine biosynthesis; (4) alanine, aspartate and glutamate metabolism; (5) taurine and hypotaurine metabolism; (6) phenylalanine metabolism; (7) tryptophan metabolism; (8) tyrosine metabolism; (9) glyoxylate and dicarboxylate metabolism; (10) arginine and proline metabolism. | ||
3.7 Determination of As and Hg levels in the tissue samples by ICP-MS
ICP-MS is a useful technique that could help assess the existence of heavy metals. As RQCJ contains some heavy metals (Hg and As), measuring their concentration in the tissues could provide direct proof about the way RQCJ could affect the metabolism. The ICP-MS results are summarized in Table S5† and Fig. 7. The levels of both As and Hg were clearly dose-dependent in the tissue samples. The concentration of As of dosed group rats showed an obvious increase in liver during the 30 day experiment, which meant that the accumulation of As was significant in the liver. On the other hand, although after 15 day of oral administration, the concentrations of Hg in the liver of dosed groups were substantially higher than the NC group, data showed no accumulation after the 15 days of recovery. The changes of Hg and As showed the same trend in kidney, both increased during the oral administration and declined during the recovery period. The level of As showed a clear accumulation in spleen, while Hg could not even be detected (less than detection limit).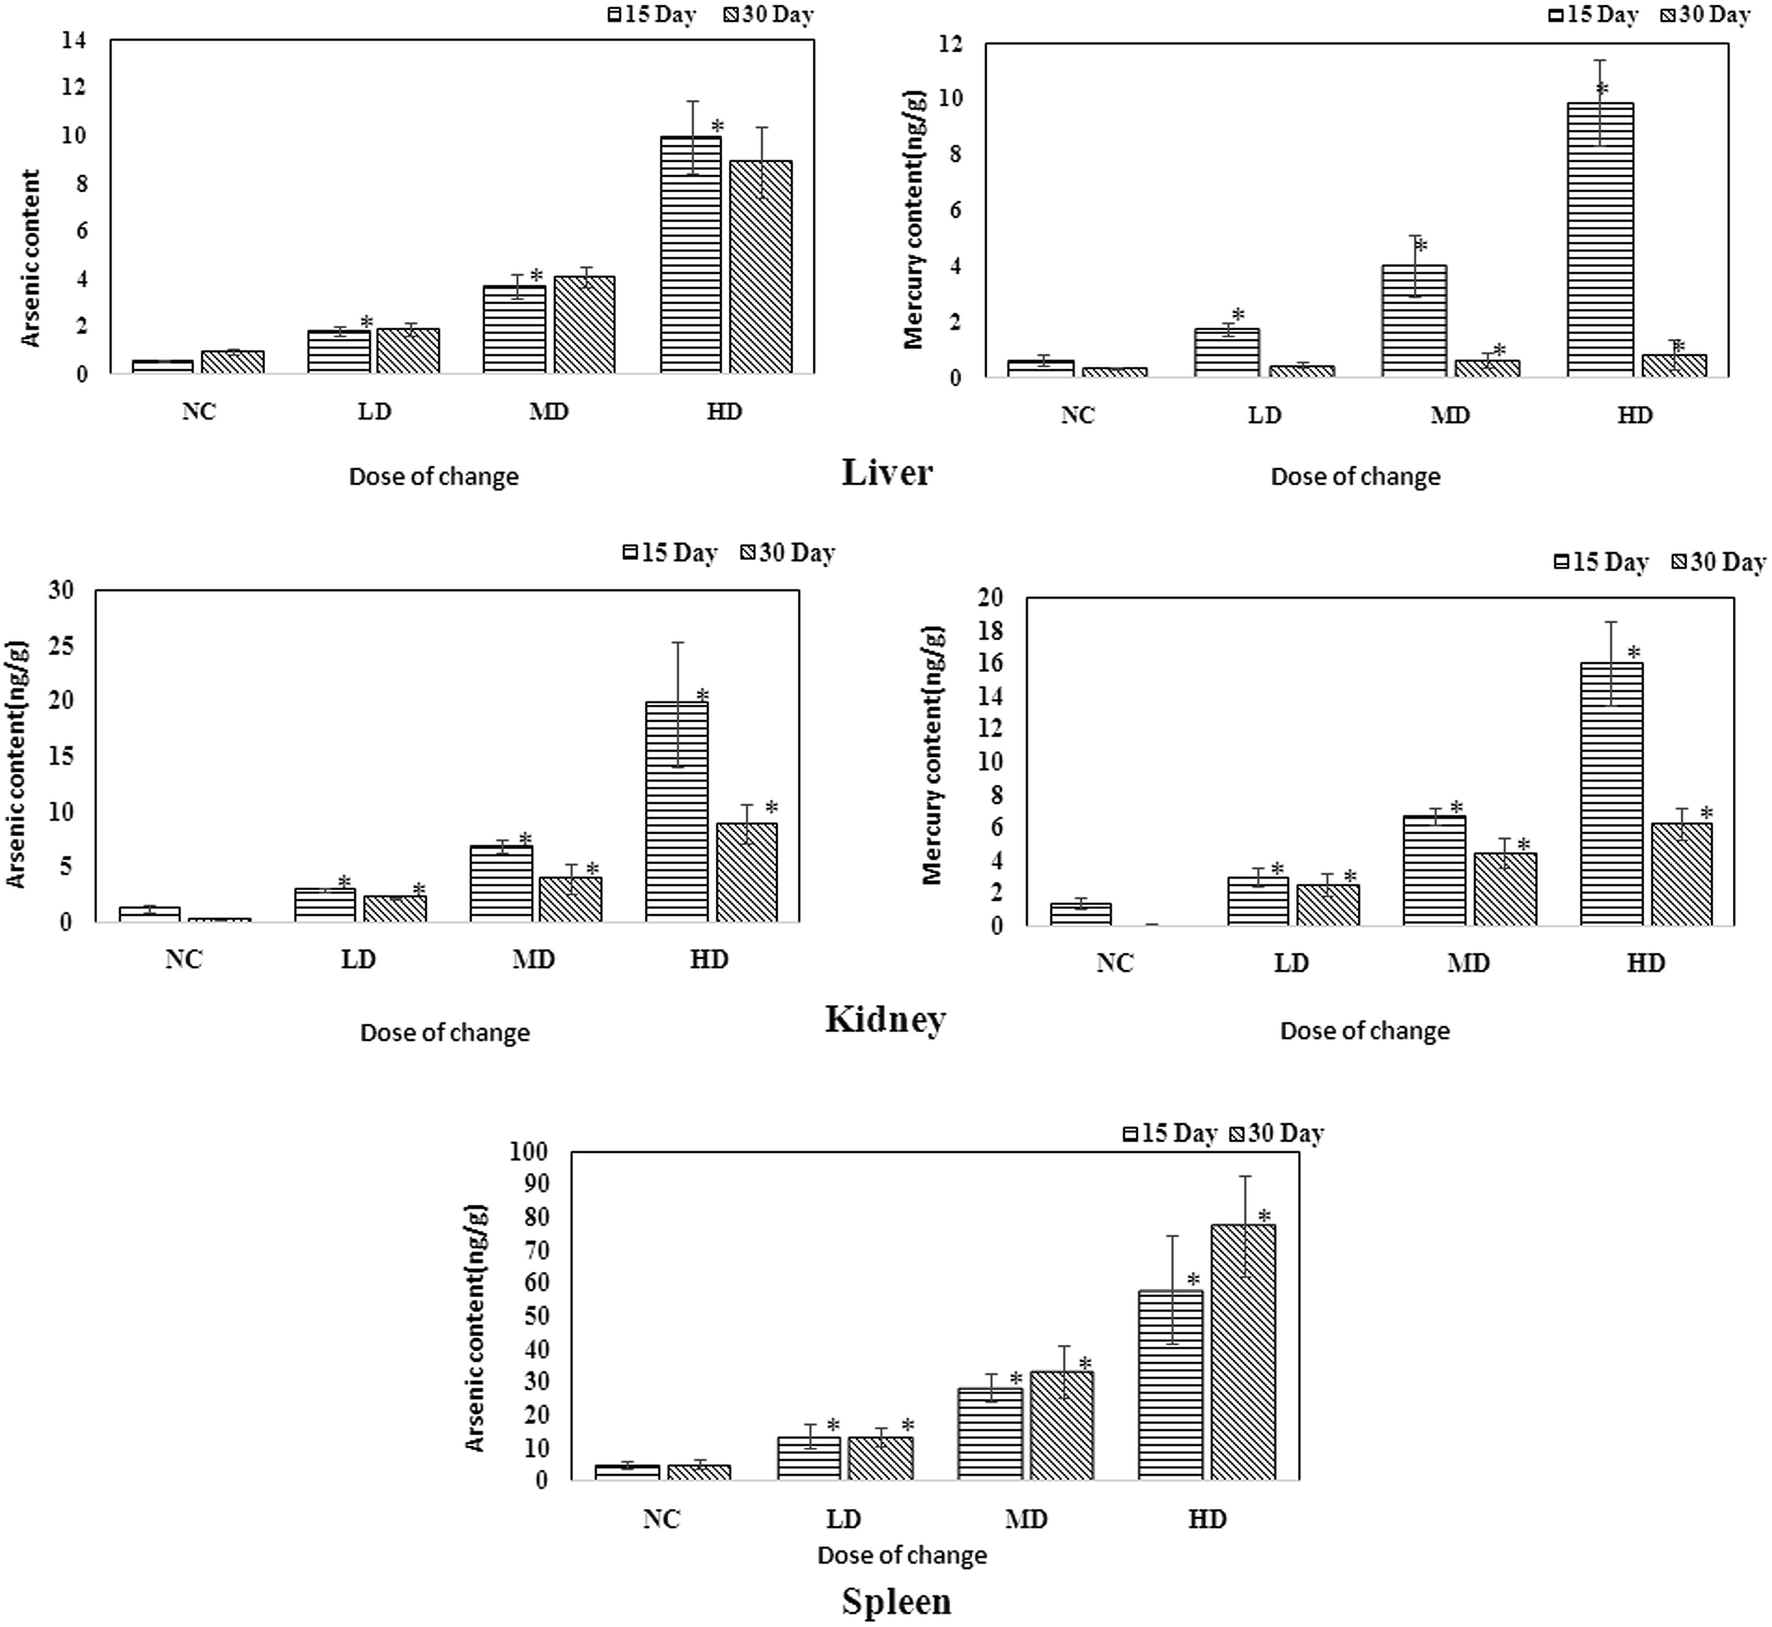 | ||
| Fig. 7 Content of As and Hg in the liver, kidney and spleen samples of rats administered with various RQCJ doses. *P < 0.05 versus control group. | ||
4. Discussion
In this study, we combined the NMR-based metabolomics approach with histopathological examination, biochemical assays and ICP-MS. The significant level increases for the blood AST and ALT confirmed the hepatic injuries observed in histopathological. Blood BUN is one of the most frequently reliable biomarkers of kidney injury. The slightly decrease could be observed in dosed group, which may not obviously reveal the pathological changes in kidney, but the histopathological examination showed severe epithelial necrosis which more intuitively proved the kidney damage. Moreover, the multivariate analysis of NMR metabolomic profiles and ICP-MS disclosed that RQCJ not only disturbed the function of cell membranes but also have an influence on the immune system.Base on HMDB and KEGG pathway database (http://www.genome.jp/kegg/), the schematic representation of the metabolic networks was shown in Fig. 8.
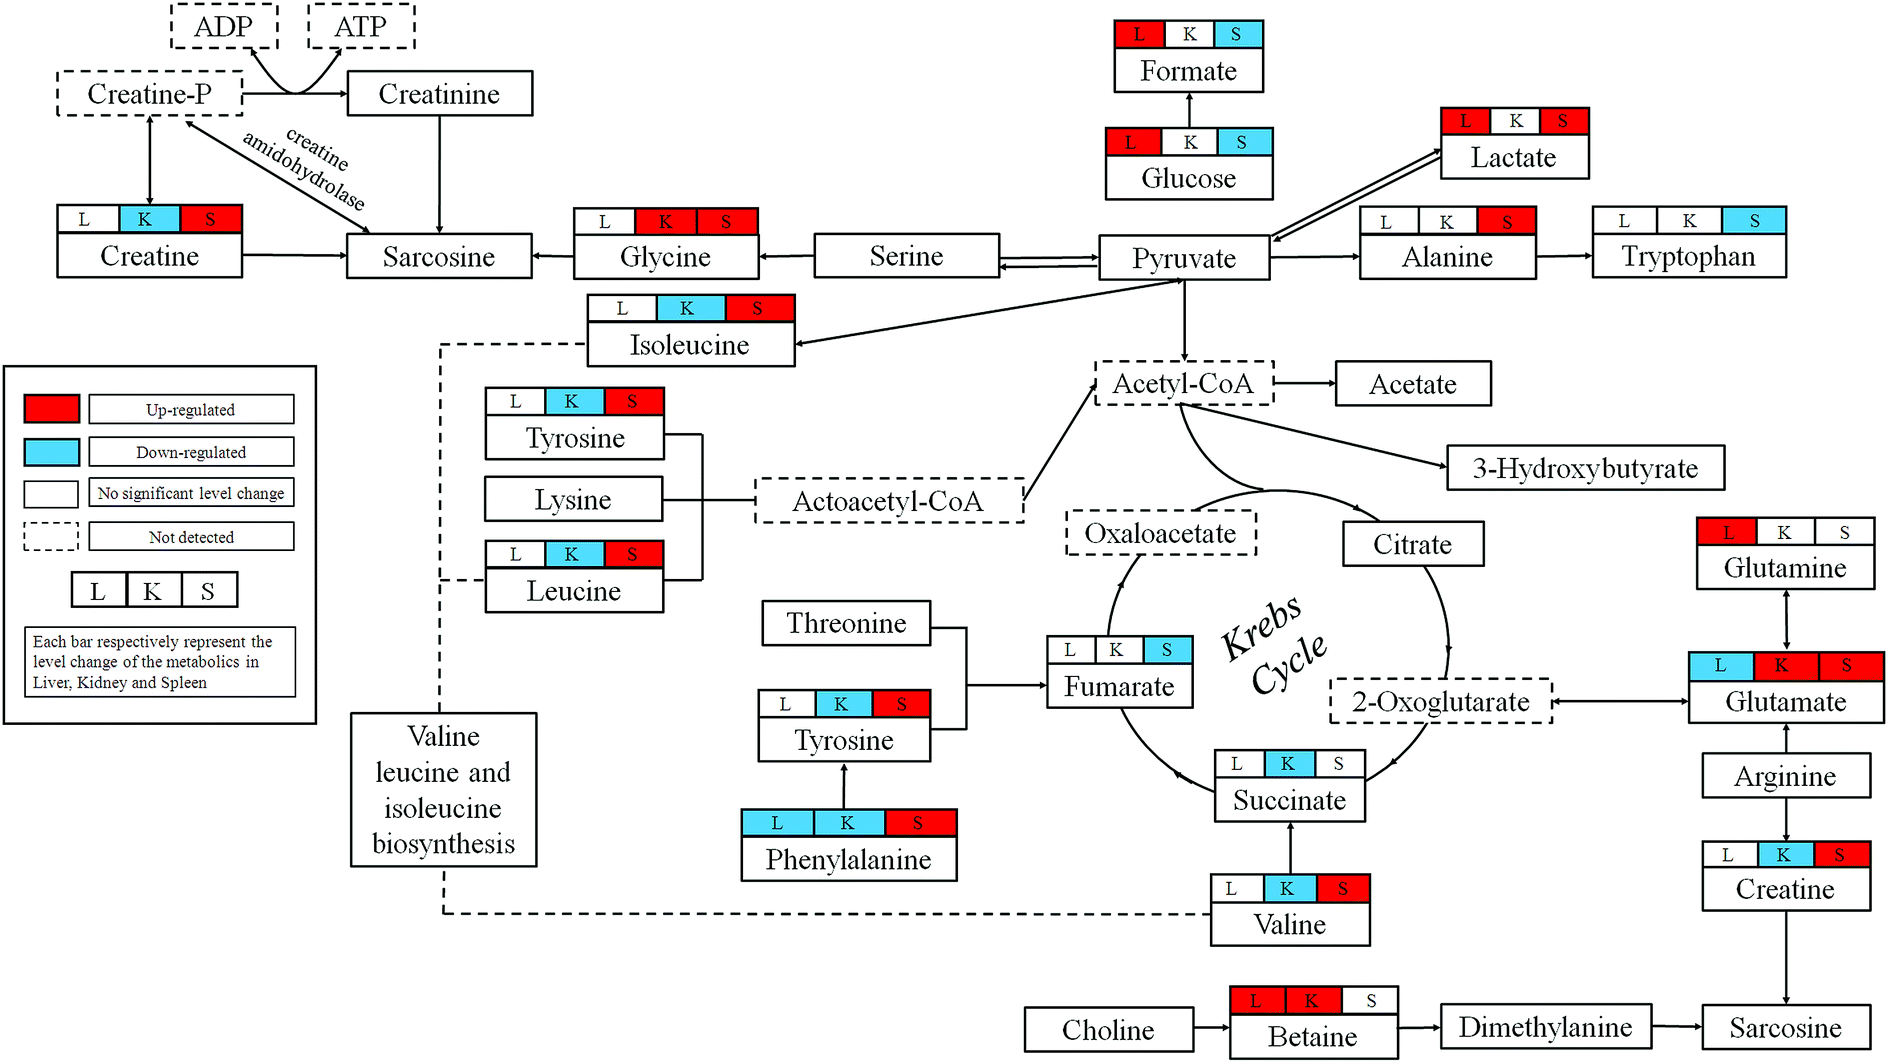 | ||
| Fig. 8 Schematic diagram of the metabolic pathways perturbed by RQCJ obtained from NMR analysis and their interrelationships. Metabolites with superscript “L” mean that levels of metabolites from liver tissue were changed significantly; “K” mean that levels of metabolites from kidney tissue were changed significantly; “S” mean that levels of metabolites from spleen were changed significantly. | ||
4.1 RQCJ-induced metabolic alterations in rat liver
Liver is the chief and essential organ for metabolism and detoxification of xenobiotics in mammals. Glutamate is the precursor required for the production of the major natural antioxidant glutathione (GSH).18 Decreased levels of glutamate and increased levels of glutamine were found in liver of RQCJ-administrated rats. Glutamine could be utilized directly by the liver to produce glutathione. Due to oxidative stress caused by the arsenic in RQCJ, glutamate and glutamine were demonstrated to combat the oxidative injury by producing GSH.21 The result of ICP-MS showed an obvious increase of As concentration in dosed group rats, which also supported this conclusion.Betaine is an organic osmolyte in biological systems, which plays a key role in one of the methionine recycling pathways in the liver22 and protects the body against osmotic stress.20 Oxidation of choline to betaine occurs mainly in the mitochondria of liver cells via a series of enzymes. According to previous reports, increase of betaine may suggest a disturbance in the transmethylation pathway.23,24 Also, betaine has shown hepatoprotective effects against oxidative stress;25 hence, the up-regulation of betaine could be a compensatory response.
Significantly increased glucose levels in the RQCJ treated groups at day 15, especially in HD group, suggests that the gluconeogenic pathway26 has been disturbed. Reduced glycolysis and enhanced glycogenesis and gluconeogenesis imply that the energy consumption was redirected to lipid oxidation.27
4.2 RQCJ-induced metabolic alterations in rat kidney
Alteration of renal amino acids including elevated levels of glycine and depleted levels of branched-chain amino acids (BACCs), asparagine, lysine and methionine was observed. Amino acids form the basic units for protein synthesis in living organisms. Increasing evidences have shown that renal injury is highly associated with abnormality in protein expression and amino acid reabsorption.28 The alteration in amino acid levels probably represent structural damage of membrane protein in kidney induced by RQCJ and BCAAs were utilized to repair the membrane protein structure by synthesis of necessary proteins.29Methionine is an essential amino acid required for the synthesis of cysteine and forms homocysteine through a demethylation reaction. Homocysteine is a well-established biomarker of renal function; its high concentration in kidney tissues is the sign of deteriorating renal function.30 Meanwhile, significant decrease of methionine suggests renal damage.28
Phenylalanine is an essential amino acid obtained from food and tyrosine is a semi-essential amino acid, which can only be synthesized by the hydroxylation of phenylalanine catalyzed by phenylalanine hydroxylase (PAH).31 Because of the affected nutrition absorption induced by RQCJ, the phenylalanine metabolism seems to have been disturbed. Increased phenylalanine and decreased tyrosine detected in HD group rats implied inhibition of PAH, which is generally observed during chronic kidney failure.32
Taurine is an important intracellular free β-amino acid in most mammalian tissues with a number of important physiological roles including antioxidation, osmoregulation, and bile acid conjugations. Through a myriad of these activities, taurine has exhibited protective function against various tissue damages.33 Therefore, the increase of renal taurine level observed here is likely to be associated with RQCJ-caused oxidative stress on the kidney.34 The decreased level of renal uridine in the rats treated with RQCJ could be ascribed to the elevated purine and pyrimidine catabolism in the kidney as an antioxidant effect.18
4.3 RQCJ-induced metabolic alterations in rat spleen
In our study, the HD rats showed a significant decrease of spleen glucose and increase of lactate indicating that RQCJ could aggravate anaerobic metabolism. The energy supply pattern shifted from aerobic to anaerobic metabolism.35 The TCA cycle, the start and end of many metabolic pathways, plays a crucial role in energy metabolism. Succinate and fumarate are vital intermediates of the TCA cycle, the reduction of which restricts TCA often resulting in nonspecific toxic effects.35 The identified biomarkers such as aspartate, asparagine, glutamate and glutamine were all involved in the alanine, aspartate and glutamate metabolism pathway.36 Up-regulation of glutamine and down-regulation of glutamate suggested that the pathway had been blocked. Therefore, increase of asparagine and decrease of aspartate led to a decrease of taurine. The decrease of spleen taurine level is probably associated with RQCJ-caused oxidative stress since taurine can function as an antioxidant with protective functions against injury.8,33Influenced by the heavy metals in RQCJ,37 an increased level of phenylalanine and decreased level of tyrosine was also observed in spleen similar to the trend in kidney tissue. Furthermore, the increased hypoxanthine and decreased uracil indicated that nucleotide catabolism had been disturbed by the oxidative stress. The increased level of alanine may also be because of the oxidative-stress-induced changes in energy expenditure.38
After a 15 day recovery, the disturbed pathways in both liver and kidney showed some obvious improvement. However, instead of recovering, metabolic changes in the spleen tissue presented a small increment. As we know, spleen plays important roles in the immune system acting as the primary defense against all types of antigens that appear in circulation. The levels of glutamine were significantly increased in spleen even on the 30th day. Glutamine is utilized at high rates by cells of the immune system when the immune system is activated i.e. spleen promotes the usage of glutamine to produce glutathione.39,40 Hence, it seems that even after the withdrawal period, spleen did not recover from the damage caused by RQCJ.
5. Conclusions
In summary, our results from this study show that RQCJ might be associated with perturbation of a variety of metabolic pathways. These findings indicate that RQCJ may induce short-term and reversible injuries in liver and kidney. On the other hand, toxicity effects of RQCJ are more severe on spleen than those on liver and kidney as seen from significantly altered metabolites, which did not improve within the 15 days recovery period. This study presents a comprehensive evaluation of the systemic response to the chronic toxicity of RQCJ and provides guidance to doctors on the use of RQCJ in clinical practice.Conflicts of interest
The authors declare that there are no conflicts of interest.Acknowledgements
We acknowledge the financial supports from the National Natural Science Foundation of China (81573832, 81773960), Beijing Municipal Natural Science Foundation (8153036), and Qinghai Province Applied Fundamental Research (2018-ZJ-708).References
- Z. L. Zhao, G. Dorje and Z. T. Wang, J. Ethnopharmacol., 2010, 132, 122–126 CrossRef CAS PubMed.
- C. Li, D. Wang, J. Duo, L. Duojie, X. Chen, Y. Du, H. Yang, Z. Zheng and M. YU, China J. Chin. Mater. Med., 2014, 39, 2573–2582 Search PubMed.
- Z. Y. Zheng, Y. Z. Du, M. Zhang, M. J. Yu, C. Li, H. X. Yang, J. Zhao, Z. H. Xia and L. X. Wei, Spectrosc. Spectral Anal., 2015, 35, 1037–1042 CAS.
- W. Sheng, Z. Dehao, Z. Kesheng and X. Ling, Tradit. Chin. Drug Res. Clin. Pharmacol., 2015, 26, 52–56 Search PubMed.
- J. K. Nicholson, J. Connelly, J. C. Lindon and E. Holmes, Nat. Rev. Drug Discovery, 2002, 1, 153–161 CrossRef CAS PubMed.
- A. Tieu, A. S. Kucey, A. Hennop, B. L. Urquhart, D. A. Feere, L. E. Mccuaig, M. A. Kerr, P. Kyriacou, S. E. Nevison and T. J. Velenosi, Sci. Rep., 2016, 6, 22526 CrossRef PubMed.
- N. Tian, J. Wang, P. Wang, X. Song, M. Yang and L. Kong, Metabolomics, 2013, 9, 1228–1242 CrossRef CAS.
- L. Jiang, J. Huang, Y. Wang and H. Tang, J. Proteome Res., 2012, 11, 3848–3859 CrossRef CAS PubMed.
- J. K. Nicholson and I. D. Wilson, Prog. Nucl. Magn. Reson. Spectrosc., 1989, 21, 449–501 CrossRef CAS.
- O. Beckonert, H. C. Keun, T. M. Ebbels, J. Bundy, E. Holmes, J. C. Lindon and J. K. Nicholson, Nat. Protoc., 2007, 2, 2692–2703 CrossRef CAS PubMed.
- B. Shi, J. Tian, H. Xiang, X. Guo, L. Zhang, G. Du and X. Qin, Behav. Brain Res., 2013, 241, 86–91 CrossRef CAS PubMed.
- P. Guo, D. Wei, J. Wang, G. Dong, Q. Zhang, M. H. Yang and L. Y. Kong, RSC Adv., 2015, 5, 27018–27028 RSC.
- Q. Huang, Y. Tan, P. Yin, G. Ye, P. Gao, X. Lu, H. Wang and G. Xu, Cancer Res., 2013, 73, 4992–5002 CrossRef CAS PubMed.
- Q. Y. Niu, Z. Y. Li, G. H. Du and X. M. Qin, J. Pharm. Biomed. Anal., 2015, 118, 338–348 CrossRef PubMed.
- C. Xu, C. Rezeng, J. Li, L. Zhang, Y. Yan, J. Gao, Y. Wang, Z. Li and J. Chen, Front. Pharmacol., 2017, 8, 602 CrossRef PubMed.
- S. Liao, P. Li, J. Wang, Q. Zhang, D. Xu, M. Yang and L. Kong, Toxicol. Res., 2016, 5 RSC.
- Z. Li, A. Li, J. Gao, H. Li and X. Qin, Front. Pharmacol., 2016, 7, 307 Search PubMed.
- P. Guo, D. Wei, J. Wang, G. Dong, Q. Zhang, M. Yang and L. Kong, RSC Adv., 2015, 5, 27018–27028 RSC.
- J. A. Kim, H. J. Choi, Y. K. Kwon, D. H. Ryu, T. H. Kwon and G. S. Hwang, PLoS One, 2014, 9, e85445 CrossRef PubMed.
- A.-P. Li, Z.-Y. Li, H.-F. Sun, K. Li, X.-M. Qin and G.-H. Du, J. Proteome Res., 2015, 14, 2005–2016 CrossRef CAS PubMed.
- T. Huo, Y. Fang, L. Zhao, Z. Xiong, Y. Zhang, Y. Wang, C. Feng, M. Yuan, S. Wang, M. Chen and H. Jiang, J. Ethnopharmacol., 2016, 192, 1–9 CrossRef CAS PubMed.
- F. Tranchida, Z. Rakotoniaina, L. Shintu, L. Tchiakpe, V. Deyris, M. Yemloul, P. Stocker, N. Vidal, O. Rimet, A. Hiol and S. Caldarelli, Sci. Rep., 2017, 7, 5880 CrossRef PubMed.
- S. A. S. Craig, Am. J. Clin. Nutr., 2004, 80, 539–549 CrossRef CAS PubMed.
- A. Zira, S. Kostidis, S. Theocharis, F. Sigala, S. B. Engelsen, I. Andreadou and E. Mikros, Toxicology, 2013, 303, 115–124 CrossRef CAS PubMed.
- T. Murakami, Y. Nagamura and K. Hirano, J. Nutr. Sci. Vitaminol., 1998, 44, 249–255 CrossRef CAS PubMed.
- E. JH and P. CR, J. Biol. Chem., 1967, 242, 2622–2636 Search PubMed.
- Q. Wu, Q. Zhang, B. Sun, X. Yan, Y. Tang, X. Qiao, Q. Chen, S. Yu and F. Liang, J. Pharm. Biomed. Anal., 2010, 51, 698–704 CrossRef CAS PubMed.
- J. Ji, P. Zhu, F. Cui, F. Pi, Y. Zhang and X. Sun, Chemosphere, 2017, 180, 267–274 CrossRef CAS PubMed.
- H. D. Xu, J. S. Wang, M. H. Li, Y. Liu, T. Chen and A. Q. Jia, Chemosphere, 2015, 159, 69–80 CAS.
- H. K. Amin, M. I. El-Sayed and O. F. Leheta, Renal Failure, 2016, 38, 1267–1275 CrossRef CAS PubMed.
- B. Brown, Biochem. Educ., 1992, 20, 186 CrossRef.
- J. D. Kopple, J. Nutr., 2007, 137, 1586S–1590S CrossRef CAS PubMed.
- R. J. Huxtable, Physiol. Rev., 1992, 72, 101–163 CrossRef CAS PubMed.
- G. Y. Oudit, M. G. Trivieri, N. Khaper, T. Husain, G. J. Wilson, P. Liu, M. J. Sole and P. H. Backx, Circulation, 2004, 109, 1877–1885 CrossRef CAS PubMed.
- Z. Guan, J. Wu, C. Wang, F. Zhang, Y. Wang, M. Wang, M. Zhao and C. Zhao, J. Ethnopharmacol., 2017, 210, 179–191 CrossRef PubMed.
- M. M. Abdeldaim and A. Abdeen, Food Chem. Toxicol., 2018, 114, 69–77 CrossRef CAS PubMed.
- M. Mahboob, K. Shireen, A. Atkinson and A. Khan, J. Environ. Sci. Health, Part B, 2001, 36, 687–697 CrossRef CAS PubMed.
- L. Jiang, J. Huang, Y. Wang and H. Tang, Phys. Rev. A, 2012, 86, 1354–1362 Search PubMed.
- E. A. Newsholme, B. Crabtree and M. S. Ardawi, Q. J. Exp. Physiol., 1985, 70, 473–489 CrossRef CAS PubMed.
- R. D. Griffiths and C. Esanu-Varnav, Glutamine-supplemented Parenteral Nutrition, Springer Berlin Heidelberg, 1999, pp. 195–211 Search PubMed.
Footnotes |
| † Electronic supplementary information (ESI) available. See DOI: 10.1039/c8ra07058j |
| ‡ Can Xu, Yingfeng Wang, and Caidan Rezeng contributed equally to this work. |
| This journal is © The Royal Society of Chemistry 2018 |