DOI:
10.1039/C8RA07011C
(Paper)
RSC Adv., 2018,
8, 35271-35279
Significantly enhanced photoluminescence and thermal stability of La3Si8N11O4:Ce3+,Tb3+ via the Ce3+ → Tb3+ energy transfer: a blue-green phosphor for ultraviolet LEDs†
Received
21st August 2018
, Accepted 21st September 2018
First published on 15th October 2018
Abstract
A series of Ce3+-, Tb3+- and Ce3+/Tb3+-doped La3Si8N11O4 phosphors were synthesized by gas-pressure sintering (GPS). The energy transfer between Ce3+ and Tb3+ occurred in the co-doped samples, leading to a tunable emission color from blue to green under the 360 nm excitation. The energy transfer mechanism was controlled by the dipole–dipole interaction. The Ce3+/Tb3+ co-doped sample had an external quantum efficiency of 46.7%, about 5.6 times higher than the Tb-doped La3Si8N11O4 phosphor (8.3%). The thermal quenching of the Tb3+ emission in La3Si8N11O4:Tb,Ce was greatly reduced from 74 to 30% at 250 °C, owing to the energy transfer from Ce3+ to Tb3+. The blue-green La3Si8N11O4:0.01Ce,0.05Tb phosphor was testified to fabricate a warm white LED that showed a high color rendering index of 90.2 and a correlated color temperature of 3570 K. The results suggested that the co-doped La3Si8N11O4:Ce,Tb phosphor could be a potential blue-green down-conversion luminescent material for use in UV-LED pumped wLEDs.
1 Introduction
In recent years, white light-emitting diodes (w-LEDs) have drawn much attention due to their advantages over conventional lighting technologies, such as high efficiency, energy saving, environmental friendliness, compactness and longevity.1–10 There are two common approaches to generate white light from LEDs.11–13 The first one is to combine monochromatic blue, green and red LED chips to create white light. This method allows the production of high luminous efficacy but it also requires a complicated feedback electronic control which limits its application. The second one is to pump phosphor(s) with a blue, UV or near-UV LED chip (also called phosphor-converted w-LEDs), which promises cost effectiveness and ease of fabrication. Compared to the dichromatic wLEDs using the combination of a blue LED chip and a yellow-emitting phosphor (e.g., YAG:Ce3+), multi-phosphor-converted wLEDs driven by an UV LED chip enable to provide a super-high color rendering index (CRI > 90) and the excellent quality of light that can be widely used in supermarkets, surgical operations, museums, etc.14–20 To realize this, highly efficient and thermally stable red, green and blue phosphors that can be excited by UV light are required.21–24
To develop green or green-to-blue emitting phosphors for such applications, one of the strategies is to co-dope Ce3+ and Tb3+ in one phosphor host, and to apply the energy transfer between Ce3+ and Tb3+ to realize the tunable color and enhanced photoluminescence properties.25–28 For example, Wang et al. reported a novel blue-green emitting phosphor NaBaScSi2O7:Ce3+,Tb3+ with an internal quantum efficiency (IQE) of 36%.29 Xiao et al. addressed that the green emission of Tb3+ in Ba2Y5B5O17:Ce3+,Tb3+ at 423 K could remain 92% of its intensity at room temperature.30 Du et al. found that in the blue-green emitting phosphor LaSi3N5:0.09Ce3+,0.12Tb3+ the Tb3+ luminescence had a higher thermal stability than the Ce3+ luminescence at 423 K (∼90% vs. ∼70% of the initial luminescence).31 Zhang et al. investigated the green phosphor LaOBr:Ce3+,Tb3+, and observed that the green emission at 433 K could maintain 90–100% of its intensity at room-temperature.32
Among the huge number of luminescent materials for wLEDs, the rare-earth doped (oxy)nitride phosphors have drawn much attention due to their abundant emission color, high conversion efficiency and small thermal quenching.33–45 Eu2+ and Ce3+ are the mostly used activators in (oxy)nitride phosphors, leading to a variety of interesting luminescent materials for white LEDs, such as α-sialon:Eu2+, β-sialon:Eu2+, CaAlSiN3:Eu2+, Sr[LiAl3N4]:Eu2+, La3Si6N11:Ce3+, and etc.46–50 On the other hand, to the best of our knowledge, there are very limited investigations on co-doped (oxy)nitride phosphors. Liu et al. reported the greatly enhanced luminescence in γ-alon:Mn2+ by co-doping Eu2+, which enables to a promising green phosphor for near-UV LEDs.51 Song et al. realized the tunable emission colors in Eu2+ and Ce3+ co-doped SrSi2O2N2 via the energy transfer between Eu2+ and Ce3+.52 Therefore, it has great opportunities to develop (oxy)nitride phosphors with enhanced photoluminescence properties by realizing the efficient energy transfer in them.
La3Si8N11O4 is a good host for Ce3+ or Eu2+ that has intense blue emissions under the UV excitation.3,53 Moreover, La3Si8N11O4:Ce3+ also shows smaller thermal quenching than other phosphors in system La–Si–N–O–Ce.54 In this work, we attempt to investigate the photoluminescence of Ce3+ and Tb3+ co-doped La3Si8N11O4, and to apply the energy transfer strategy to enhance photoluminescence properties of La3Si8N11O4:Ce3+,Tb3+. The photoluminescence properties and the energy transfer mechanism of the co-doped materials will be investigated and discussed.
2 Experimental
A series of Ce3+-, Tb3+-, and Ce3+/Tb3+-doped La3Si8N11O4 (La3Si8N11O4:yCe, xTb, y = 0–0.15, x = 0–0.30) powder samples were synthesized via the high temperature solid-state reaction method. α-Si3N4 (SN-E10, Ube Industries, Tokyo, Japan), LaN (laboratory made), La2O3 (Shin-Etsu Chemical Co., Tokyo, Japan), CeN (laboratory made) and TbN (laboratory made) were thoroughly mixed with mortar and pestle for 15 min in a nitrogen-field glovebox (H2O < 1 ppm, O2 < 1 ppm). The powders were put into BN crucibles and fired at 1800 °C for 2 h under 1.0 MPa nitrogen atmosphere. After firing, the samples were gradually cooled to room temperature in the furnace under the N2 protection. Finally, the fired powders were finely ground using a mortar for further measurements.
The crystalline phase of the synthesized samples was collected on an X-ray diffraction (XRD, Smart Lab, Rigaku, Tokyo, Japan) operating at 40 kV and 40 mA and using Cuα1 radiation (λ = 1.54056 Å). A step size of 0.02° with a scan speed of 10° per minute over the 2θ range 5–80°.
Energy-dispersive X-ray spectroscopy (EDS) and mapping measurements of the cross-section particles were carried out at room temperature with a Hitachi SU-8000 scanning microscope at an accelerating voltage of 5 kV. SEM and cathodoluminescence (CL) measurements were performed using a field emission scanning electron microscope (SEM, Hitachi S4300, Tokyo, Japan) equipped with a CL system (Horiba MP32S/M, Horiba, Tokyo, Japan).
High-resolution transmission electron microscopy (TEM) images and the EDS mapping were recorded using a JEM-3100FEF electron microscope (JEOL, Tokyo, Japan) fitted with the field emission gun at accelerating voltage of 300 kV.
Photoluminescence spectra at room temperature were analyzed with a Hitachi F-4500 spectrophotometer equipped with a Xe lamp. The diffuse reflectance spectra were measured with a UV-vis spectrophotometer (Ubest V560, Jasco, Tokyo, Japan), using a Spectralon diffusive white standard for calibration.
The fluorescence lifetime measurement was taken on a time-correlated single-photon counting fluorometer (TemPro, Horiba Jobin-Yvon, Tokyo, Japan) equipped with a NanoLED-370 nm with a pulse duration full width at half-maximum of ∼1 ns.
The temperature-dependent photoluminescence was measured in the range of 25–250 °C with a multichannel Photal MCPD-7000 detector, using a Xe lamp as an excitation source. The quantum efficiency (QE) measurements were done using a multichannel spectrometer (MCPD-7000, Otsuka Electronics, Tokyo, Japan), with a Xe lamp as an excitation source, and the @BaSiO4 white standard was used for calibration. The external (η0) and internal (ηi) QEs were calculated according to the following equations:55
where
E(
λ)/
hv,
E(
λ)/
hv and
E(
λ)/
hv are the number of photons in the excitation, reflectance and emission spectra of the phosphor sample, respectively.
A white LED was fabricated by using a UV-LED chip (365 nm) and La3Si8N11O4:0.01Ce,0.05Tb (blue-green), SrSi2N2O2:Eu (green) and Sr2Si5N8:Eu (red) phosphors. The optical properties of the white LED were measured using an integrated sphere spectroradiometer system (LHS-1000, Everfine Co., Hangzhou, China). The operated current and voltage were 300 mA and 3.756 V, respectively.
3 Results and discussion
3.1 Phase identification
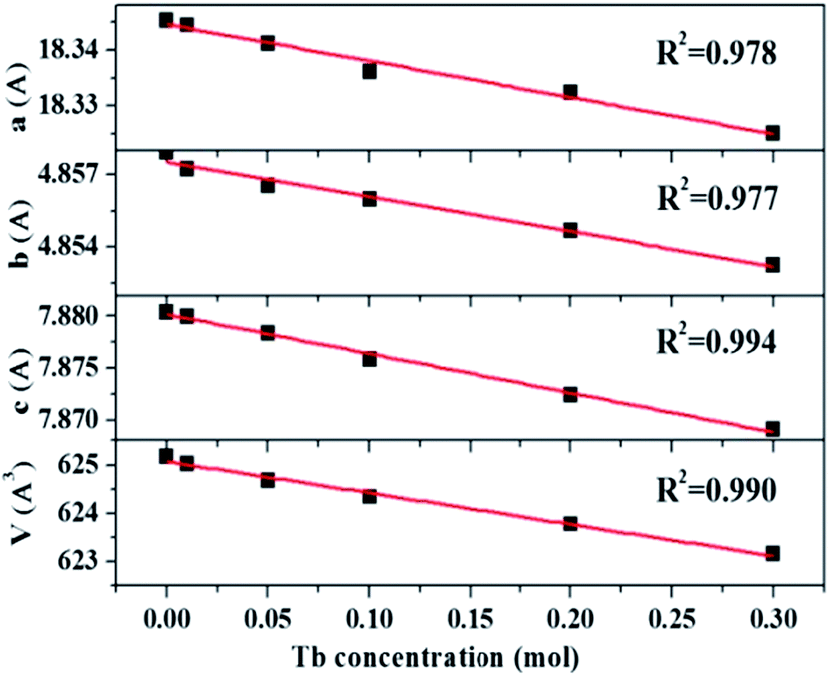
The XRD patterns of La3Si8N11O4:1%Ce,xTb doped with varying Tb3+ concentrations (x = 0–0.3) are shown in Fig. 1. All the diffraction peaks of the selected samples agree well with the standard data of La3Si8N11O4 (JCPDS card #48-1597), and no impurity phase is identified. It indicates that the doping of Ce and Tb does not change the phase purity of the La3Si8N11O4 host. Moreover, the lattice parameters of samples decrease with increasing the Tb concentration (x), as seen in Fig. 2. As reported by Grins et al., La3Si8N11O4 has two different La sites, with La1 being coordinated by 4 O/N and 2 O atoms and La2 atom coordinated by 5 O/N, 2 O and 1 N atoms (Fig. 1b).56 According to the effective ionic radius of cations with varying coordination numbers (CN), the radius of both Ce3+ and Tb3+ is smaller than that of La3+, as is listed in Table S1.†57 Therefore, when La3+ is partially replaced by Ce3+ and Tb3+ ions, the lattice parameters and the cell volume of the substituted samples will shrink to some extent, which is in line with the reduction of the lattice parameters.
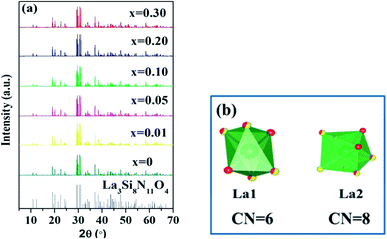 |
| | Fig. 1 XRD patterns of (a) La3Si8N11O4:0.01Ce,xTb (x = 0–0.3) and (b) the coordination environment of La1 and La2 in the La3Si8N11O4 host. | |
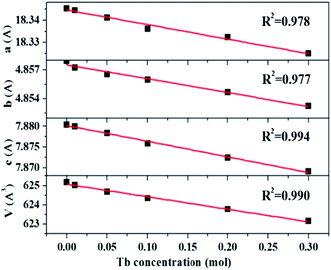 |
| | Fig. 2 Lattice parameters (a, b and c) and volume (V) of La3Si8N11O4:0.01Ce,xTb (x = 0–0.3). | |
3.2 SEM and TEM
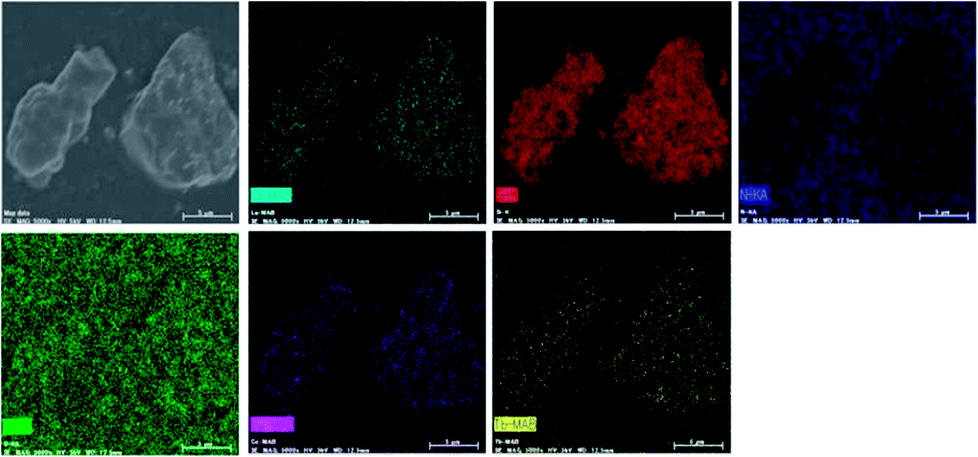
In order to further confirm the composition uniformity of the samples, the SEM and TEM observations of the La3Si8N11O4:0.01Ce,0.2Tb phosphor were carried out, as illustrated in Fig. 3 and 4. The elemental mapping images evidence that La, Si, N, O, Ce and Tb are homogeneously distributed within the phosphor particles, which indicates that both Ce and Tb ions are accommodated in the La3Si8N11O4 lattice. As seen in Fig. 4a and c, Ce and Tb are distributed uniformly in the sample that is well crystallized. The d-spacing of the (11−2) crystal plane is 0.299 and 0.300 nm for La3Si8N11O4:0.01Ce,0.2Tb and La3Si8N11O4, respectively. It further confirms the successful introduction of Ce3+ and Tb3+ into the lattice. The ratio of (La + Ce + Tb)/Si is 0.396, which is close to the theoretical ratio of 0.375 (3![[thin space (1/6-em)]](https://www.rsc.org/images/entities/char_2009.gif) :8), as is shown in Fig. S1.†
:8), as is shown in Fig. S1.†
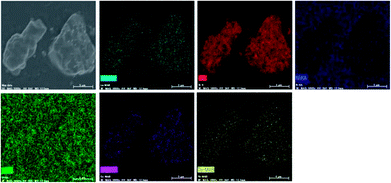 |
| | Fig. 3 SEM image and elemental mapping of La, Si, N, O, Ce, and Tb in La3Si8N11O4:0.01Ce,0.2Tb. | |
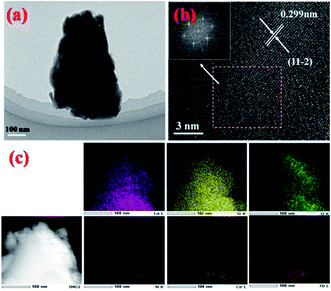 |
| | Fig. 4 (a) TEM image, (b) HRTEM images, and (c) elemental mapping of La3Si8N11O4:0.01Ce,0.2Tb. The inset of (b) shows the fast Fourier transforms of the HRTEM image. | |
3.3 Photoluminescence properties
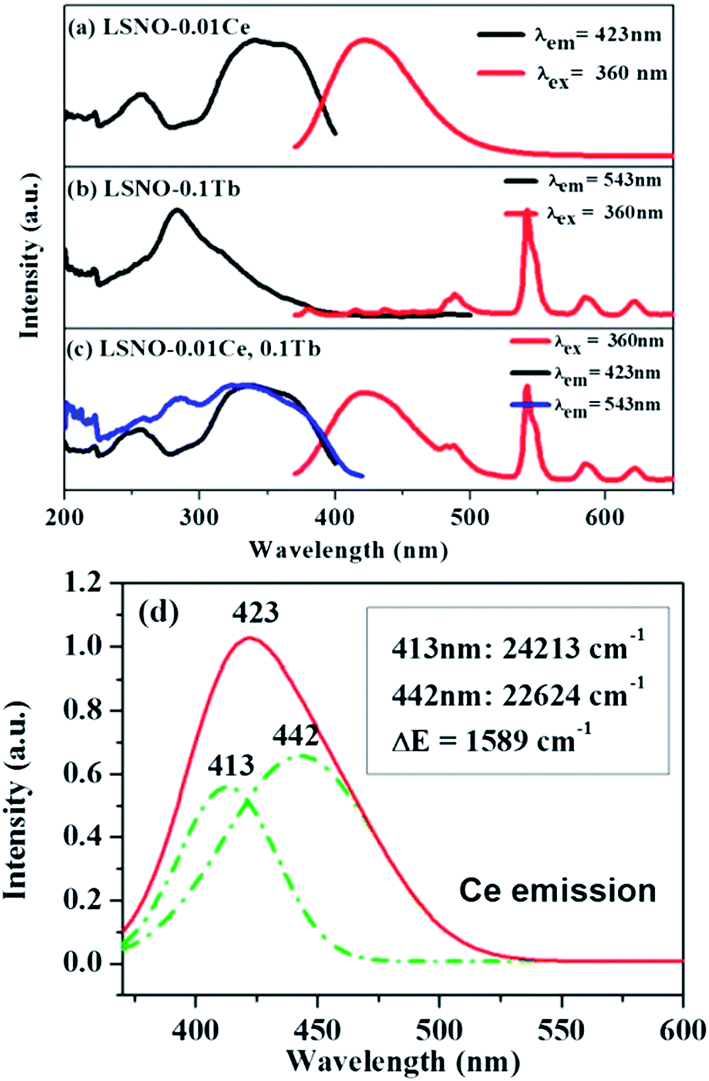
The excitation and emission spectra of single- and co-doped La3Si8N11O4 phosphors are descripted in Fig. 5. As seen in Fig. 5a, the PLE spectrum of La3Si8N11O4:0.01Ce, monitored by 423 nm, consists of three distinct bands centered at 257, 340, and 360 nm, respectively. The strong PLE band at 340–370 nm matches well with the near-UV LED chip, indicating that the phosphor could be used in white LEDs. Under the 360 nm excitation, the phosphor exhibits a broad asymmetric emission band covering the spectral range of 380–500 nm and a maximum emission at 423 nm. The emission is assigned to the 5d → 4f electronic transitions of Ce3+. The emission band can be divided into two sub-bands centered at 413 nm (24213 cm−1) and 442 nm (22624 cm−1) by Gaussian fitting (Fig. 4d). The energy difference between two sub-bands is about 1589 cm−1, which is close to 2000 cm−1 (energy difference between 2F7/2 and 2F5/2 of Ce3+).
 |
| | Fig. 5 PL and PLE of (a) La3Si8N11O4:0.01Ce, (b) La3Si8N11O4:0.05Tb and (c) La3Si8N11O4:0.01Ce,0.05Tb, and (d) Gaussian splitting of the emission spectrum of La3Si8N11O4:0.01Ce. | |
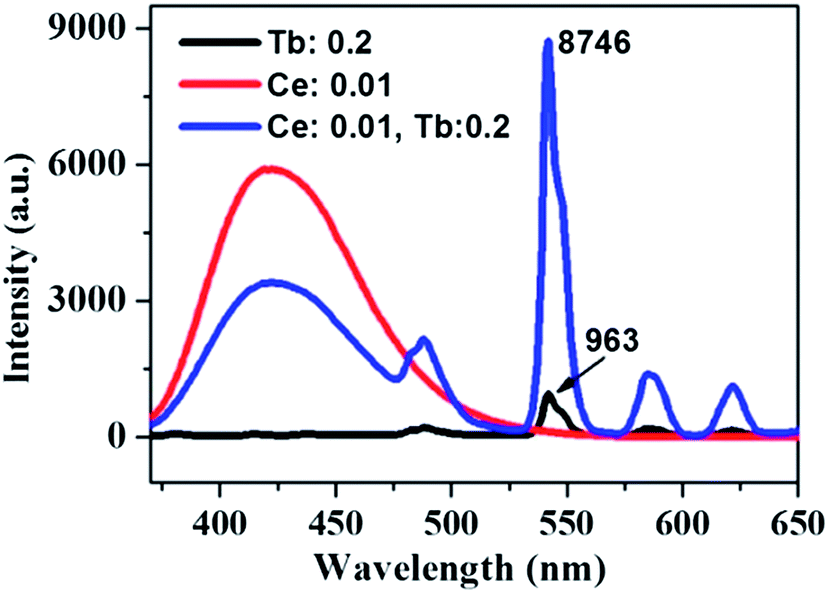
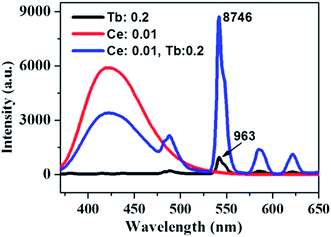
Fig. 5b shows the PL and PLE of the single Tb3+ doped La3Si8N11O4 sample. The emission spectrum consists of several sharp peaks at 489, 543, 580 and 620 nm, which are assigned to the 5D4 → 7FJ (J = 6, 5, 4, 3) transitions of Tb3+, respectively. The excitation spectrum is composed of a strong broad band spanning 200 to 400 nm, and has a maximum at 284 nm and a weak band at ∼480 nm. It corresponds to the f–f electronic transitions of Tb3+. It is clearly shown that there is a great spectral overlap between the emission band of Ce3+ and the excitation band of Tb3+, which indicates the possibility of energy transfer from Ce3+ (sensitizer) to Tb3+ (activator) according to the Dexter theory.58
To confirm the energy transfer between Ce3+ and Tb3+ in La3Si8N11O4, the photoluminescence properties of the co-doped samples were investigated, as shown in Fig. 5c. Clearly, the PLE spectrum monitored at 543 nm of Tb3+ exhibits not only a strong absorption band of Tb3+ in the range of 260–300 nm, but also contains a characteristic excitation band of Ce3+ in the spectral range of 300–400 nm. Additionally, the stronger Tb3+ emission appears under the excitation at 360 nm in the co-doped sample. It implies that the energy transfer from Ce to Tb occurs, and the emission of Tb3+ is significantly enhanced under the near-UV excitation (i.e., 360 nm).
3.4 Cathodoluminescence (CL) spectra and mapping
Compared to PL with the weak excitation energy (photon: 0.5–6 eV), CL has the stronger excitation source (e-beam: 2–300 keV), which thus enables to provide the information of localized luminescence. As shown in Fig. 6, the CL images of La3Si8N11O4:0.01Ce,0.20 Tb, taken at 418 nm (Ce3+) and 544 nm (Tb3+), are quite similar. It indicates that both the Ce3+ and Tb3+ emissions are from the same host lattice. Furthermore, with increasing x value from 0 to 0.20, the 418 nm emission decreases (from 2.01 × 10⁵ to 1.52 × 10⁵ cps), while the 544 nm emission increases (from 0 to 0.58 × 10⁵ cps). This is an evidence of the energy transfer from Ce3+ to Tb3+.
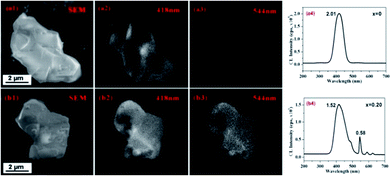 |
| | Fig. 6 SEM images (a1 and b1), CL images taken at 418 nm (a2 and b2) and 544 nm (a3 and b3) and CL spectra (a4 and b4) of La3Si8N11O4:0.01Ce and La3Si8N11O4:0.01Ce,0.20 Tb. | |
3.5 Energy transfer mechanism
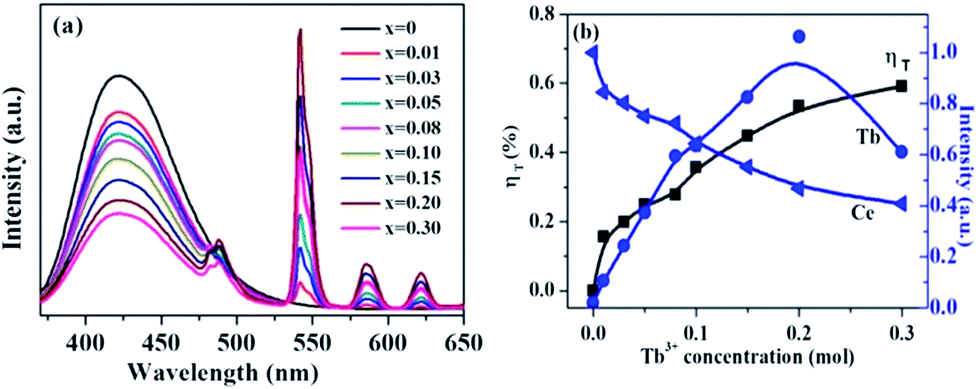
Fig. 7 shows the emission spectra of La3Si8N11O4:0.01Ce,xTb with varying Tb3+ concentrations (x = 0–0.3) under the 360 nm excitation. The PL intensity of Ce3+ decreases whereas the luminescence of Tb3+ at 543 nm increases, which intuitively supports the occurrence of the energy transfer from Ce3+ to Tb3+. The energy transfer efficiency (ηT) can be computed by the following equation:51
where I0 and I are the emission peak intensity of Ce3+ in the absence and presence of Tb3+, respectively. With increasing the Tb3+ doping concentration, the energy transfer efficiency increases and reaches the maximum of 59.1% when the Tb3+ concentration is 0.30, as shown in Fig. 7b.
 |
| | Fig. 7 (a) PL spectra of La3Si8N11O4:0.01Ce,xTb with varying Tb3+ concentrations (x = 0–0.3) under 360 nm excitation, and (b) the normalized peak intensity of the Tb3+ emission at 543 nm and the Ce3+ emission at 423 nm, and the energy transfer efficiency ηT as a function of the Tb concentration. | |
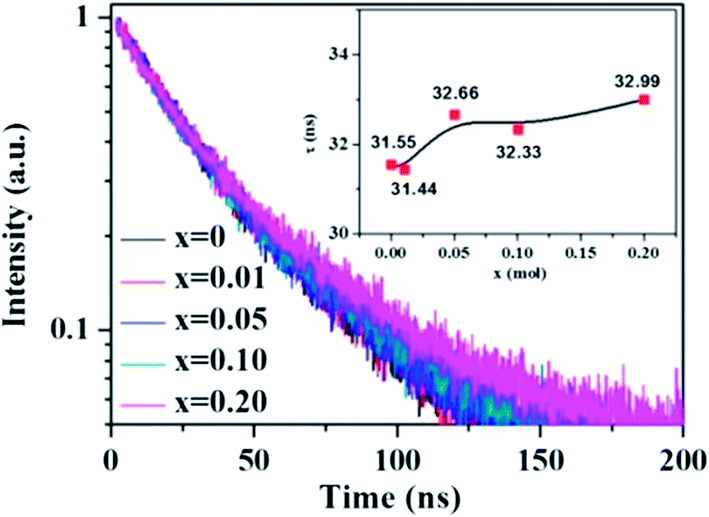
The change of the fluorescence decay time is used to further verify the energy transfer from Ce3+ to Tb3+ in the La3Si8N11O4:0.01Ce,xTb sample. The decay time of the 423 nm emission of Ce3+ nearly keeps unchanged with increasing the Tb3+ concentration, which is different from the change in peak emission intensity, as shown in Fig. 8. The reason for the unobvious change of lifetime and the decrease of emission intensity is that, the energy transfer rate is faster than the radiative transfer rate in the process of the electronic transitions of 5d → 4f of Ce3+ ions, and the fast energy transfer rate can quench the emission intensity while not affect the life time. It is also true in the Ba2Y5B5O17:Ce,Tb phosphor.30
 |
| | Fig. 8 Fluorescence decay curves and decay times of Ce3+ in La3Si8N11O4:0.01Ce,xTb under 370 nm excitation and monitored at 423 nm. | |
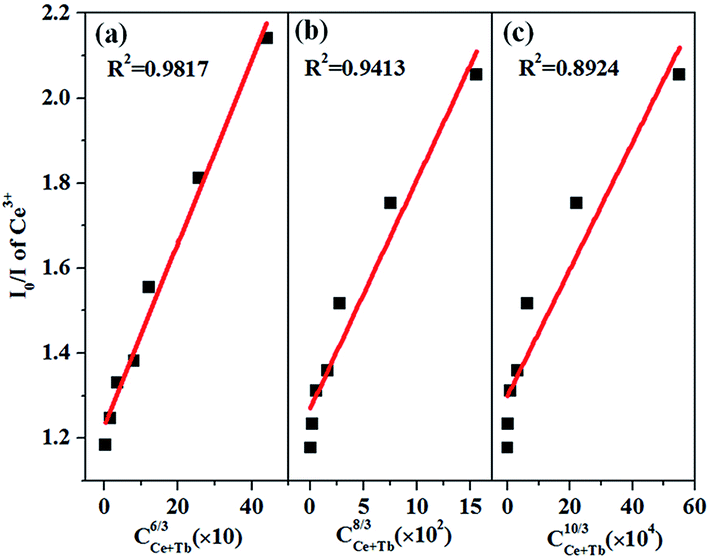
According to the energy transfer theory proposed by Dexter, concentration quenching is due to the energy transfer from one activator to another until an energy sink in the lattice is reached. As put forward by Blasse, the critical distance (RCe–Tb) between Ce3+ and Tb3+ ions can be calculated as below:59
where
N is the number of available sites for the dopant in the unit cell,
V is the volume of the unit cell, and
xc is the total of the concentration of Ce
3+ and Tb
3+ at which the luminescence of Ce
3+ is half compared to the sample containing no Tb
3+ ions. In this work,
N = 24,
V ≈ 1272 Å
3, and
xc = 0.19. Thus, the
RCe–Tb distance is calculated to be about 8.07 Å. It is well known that if the critical distance between sensitizer and activator is much bigger than 4 Å, the energy transfer from Ce
3+ and Tb
3+ mainly takes place
via multipolar interaction rather than exchange interaction.
60 On the basis of the Dexter's energy transfer expression of multipolar interaction and Reisfeld's approximation, the following equation can be given as:
60where
C is the sum of the content of Ce
3+ and Tb
3+. The plots of (
I0/
I)
versus Cn/3 with
n = 6, 8, and 10 correspond to dipole–dipole, dipole-quadrupole, and quadrupole–quadrupole interactions, respectively.
Fig. 9 illustrates the relationships between (
I0/
I)
versus C. A linear relationship is well fitted at
n = 6, which clearly indicates that the energy transfer mechanism is dipole–dipole interaction.
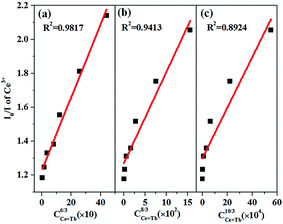 |
| | Fig. 9 Dependence of I0/I of Ce3+ on (a) Cn/3, (b) Cn/3, and (c) Cn/3. | |
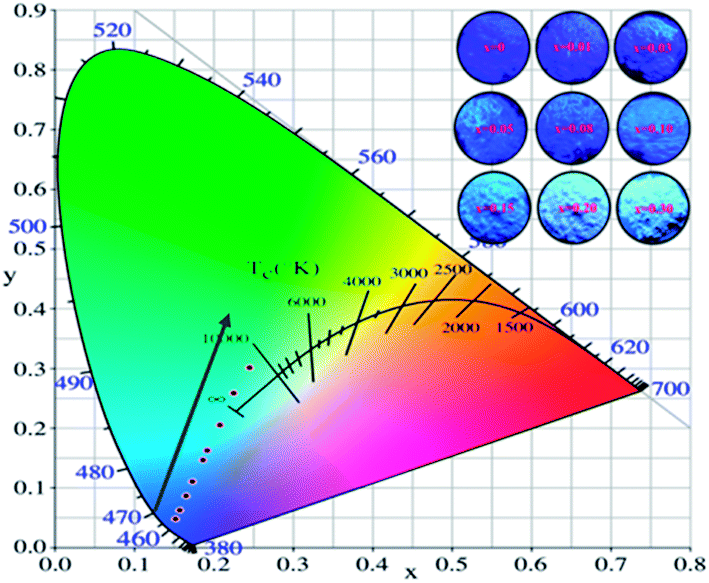
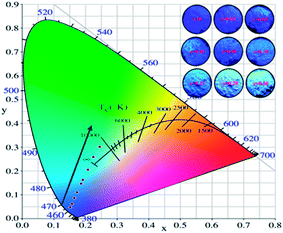
The Commission International de I'Eclairage (CIE) 1931 chromaticity coordinates of the La3Si8N11O4:0.01Ce,xTb were calculated, as shown in Fig. 10. The color can be changed from blue (0.1523, 0.0483) at x = 0 to green (0.2455, 0.3013) at x = 0.3. The green emission of Tb3+ dominates the luminescence when x is up to 0.1, which could be used as a potential green-emitting phosphor in near-UV LED driven white LEDs.
 |
| | Fig. 10 CIE chromaticity coordinates and the color of La3Si8N11O4:0.01Ce,xTb phosphors under the 365 nm irradiation. | |
3.6 Quantum efficiency
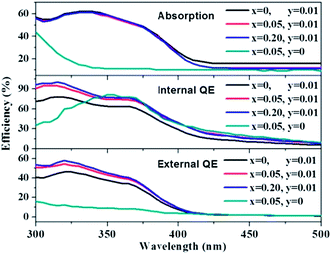
The absorption, internal and external quantum (IQE and EQE) efficiencies of single- and co-doped La3Si8N11O4:Ce,Tb samples under different wavelength excitations are shown in Fig. 11. Due to the stronger absorption in co-doped sample, the absorption, IQE and EQE of the La3Si8N11O4:0.01Ce,0.05Tb under 360 nm excitation are about 55, 76.3 and 46.7%, while those of La3Si8N11O4:0.05Tb are about 11, 77.7 and 8.3%, respectively. The PL intensity of Tb3+ is improved by about 9 times under 360 nm excitation due to the strong energy transfer from Ce3+ to Tb3+, as shown in Fig. 12.
 |
| | Fig. 11 Absorption, quantum efficiency of La3Si8N11O4:0.01Ce,xTb (x = 0, 0.05, 0.20) and La3Si8N11O4:yCe,xTb (y = 0, x = 0.05). | |
 |
| | Fig. 12 PL spectra of La3Si8N11O4:0.2Tb, La3Si8N11O4:0.01Ce and La3Si8N11O4:0.01Ce,0.2Tb under the 360 nm excitation. | |
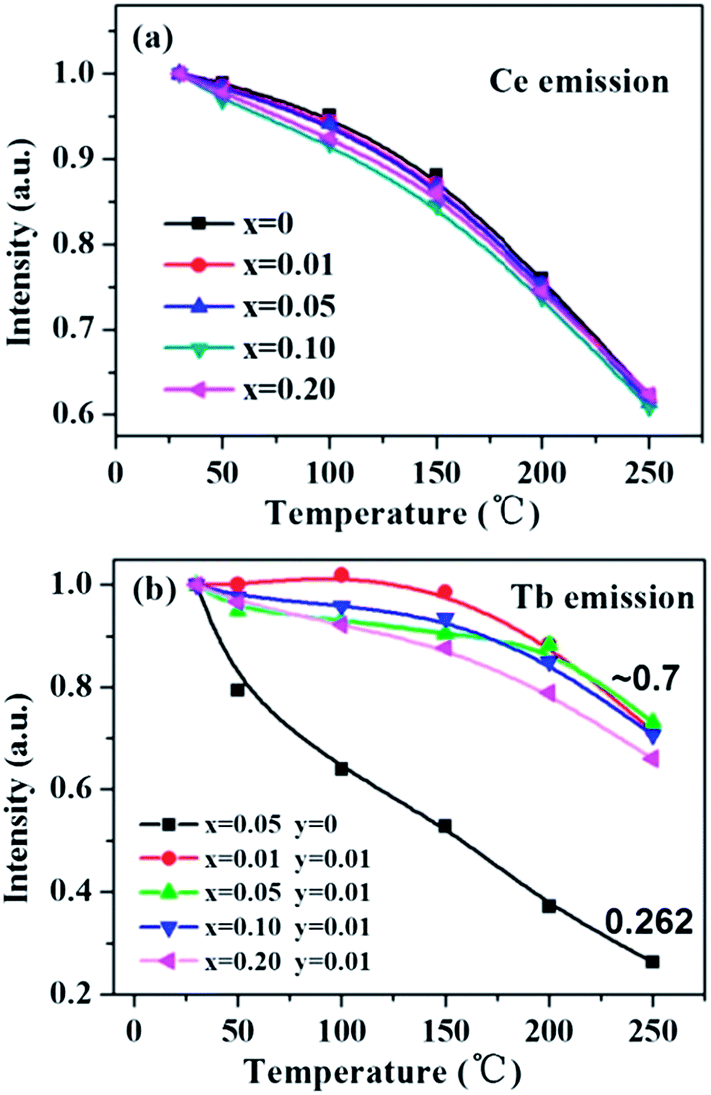
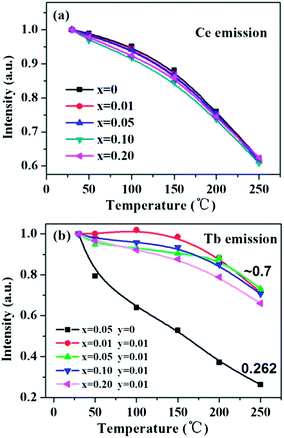
3.7 Thermal quenching
Thermal stability of a phosphor is an indispensable factor that cannot be neglected for its application in white LEDs. Fig. 13 shows the temperature-dependent luminescence of the Ce-, Tb-single doped and co-doped La3Si8N11O4 samples under 360 nm excitation. For the Ce3+ emission at 423 nm, the thermal quenching is nearly equivalent for both the single- and co-doped samples. On the other hand, for the Tb3+ emission, the Ce3+/Tb3+ co-doped La3Si8N11O4 samples show smaller thermal quenching than either the Ce3+- or the Tb3+-doped sample, which indicates that the energy transfer from Ce3+ to Tb3+ contributes significantly to the enhanced thermal stability.
 |
| | Fig. 13 Temperature dependence of (a) the Ce emission intensity in La3Si8N11O4:0.01Ce,xTb and (b) the Tb emission intensity in La3Si8N11O4:yCe,xTb (y = 0, 0.05). | |
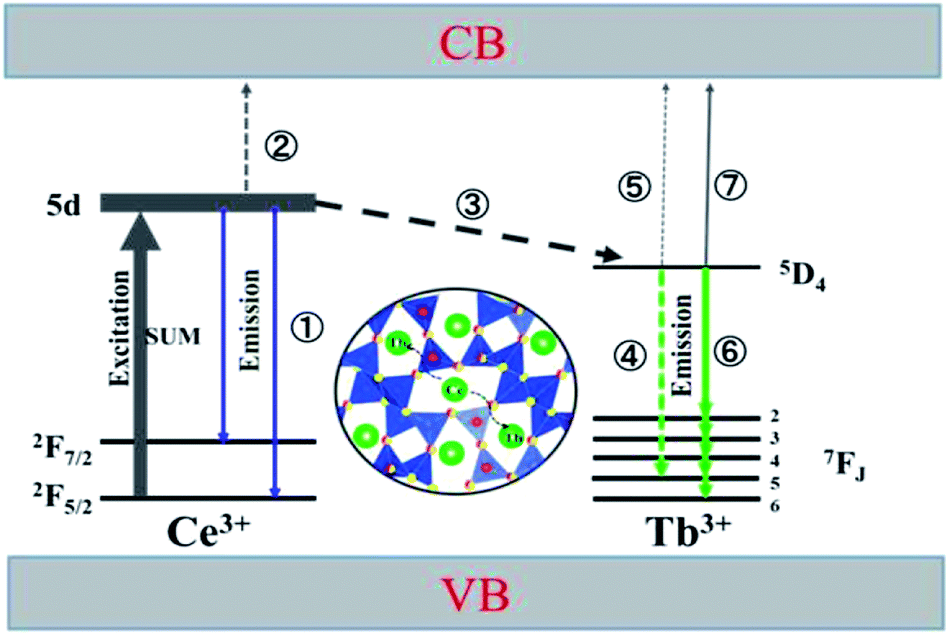
Based on the thermal activation model, the excited 5d electrons of Ce3+ will be mainly involved in three processes, as illustrated in Fig. 14.30 The first process (1), defined as NEM, is the intrinsic emission electrons of the lowest 5d state of Ce3+. The second process (2), defined as NTQ, is the thermal activation electrons and equal to Ae−ΔE/kT (A is a constant, ΔE is the activation energy for thermal quenching, and k is Boltzmann constant). And the third process (3), named as NET, is the energy transfer electrons between Ce3+ and Tb3+. Therefore, the energy transfer efficiency (ηET) can be written as:
| |
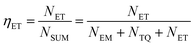 | (1) |
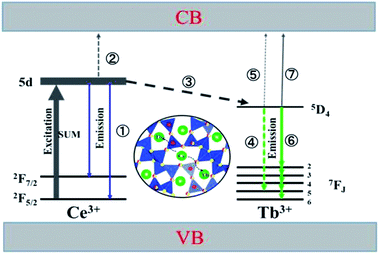 |
| | Fig. 14 The model of the Ce3+ → Tb3+ energy transfer and the emission processes of Ce3+and Tb3+. | |
As the thermal quenching behavior of the Ce3+ luminescence of the single- and co-doped samples is almost the same, the luminescence of Ce3+ changes very little at a certain temperature. It indicates that the change in energy transfer rate is mainly attributed to the thermal activation electrons rather than the intrinsic emission electrons when the temperature increases. Therefore, the number of energy transfer electrons increases, which thus contributes to the increased Tb3+ luminescence in the co-doped samples.
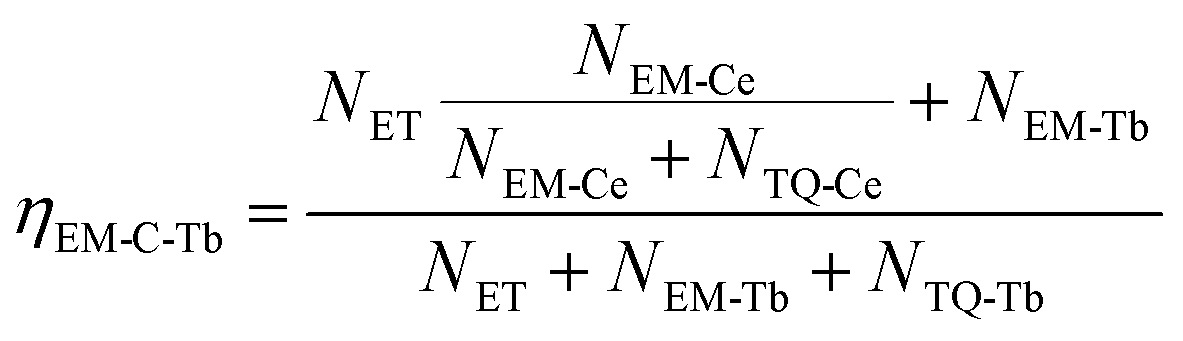
At the same time, the electrons, coming from the energy transfer of Ce3+, will be separated into process 4 (NEM-Ce) and process 5 (NTQ-Ce), which stands for the intrinsic emission and thermal activation electrons of Tb3+. That is to say, the emission of Tb3+ does not contain the intrinsic emission of Tb3+ (process 6, NEM-Tb) but it originated from the energy transfer from Ce3+. Therefore, the temperature-dependent luminescence of Tb3+ in the single-doped (ηEM-S-Tb) and the co-doped sample (ηEM-C-Tb) can be calculated by the following equations:
| |
 | (2) |
| |
 | (3) |
where
NTQ-Tb is the thermal activation electrons of the intrinsic Tb
3+. For the co-doped phosphor, we may infer that the electrons coming from the energy transfer of Ce
3+ mainly contribute to the emission rather than thermal activation, and the emission of Tb
3+ hence shows a higher thermal stability. If
NEM-Ce is smaller than
NTQ-Ce, the emission of Tb
3+ would exhibit a lower thermal stability than that in the single-doped sample.
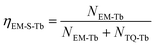
Additionally, as the temperature increases from 30 to 250 °C, the CIE chromaticity coordinates of La3Si8N11O4:0.01Ce,0.20Tb show a small variation (Fig. 15). Compared to the CIE x value, the CIE y value has a greater change. It is mainly due to the increasing ratio of the Tb3+ emission intensity to the Ce3+ one. This agrees well with the faster quenching of the Ce3+ emission with increasing the temperature, as discussed above.
 |
| | Fig. 15 Temperature-dependent (a) CIE chromaticity coordinates and (b) the color point shift of La3Si8N11O4:0.01Ce,0.20Tb sample. | |
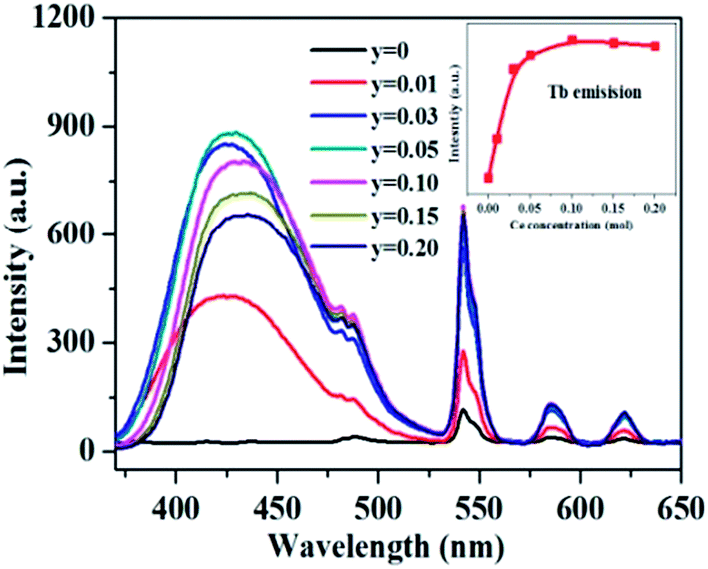
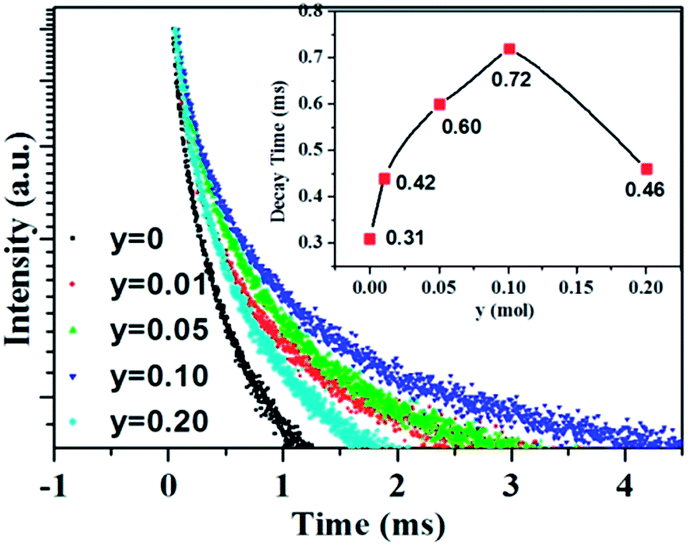
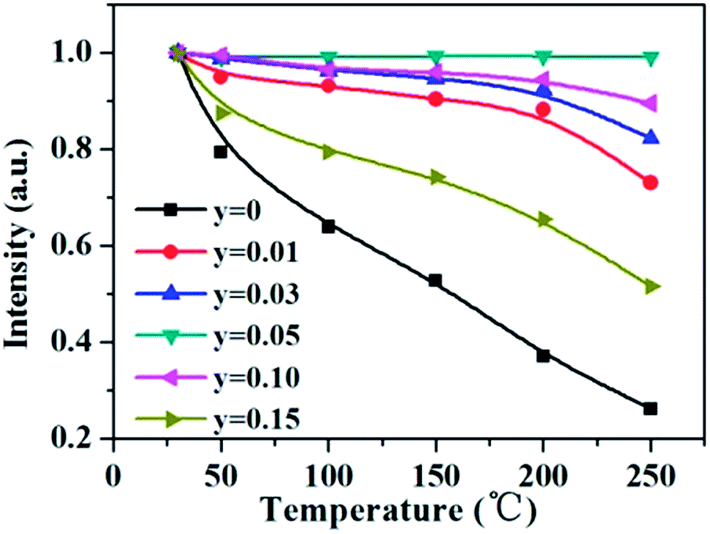
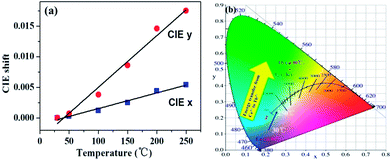
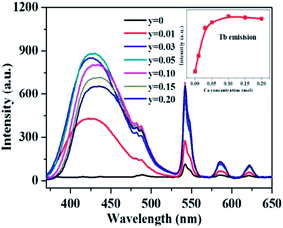
As aforementioned, the temperature-dependent luminescence of Tb3+ (ηEM-C-Tb) will be enhanced owing to the increased number of electrons from Ce3+(NET) via the energy transfer. As seen in Fig. 16, the emission intensity of Tb3+ in La3Si8N11O4:yCe, 0.05Tb (y = 0–0.20) samples is enhanced as the Ce3+ concentration increases. It indicates that the higher Ce3+ concentration generates more electrons that are transferred to Tb3+, which is well accordance with the analysis from eqn (1) and (3). Moreover, the change of the decay time of La3Si8N11O4:yCe,0.05Tb (y = 0–0.20) also provides the evidence that more electrons are transferred from Ce3+ to Tb3+ with increasing the Ce3+ concentration, as shown in Fig. 17. In addition, as shown in Fig. 18, the thermal quenching of the Tb3+ emission in the co-doped La3Si8N11O4:yCe,0.05Tb (y = 0–0.20) samples is smaller than that in the single-doped sample. When the Ce3+ concentration increases, the thermal stability of the Tb3+ emission gradually enhances. At 200 °C, the emission intensity of the single-doped sample (La3Si8N11O4:0.05Tb) declines by 63%, whereas it losses only by 10% in the co-doped samples (La3Si8N11O4:yCe,0.05Tb, y = 0.01–0.10). The small reduction in luminescence of Tb3+ in the co-doped samples implies that the energy transfer from Ce3+ to Tb3+ dominantly contributes to the emission of Tb3+. The thermal quenching of the sample at y = 0.15 becomes much larger than others, which may be due to the increased lattice distortion caused by the substitution of La by Ce and Tb.
 |
| | Fig. 16 PL spectra and the peak intensity of Tb3+ emission under 360 nm excitation in the La3Si8N11O4:yCe,0.05Tb (y = 0–0.15) samples. | |
 |
| | Fig. 17 Luminescence decay curves of the La3Si8N11O4:yCe,0.05Tb (y = 0–0.20) samples under 370 nm excitation, monitored by the peak wavelength of Tb3+ (544 nm). | |
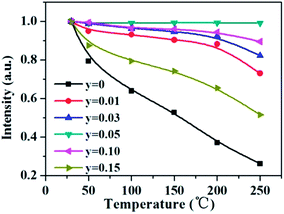 |
| | Fig. 18 Temperature dependence of the Tb3+ emission intensity in La3Si8N11O4:yCe,0.05Tb (y = 0–0.15) under the 360 nm excitation. | |
3.8 Applications in white LEDs
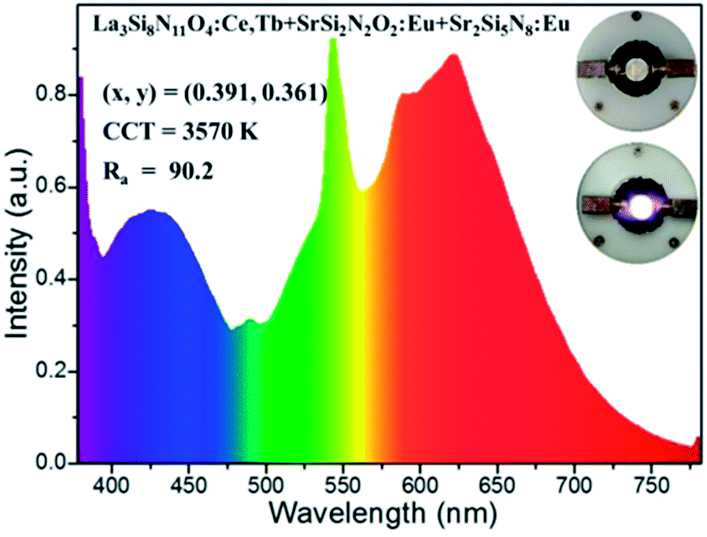
In order to testify the suitability of the blue-green La3Si8N11O4:0.01Ce,0.05Tb phosphor in white LEDs, it was mixed with SrSi2N2O2:Eu (green) and Sr2Si5N8:Eu (red) phosphors to form a phosphor blend, and then pumped by a UV-LED chip (365 nm). As seen in Fig. 19, the white LED has the chromaticity coordinates of x = 0.391, y = 0.361, a correlated color temperature (CCT) of 3570 K and a high color rendering index (CRI) of 90.2. The luminous efficiency of this white LED is as low as 4.4 lm W−1, which is mainly due to the low efficiency of the UV-LED chip (0.78 lm W−1). These results demonstrate that the title phosphor could be a promising blue-green phosphor for use in UV-LED driven white LEDs.
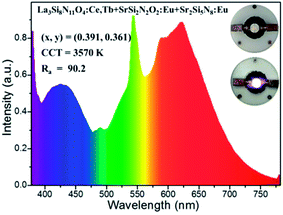 |
| | Fig. 19 The electroluminescence spectrum of the white LED using a UV-LED chip (365 nm) and La3Si8N11O4:0.01Ce,0.05Tb, SrSi2N2O2:Eu and Sr2Si5N8:Eu phosphors. The inset shows images of the white LED (power off and on). | |
4 Conclusions
The energy transfer between Ce3+ and Tb3+ was realized in the co-doped La3Si8N11O4 phosphors. The emission color could be tuned from blue (Ce3+) to green (Tb3+) under the 360 nm excitation, and the Tb3+ luminescence of the co-doped sample was improved by 9 times owing to the energy transfer of Ce3+ → Tb3+. The external quantum efficiency of La3Si8N11O4:0.01Ce,0.05Tb was 46.7% under the 360 nm excitation, which is much higher than that of 8.3% for La3Si8N11O4:0.05Tb. The thermal quenching of the co-doped samples was significantly reduced, with the luminescence loss of Tb3+ emission decreasing from 74 to 30% at 250 °C. A UV-LED driven white LED using La3Si8N11O4:0.01Ce,0.05Tb, SrSi2N2O2:Eu and Sr2Si5N8:Eu phosphors was fabricated, and it had a correlated color temperature of 3570 K, a high color rendering index of 90.2, and a luminous efficacy of 4.4 lm W−1. It indicates that the Ce3+/Tb3+ co-doped La3Si8N11O4 (La3Si8N11O4:0.01Ce,0.05Tb) would be an interesting blue-green phosphor for UV LEDs.
Conflicts of interest
There are no conflicts to declare.
Acknowledgements
We are grateful for the National Nature Science Foundation of China (No. 51502020, 5157223, and 51561135015), the National Basic Research Program of China (No. 2014CB643801), and the National Key Research and Development program (No. 2017YFB0404301).
Notes and references
- R.-J. Xie, N. Hirosaki, N. Kimura, K. Sakuma and M. Mitomo, Appl. Phys. Lett., 2007, 90, 191101 CrossRef.
- Z.-G. Xia and A. Meijerink, Chem. Soc. Rev., 2017, 46(1), 275–299 RSC.
- H.-B. Xu, W.-D. Zhuang, L. Wang, R.-H. Liu, Y.-H. Liu, L.-H. Liu, Y. Cho, N. Hirosaki and R.-J. Xie, Inorg. Chem., 2017, 56, 14170–14177 CrossRef CAS PubMed.
- S. H. Lim, Y. H. Ko, C. Rodriguez, S. H. Gong and Y. H. Cho, Light: Sci. Appl., 2016, 5(2), 16030 CrossRef PubMed.
- W. Lu, J. Huo, Y. Feng, S. Zhao and H. You, Dalton Trans., 2016, 45, 9676–9683 RSC.
- P.-P. Dai, C. Li, X.-T. Zhang, J. Xu, X. Chen, X.-L. Wang, Y. Jia, X.-J. Wang and Y.-C. Liu, Light: Sci. Appl., 2016, 5(2), 16024 CrossRef PubMed.
- P. Pust, V. Weiler, C. Hecht, A. Tucks, A. S. Wochnik, A. K. Henß, D. Wiechert, C. Scheu, P. J. Schmidt and W. Schnick, Nat. Mater., 2014, 13, 891–896 CrossRef CAS PubMed.
- N. Hirosaki, T. Takeda, S. Funahashi and R.-J. Xie, Chem. Mater., 2014, 26, 4280–4288 CrossRef CAS.
- M. Zeuner, S. Pagano and W. Schnick, Angew. Chem., Int. Ed., 2011, 50, 7754–7775 CrossRef CAS PubMed.
- R.-J. Xie and H. T. Bert Hintzen, J. Am. Ceram. Soc., 2013, 96, 665–687 CrossRef CAS.
- S. Schmiechen, H. Schneider, P. Wagatha, C. Hecht, P. J. Schmidt and W. Schnick, Chem. Mater., 2014, 26, 2712–2719 CrossRef CAS.
- Y.-H. Liu, X.-F. Zhou, L. Chen, W.-D. Zhuang, R.-H. Liu and Y.-S. Hu, J. Rare Earths, 2017, 35(3), 223–229 CrossRef CAS.
- T. Takeda, N. Hirosaki, S. Funahshi and R.-J. Xie, Chem. Mater., 2015, 27, 5892–5898 CrossRef CAS.
- R.-J. Xie, N. Hirosaki and T. Takeda, Appl. Phys. Express, 2009, 2, 022401 CrossRef.
- H.-P. Ji, L. Wang, M. S. Molokeev, N. Hirosaki, Z.-H. Huang, Z.-G. Xia, O. M. Kate, L.-H. Liu and R.-J. Xie, J. Mater. Chem. C, 2016, 4, 2359–2366 RSC.
- S.-S. Liang, M.-M. Shang, H.-Z. Lian, K. Li, Y. Zhang and J. Lin, J. Mater. Chem. C, 2017, 5, 2927–2935 RSC.
- W.-T. Chen, H. S. Sheu, R.-S. Liu and J. P. Attfield, J. Am. Chem. Soc., 2012, 134, 8022–8025 CrossRef CAS PubMed.
- W. Lü, H.-W. Xu, J.-S. Huo, B.-Q. Shao, Y. Feng, S. Zhao and H.-P. You, Dalton Trans., 2017, 46, 9272–9279 RSC.
- W.-R. Zhao, W.-D. Zhuang, F. Du, Y.-N. Zhou, Y.-L. Yu and L.-G. Wang, J. Alloys Compd., 2017, 726, 658–663 CrossRef.
- Y. Chen, F.-J. Pan, M. Wang, X.-J. Zhang, J. Wang, M.-M. Wu and C.-X. Wang, J. Mater. Chem. C, 2016, 4, 2367–2373 RSC.
- K. Takahashi, N. Hirosaki, R.-J. Xie, M. Harade, K. Yoshimura and Y. Tomomura, Appl. Phys. Lett., 2007, 91, 091923 CrossRef.
- B. Dierre, R.-J. Xie, N. Hirosaki and T. Sekiguchi, J. Mater. Res., 2007, 22(7), 1933–1941 CrossRef CAS.
- C.-C. Lin, W.-T. Chen, C.-I. Chu, K.-W. Huang, C. W. Yeh, B.-M. Cheng and R.-S. Liu, Light: Sci. Appl., 2016, 5(4), 16066 CrossRef PubMed.
- X.-Y. Fu, S.-H. Zheng, J.-P. Shi, Y.-C. Li and H.-W. Zhang, J. Lumin., 2017, 184, 199–204 CrossRef CAS.
- M.-M. Shang, S.-S. Liang, H.-Z. Lian and J. Lin, Inorg. Chem., 2017, 56, 6131–6140 CrossRef CAS PubMed.
- Z.-G. Xia and R.-S. Liu, J. Phys. Chem. C, 2012, 116, 15604–15609 CrossRef CAS.
- J. S. Kim, P. E. Jeon, Y. H. Park, J. C. Choi, H. L. Park, G. C. Kim and T. W. Kim, Appl. Phys. Lett., 2004, 85, 3696 CrossRef CAS.
- D.-L. Geng, M.-M. Shang, Y. Zhang, H.-Z. Lian and J. Lin, Inorg. Chem., 2013, 52, 13708–13718 CrossRef CAS PubMed.
- G. Li, Y.-H. Wang, W. Zeng, W.-B. Chen, S.-C. Han, H.-J. Guo and Y.-Y. Li, J. Mater. Chem. C, 2016, 4(15), 3304–3312 RSC.
- Y. Xiao, Z.-D. Hao, L.-L. Zhang, W.-G. Xiao, D. Wu, X. Zhang, G.-H. Pan, Y.-S. Luo and J.-H. Zhang, Inorg. Chem., 2017, 56, 4538–4544 CrossRef PubMed.
- F. Du, W.-D. Zhuang, R.-H. Liu, Y.-H. Liu, J.-Y. Zhong, P. Gao, X. Zhang, W. Gao and L.-L. Shao, RSC Adv., 2017, 7, 1075–1081 RSC.
- X. G. Zhang, Y.-M. Huang and M.-L. Gong, J. Chem. Eng., 2017, 307, 291–299 CrossRef CAS.
- L. Wang, R.-J. Xie, T. Suehiro, T. Takeda and N. Hirosaki, Chem. Rev., 2018, 118, 1951–2009 CrossRef CAS PubMed.
- Y. Q. Li, J. E. J. van Steen, J. W. H. van Krevel, G. Botty, A. C. A. Delsing, F. J. DiSalvo, G. de With and H. T. Hintzen, J. Alloys Compd., 2006, 417, 273–279 CrossRef CAS.
- C.-J. Duan, X.-J. Wang, W. M. Otten, A. C. A. Delsing, J.-T. Zhao and H. T. Hintzen, Chem. Mater., 2008, 20, 1597–1605 CrossRef CAS.
- Y.-Q. Li, G. de With and H. T. Hintzen, J. Alloys Compd., 2004, 385, 1–11 CrossRef CAS.
- C. Hecht, F. Stadler, P. Schmidt, W. Schnick, J. S. auf der Günne and V. Baumann, Chem. Mater., 2009, 21, 1595–1601 CrossRef CAS.
- Y.-Q. Li, A. C. A. Delsing, G. de With and H. T. Hintzen, Chem. Mater., 2005, 17, 3242–3248 CrossRef CAS.
- J.-Y. Tang, J.-H. Chen, L.-Y. Hao, X. Xu, W.-J. Xie and Q.-X. Li, J. Lumin., 2011, 131, 1101–1106 CrossRef CAS.
- O. Oeckler, J. A. Kechele, H. Koss, P. J. Schmidt and W. Schnick, Chem.–Eur. J., 2009, 15, 5311–5319 CrossRef CAS PubMed.
- Y. Fukuda, K. Ishida, I. Mitsuishi and S. Nunoue, Appl. Phys. Express, 2009, 2, 012401 CrossRef.
- J. Grins, S. Esmaeilzadeh, G. Svensson and Z. J. Shen, J. Eur. Ceram. Soc., 1999, 19, 2723–2730 CrossRef CAS.
- X.-J. Wang, L. Wang, T. Takeda, S. Funahashi, T. Suehiro, N. Hirosaki and R.-J. Xie, Chem. Mater., 2015, 27, 7689–7697 CrossRef CAS.
- W. B. Park, S. P. Singh, C. Yoon and K. S. Sohn, J. Mater. Chem., 2012, 22, 14068–14075 RSC.
- X.-J. Wang, S. Funahashi, T. Takeda, T. Suehiro, N. Hirosaki and R.-J. Xie, J. Mater. Chem. C, 2016, 4, 9968–9975 RSC.
- R.-J. Xie, N. Hirosaki, M. Mitomo, Y. Yamamoto, T. Suehiro and N. Ohashi, J. Am. Ceram. Soc., 2004, 87, 1368–1370 CrossRef CAS.
- N. Hirosaki, R.-J. Xie and K. Kimoto, Appl. Phys. Lett., 2005, 86, 211905 CrossRef.
- K. Uheda, N. Hirosaki, Y. Yamamoto, A. Naito, T. Nakajima and H. Yamamoto, Electrochem. Solid-State Lett., 2006, 9, 22–25 CrossRef.
- P. Pust, V. Weiler, C. Hecht, A. Tücks, A. S. Wochnik, A. K. Henß, D. Wiechert, C. Scheu, P. J. Schmidt and W. Schnick, Nat. Mater., 2014, 13, 891–896 CrossRef CAS PubMed.
- T. Seto, N. Kijima and N. Hirosaki, ECS Trans., 2009, 25, 247–252 CAS.
- L.-H. Liu, L. Wang, C.-N. Zhang, Y. Cho, B. Dierre, N. Hirosaki, H. Sekiguchi and R.-J. Xie, Inorg. Chem., 2015, 54(11), 5556–5565 CrossRef CAS PubMed.
- X.-F. Song, R.-L. Fu, S. Agathopoulos, H. He, X.-R. Zhao and R. Li, J. Electrochem. Soc., 2010, 157, 34–38 CrossRef.
- C.-Y. Wang, T. Takeda, O. M. ten Kate, M. Tansho, K. Deguchi, K. Takahashi, R.-J. Xie, T. Shimizu and N. Hirosaki, ACS Appl. Mater. Interfaces, 2017, 9(27), 22665–22675 CrossRef CAS PubMed.
- B. Dierre, R.-J. Xie, N. Hirosaki and T. Sekiguchi, J. Mater. Res., 2007, 22(7), 1933–1941 CrossRef CAS.
- K. Ohkubo and T. J. Shigeta, Journal of the Illuminating Engineering Institute of Japan, 1999, 83, 87 CrossRef.
- J. Grins, Z. Shen, S. Esmaeilzadeh and P. Berastegui, J. Mater. Chem., 2001, 11, 2358–2362 RSC.
- R. D. Shannon, Acta Crystallogr., 1976, 32, 751–767 CrossRef.
- D. L. Dexter, J. Chem. Phys., 1953, 21, 836–850 CrossRef CAS.
- G. Blass, Philips Res. Rep., 1969, 24, 131 Search PubMed.
- D. L. Dexter and J. A. Schulaman, J. Chem. Phys., 1954, 22, 1063–1070 CrossRef CAS.
Footnote |
| † Electronic supplementary information (ESI) available: Ionic radii (Å) of La3+, Ce3+, Tb3+ for the given coordination number (CN) (Table S1) and EDS spectrum of La3Si8N11O4:0.01Ce,0.2Tb (Fig. S1). See DOI: 10.1039/c8ra07011c |
|
| This journal is © The Royal Society of Chemistry 2018 |
Click here to see how this site uses Cookies. View our privacy policy here. 
 Open Access Article
 This Open Access Article is licensed under a Creative Commons Attribution-Non Commercial 3.0 Unported Licence
 *a,
Rong-Hui Liu*a,
Yuan-Hong Liua,
Tian-Liang Zhoub,
Yujin Choc,
Wei Gaoa,
Chun-Pei Yana,
Naoto Hirosakic and
Rong-Jun Xie
*a,
Rong-Hui Liu*a,
Yuan-Hong Liua,
Tian-Liang Zhoub,
Yujin Choc,
Wei Gaoa,
Chun-Pei Yana,
Naoto Hirosakic and
Rong-Jun Xie